Unmitigated MTF High Low Pro - Cave Diving Bookmap Heatmap Plot
Unmitigated MTF High Low Pro - Cave Diving Bookmap Heatmap Plot
---
## 📖 Table of Contents
1. (#what-this-indicator-does)
2. (#core-concepts)
3. (#visual-components)
4. (#the-cave-diving-framework)
5. (#how-to-use-it-for-trading)
6. (#settings--customization)
7. (#best-practices)
8. (#common-scenarios)
---
## What This Indicator Does
The **Unmitigated MTF High Low v2.0** tracks unmitigated (untouch) high and low levels across multiple timeframes, helping you identify key support and resistance zones that the market hasn't revisited yet. Think of it as a sophisticated memory system for price action - it remembers where price has been, and more importantly, where it *hasn't been back to*.
### Why "Unmitigated" Matters
In futures trading, especially on instruments like NQ and ES, the market has a tendency to revisit levels where liquidity was left behind. An "unmitigated" level is one that hasn't been touched since it was formed. These levels often act as magnets for price, and understanding their age and proximity gives you a significant edge in:
- **Entry timing** - Waiting for price to approach tested levels
- **Exit planning** - Taking profits before ancient resistance/support
- **Risk management** - Avoiding entries when approaching multiple old levels
- **Liquidity mapping** - Visualizing where orders likely cluster
---
## Core Concepts
### 1. **Sessions & Age**
The indicator uses **New York trading sessions** (6:00 PM to 5:59 PM NY time) as the primary time measurement. This aligns with how futures markets naturally segment their activity.
**Age Categories:**
- 🟢 **New (0-1 sessions)** - Fresh levels, recently formed
- 🟡 **Medium (2-3 sessions)** - Tested by time, gaining significance
- 🔴 **Old (4-6 sessions)** - Highly significant, survived multiple days
- 🟣 **Ancient (7+ sessions)** - Extreme significance, major support/resistance
The longer a level remains unmitigated, the more significant it becomes. Think of it like compound interest - time adds weight to these zones.
### 2. **Multi-Timeframe Tracking**
You can set the indicator to track high/low levels from any timeframe (default is 15 minutes). This means you're watching for unmitigated 15-minute highs and lows while trading on, say, a 1-minute or 5-minute chart.
**Why this matters:**
- Higher timeframe levels have more weight
- You can see multiple timeframe structure simultaneously
- Helps you avoid fighting larger timeframe momentum
### 3. **Mitigation**
A level becomes "mitigated" (deactivated) when price touches it:
- **High levels** are mitigated when price reaches or exceeds them
- **Low levels** are mitigated when price reaches or goes below them
Once mitigated, the level disappears from view. The indicator only shows you the untouch levels that still matter.
---
## Visual Components
### 📊 The Dashboard Table
Located in the corner of your chart (configurable), the table shows:
```
┌─────────┬───────────┬────────┬─────┬───────┐
│ Level │ Price │ Points │ Age │ % │
├─────────┼───────────┼────────┼─────┼───────┤
│ ↑↑↑↑↑ │ 21,450.25 │ +45.50 │ 8 │ +0.21%│ ← 5th High (Ancient)
│ ↑↑↑↑ │ 21,430.00 │ +25.25 │ 5 │ +0.12%│ ← 4th High (Old)
│ ↑↑↑ │ 21,420.50 │ +15.75 │ 3 │ +0.07%│ ← 3rd High (Medium)
│ ↑↑ │ 21,412.00 │ +7.25 │ 1 │ +0.03%│ ← 2nd High (New)
│ ↑ ⚠️ │ 21,408.25 │ +3.50 │ 0 │ +0.02%│ ← 1st High (Proximity Alert!)
├─────────┼───────────┼────────┼─────┼───────┤
│ 15 mins │ 🟢 │ Δ 8.75 │ 2U │ │ ← Status Row
├─────────┼───────────┼────────┼─────┼───────┤
│ ↓ ⚠️ │ 21,399.50 │ -5.25 │ 0 │ -0.02%│ ← 1st Low (Proximity Alert!)
│ ↓↓ │ 21,395.00 │ -9.75 │ 2 │ -0.05%│ ← 2nd Low (Medium)
│ ↓↓↓ │ 21,385.25 │ -19.50 │ 4 │ -0.09%│ ← 3rd Low (Old)
│ ↓↓↓↓ │ 21,370.00 │ -34.75 │ 6 │ -0.16%│ ← 4th Low (Old)
│ ↓↓↓↓↓ │ 21,350.75 │ -54.00 │ 9 │ -0.25%│ ← 5th Low (Ancient)
├─────────┼───────────┼────────┼─────┼───────┤
│ 📊 15↑ / 12↓ │ ← Statistics (optional)
└─────────┴───────────┴────────┴─────┴───────┘
```
**Reading the Table:**
- **Level Column**: Number of arrows indicates position (1-5), color shows age
- **Price**: The actual price level
- **Points**: Distance from current price (+ for highs, - for lows)
- **Age**: Number of full sessions since creation
- **%**: Percentage distance from current price
- **⚠️**: Proximity alert - price is within threshold distance
- **Status Row**: Shows timeframe, direction (🟢 bullish/🔴 bearish), tunnel width (Δ), and Strat pattern
### 📈 Visual Elements on Chart
**1. Level Lines**
- Horizontal lines showing each unmitigated level
- **Color-coded by age**: Bright colors = new, darker = older, deep purple/teal = ancient
- **Line style**: Customizable (solid, dashed, dotted)
- Automatically turn **yellow** when price gets close (proximity alert)
**2. Price Labels**
- Show the exact price and age: "21,450.25 (8d)"
- Fixed at small size for clean readability
- Positioned with configurable offset from current bar
**3. Bands (Optional)**
- Shaded zones between pairs of unmitigated levels
- Default: Between 1st and 2nd levels (the "tunnel")
- Can switch to 1st-3rd, 2nd-3rd, or disable entirely
- **Upper band** (pink/maroon) - Between unmitigated highs
- **Lower band** (blue/teal) - Between unmitigated lows
- These represent the "no man's land" or consolidation zones
---
## The Cave Diving Framework
This indicator is designed around the **Cave Diving Trading Framework** - a psychological and technical approach that maps cave diving safety protocols to futures trading risk management.
### 🤿 The Core Metaphor
**Cave diving has clear danger zones based on depth and overhead environment. Your trading should too.**
#### Shallow Water (New Levels, 0-1 Sessions)
- **Light**: Bright colors (bright red highs, bright green lows)
- **Psychology**: Fresh territory, recently tested
- **Trading**: Be aware but not overly concerned
- **Cave Diving Parallel**: You can see the surface, easy exit
#### Penetration Depth (Medium Levels, 2-3 Sessions)
- **Light**: Medium intensity colors
- **Psychology**: Building significance, market memory forming
- **Trading**: Start respecting these levels for entries/exits
- **Cave Diving Parallel**: Deeper in, need to track your line back
#### Deep Dive Zone (Old Levels, 4-6 Sessions)
- **Light**: Dark colors (deep maroon, dark blue)
- **Psychology**: Highly tested support/resistance
- **Trading**: Major decision points, plan accordingly
- **Cave Diving Parallel**: Significant overhead, careful navigation required
#### Overhead Environment (Ancient Levels, 7+ Sessions)
- **Light**: Very dark, purple/deep teal
- **Psychology**: Extreme caution required, major liquidity zones
- **Trading**: These are your "turn back" signals - don't fight ancient levels
- **Cave Diving Parallel**: Maximum danger, no room for error
### 🎯 The Proximity Alert System
Just like a cave diver's depth gauge that warns at critical thresholds, the proximity alerts (⚠️) tell you when you're entering a danger zone. When price gets within your configured threshold (default 5 points), the indicator:
- Highlights the level in **yellow** on the chart
- Shows **⚠️** in the table
- Signals: "You're entering a high-significance zone - adjust your position accordingly"
This prevents the trading equivalent of going deeper into a cave without checking your air supply.
---
## How to Use It for Trading
### 🎯 Entry Strategies
**1. The "Bounce Setup" (Mean Reversion)**
- Wait for price to approach an old or ancient unmitigated level
- Look for confluence: multiple levels nearby, bands narrowing
- Enter when price shows rejection (reversal candle patterns)
- **Example**: Price drops to a 6-session-old low, shows bullish engulfing → Long entry
**2. The "Break and Retest" (Trend Following)**
- Wait for price to break through an unmitigated level (mitigates it)
- Enter on the retest of the newly broken level
- **Example**: Price breaks above 4-session-old high → Wait for pullback to that level → Long entry
**3. The "Tunnel Trade" (Range Trading)**
- When bands are active, trade the range between 1st-2nd levels
- Short near upper band resistance, long near lower band support
- Exit at opposite side or when bands break
### 🚨 Risk Management Rules
**The Ancient Level Rule**
> Never fight ancient levels (7+ sessions). If you're long and approaching an ancient high, take profits. If you're short and approaching an ancient low, take profits.
These levels have survived a full trading week without being touched - there's likely significant liquidity and institutional interest there.
**The Proximity Exit Rule**
> When you see ⚠️ proximity alerts on multiple levels above/below your position, tighten stops or scale out.
This is your "overhead environment" warning. You're in dangerous territory.
**The New Level Filter**
> Be cautious taking positions based solely on new levels (0-1 sessions). Wait for them to age or combine with other confluence.
Fresh levels haven't been tested by time. They're like unconfirmed support/resistance.
### 📊 Reading Market Structure
**Bullish Structure (🟢 in status row)**
- Unmitigated lows are aging and holding
- Price respecting the lower band
- Old lows below acting as strong support
- **Bias**: Look for long entries at lower levels
**Bearish Structure (🔴 in status row)**
- Unmitigated highs are aging and holding
- Price respecting the upper band
- Old highs above acting as strong resistance
- **Bias**: Look for short entries at higher levels
**The Tunnel Compression**
- When the Δ (delta) in the status row is small, levels are tight
- This often precedes a breakout
- **Trading**: Wait for breakout direction, then trade the break
### 🔄 Strat Integration
The indicator shows Strat patterns in the status row:
- **1** - Inside bar (consolidation)
- **2U** - Broke high only (bullish)
- **2D** - Broke low only (bearish)
- **3** - Broke both (wide range, volatility)
Use these with the unmitigated levels:
- **2U near old high** → Potential resistance, watch for rejection
- **2D near old low** → Potential support, watch for bounce
- **3 pattern** → High volatility, respect wider stops
---
## Settings & Customization
### 📅 Session & Timeframe Settings
**HL Interval** (Default: 15 minutes)
- The timeframe for high/low calculation
- **Lower (1m, 5m)**: More levels, more noise, good for scalping
- **Higher (30m, 1H, 4H)**: Fewer levels, stronger significance, good for swing trading
- **Recommendation for NQ/ES**: 15m or 30m for day trading, 1H for swing trading
**Session Age Threshold** (Default: 2)
- How many sessions before a level is considered "old"
- Lower = more levels classified as old
- Higher = stricter definition of significance
### 📊 Level Display Options
**Show Level Lines**
- Toggle: Display horizontal lines for each level
- **Turn off** if you prefer a cleaner chart and only want the table
**Show Level Labels**
- Toggle: Display price labels on the chart
- **Turn off** for minimal visual clutter
**Label Offset**
- Distance (in bars) from current price bar to place labels
- Increase if labels overlap with price action
**Level Line Width & Style**
- Customize visual appearance
- **Thin solid**: Minimal distraction
- **Thick dashed**: High visibility
### 🎨 Age-Based Color Coding
Customize colors for each age category (high and low separately):
- **New (0-1 sessions)**: Default bright red/green
- **Medium (2-3 sessions)**: Default medium intensity
- **Old (4+ sessions)**: Default dark red/blue
- **Ancient (7+ sessions)**: Default deep purple/teal
**Color Strategy Tips:**
- Keep ancient levels in highly contrasting colors
- Use opacity (transparency) if you want subtler lines
- Match your chart's color scheme for aesthetic coherence
### 🎯 Band Settings
**Band Mode**
- **1st-2nd** (Default): The primary "tunnel" between most recent levels
- **1st-3rd**: Wider band, more room for price action
- **2nd-3rd**: Band between less immediate levels
- **Disabled**: No bands, lines only
**Band Colors & Borders**
- Customize fill color and border separately
- **Tip**: Keep bands very transparent (90-95% transparency) to avoid obscuring price action
### ⚠️ Proximity Alert Settings
**Enable Proximity Alerts**
- Toggle: Turn on/off the warning system
- When enabled, levels within threshold distance show ⚠️ and turn yellow
**Alert Threshold** (Default: 5.0 points)
- Distance in points to trigger the alert
- **For NQ**: 5-10 points is reasonable
- **For ES**: 2-5 points is reasonable
- **For MES/MNQ**: Scale down proportionally
**Alert Highlight Color**
- The color lines/labels turn when proximity is triggered
- Default: Yellow (high visibility)
### 📋 Table Settings
**Show Table**
- Toggle: Display the dashboard table
**Table Location**
- Top Left, Top Right, Bottom Left, Bottom Right
- Choose based on your chart layout and other indicators
**Text Size**
- Tiny, Small, Normal, Large
- **Recommendation**: Normal for 1080p monitors, Small for 4K
**Show % Distance**
- Toggle: Add percentage distance column to table
- Useful for comparing relative distances across different price ranges
**Show Statistics Row**
- Toggle: Show total count of unmitigated highs/lows
- Format: "📊 15↑ / 12↓" (15 unmitigated highs, 12 unmitigated lows)
- Useful for gauging overall market structure
### ⚡ Performance Settings
**Enable Level Cleanup**
- Automatically remove very old levels to maintain performance
- **Keep on** unless you want unlimited history
**Max Lookback Levels** (Default: 10,000)
- Maximum number of levels to track
- 10,000 ≈ 6+ months of 15-minute bars
- **Increase** if you want more history
- **Decrease** if experiencing performance issues
**Max Boxes Per Band** (Default: 245)
- TradingView limit is 500 total boxes
- With 2 bands, 245 each = 490 total (safe maximum)
---
## Best Practices
### 🎯 Position Management
**1. Scaling In Near Old Levels**
```
Price approaching 5-session-old low:
- First position: 30% size at proximity alert (⚠️)
- Second position: 40% size at exact level
- Third position: 30% size if it shows strong rejection
```
**2. Scaling Out Near Ancient Levels**
```
Holding long position, approaching 8-session-old high:
- Exit 50% at proximity alert (⚠️)
- Exit 30% at exact level
- Trail stop on remaining 20%
```
### 🧠 Trading Psychology Integration
Drawing from principles in *The Mountain Is You*, this indicator helps you:
**1. Recognize Self-Sabotage Patterns**
- **The Premature Entry**: Entering before price reaches your planned level
- **Solution**: Set alerts at unmitigated levels, wait for proximity warnings
- **The Profit-Taking Problem**: Exiting too early from fear
- **Solution**: Identify the next unmitigated level and commit to holding until proximity alert
- **The Loss Holding**: Refusing to exit losing trades
- **Solution**: When price breaks through and mitigates your entry level, it's telling you the structure changed
**2. Building Better Habits**
The color-coded age system trains your brain to:
- Respect levels that have proven themselves over time
- Distinguish between noise (new levels) and structure (old levels)
- Make decisions based on objective data, not fear or greed
**3. Emotional Regulation**
The proximity alerts serve as:
- **Circuit breakers** - Forcing you to re-evaluate before dangerous zones
- **Permission to act** - Giving you objective signals to exit without second-guessing
- **Validation** - Confirming when you're in alignment with market structure
### 📝 Pre-Market Routine
**Daily Setup Checklist:**
1. ✅ Identify the 3 nearest unmitigated highs above current price
2. ✅ Identify the 3 nearest unmitigated lows below current price
3. ✅ Note which are ancient (7+) - these are your "no-go" zones
4. ✅ Check the tunnel width (Δ in status row) - tight or wide?
5. ✅ Set alerts at the 1st high and 1st low for proximity warnings
6. ✅ Plan: "If we go up, I exit at ___. If we go down, I enter at ___."
### 🔄 Timeframe Confluence
**Multi-Timeframe Strategy:**
Run the indicator on **three instances**:
- **15-minute** (short-term structure)
- **1-hour** (intermediate structure)
- **4-hour** (major structure)
**Strong Setup**: When all three timeframes show unmitigated levels converging at the same price zone.
**Example:**
- 15m: Old low at 21,400
- 1H: Ancient low at 21,398
- 4H: Ancient low at 21,395
- **Result**: 21,395-21,400 is a monster support zone
### ⚠️ What This Indicator Doesn't Do
**Not a Crystal Ball**
- It doesn't predict where price will go
- It shows you where price *hasn't been* and how long it's been avoided
- The trading decisions are still yours
**Not an Entry Signal Generator**
- It provides context and structure
- You need to combine it with your entry methodology (price action, indicators, order flow, etc.)
**Not Foolproof**
- Ancient levels get broken
- Proximity alerts can trigger early in strong trends
- The market doesn't "owe" you a reversal at any level
---
## Common Scenarios
### Scenario 1: "Level Cluster Ahead"
**Situation**: You're long at 21,400. The table shows:
- 1st High: 21,425 (2 sessions old)
- 2nd High: 21,428 (3 sessions old)
- 3rd High: 21,435 (6 sessions old)
**Interpretation**: There's a resistance cluster just 25-35 points away. The 6-session-old level is particularly significant.
**Action**:
- Set first profit target at 21,420 (before the cluster)
- Set second target at 21,426 (between 1st and 2nd)
- Trail remaining position, but be ready to exit on rejection at 21,435
**Cave Diving Analogy**: You're approaching an overhead section with limited clearance. Lighten your load (reduce position) before entering.
---
### Scenario 2: "Ancient Level Approaches"
**Situation**: The market is grinding higher. You see ⚠️ appear next to a 9-session-old high at 21,500.
**Interpretation**: This level has survived over a week without being touched. Massive potential liquidity zone.
**Action**:
- If long, this is your absolute exit zone. Take profits before or at level.
- If looking to short, wait for clear rejection (price taps and reverses)
- Don't try to buy the breakout until it clearly breaks and retests
**Cave Diving Analogy**: Your dive computer is beeping - you've reached your planned turn-back depth. No matter how interesting it looks ahead, honor your plan.
---
### Scenario 3: "Mitigated Levels Create New Structure"
**Situation**: Price breaks and mitigates the 1st High. The previous 2nd High becomes the new 1st High.
**Interpretation**: The structure just shifted. What was the 2nd level is now most relevant.
**Action**:
- Watch how price reacts to the newly-mitigated level
- If it holds below (acts as resistance), bearish
- If it reclaims and holds above (acts as support), bullish
- The NEW 1st High is your next target/resistance
**Cave Diving Analogy**: You've passed through a restriction - the cave layout ahead is different now. Update your mental map.
---
### Scenario 4: "Tight Tunnel, Upcoming Breakout"
**Situation**: The Δ in the status row shows 3.25 points (very tight). Bands are converging.
**Interpretation**: Price is consolidating between very close unmitigated levels. Breakout likely.
**Action**:
- Don't try to predict direction
- Set alerts above 1st High and below 1st Low
- When break occurs, trade the retest
- Expect volatility - use wider stops
**Cave Diving Analogy**: You're in a narrow passage. Movement will be sudden and directional once it starts.
---
### Scenario 5: "Imbalanced Structure"
**Situation**: The statistics row shows "📊 22↑ / 7↓"
**Interpretation**: There are many more unmitigated highs than lows. This suggests:
- Price has been declining (hitting lows, leaving highs behind)
- Potential bullish reversal zone (lots of overhead supply mitigated)
- Or continued bearish structure (resistance everywhere above)
**Action**:
- Look at the age of those 22 highs
- If mostly new (0-2 sessions): Just a recent downmove, not significant yet
- If many old/ancient: Strong overhead resistance, be cautious on longs
- Compare to price action: Is price respecting the remaining lows?
**Cave Diving Analogy**: You've swam deeper than your starting point - most of your markers are above you now. Are you planning the ascent or going deeper?
---
## Final Thoughts: The Philosophy
This indicator is built on a simple but powerful principle: **The market has memory, and that memory has weight.**
Every unmitigated level represents:
- Liquidity left behind
- Orders waiting to be filled
- Institutional interest potentially parked
- Psychological significance for participants
The longer a level remains unmitigated, the more "charged" it becomes. When price finally revisits it, something significant usually happens - either a strong reversal or a definitive break.
Your job as a trader isn't to predict which outcome will occur. Your job is to:
1. **Recognize** when you're approaching these charged zones
2. **Respect** them by adjusting position size and risk
3. **React** appropriately based on how price behaves at them
4. **Remember** that ancient levels (like ancient wisdom) deserve extra reverence
The Cave Diving Framework embedded in this indicator serves as a constant reminder: Trading, like cave diving, requires rigorous respect for environmental hazards, meticulous planning, and the discipline to turn back when your limits are reached.
**Every proximity alert is the market asking you**: *"Do you really want to go deeper?"*
Sometimes the answer is yes - when your setup, confluence, and risk management all align.
Often, the answer should be no - and that's the trader avoiding the accident that would have happened to the gambler.
---
### 🎯 Quick Reference Card
**Color System:**
- 🟢 Bright colors = New (0-1 sessions) = Shallow water
- 🟡 Medium colors = Medium (2-3 sessions) = Penetration depth
- 🔴 Dark colors = Old (4-6 sessions) = Deep dive zone
- 🟣 Deep dark colors = Ancient (7+ sessions) = Overhead environment
**Symbols:**
- ↑ ↑↑ ↑↑↑ ↑↑↑↑ ↑↑↑↑↑ = High levels (1st through 5th)
- ↓ ↓↓ ↓↓↓ ↓↓↓↓ ↓↓↓↓↓ = Low levels (1st through 5th)
- ⚠️ = Proximity alert (danger zone)
- 🟢 = Bullish structure
- 🔴 = Bearish structure
- Δ = Tunnel width (distance between 1st high and 1st low)
**Critical Rules:**
1. Never fight ancient levels (7+ sessions)
2. Respect proximity alerts (⚠️)
3. Scale out near old/ancient resistance
4. Wait for confluence when entering
5. Let mitigated levels prove their new role
---
**Remember**: The indicator gives you structure. The trading edge comes from your discipline in respecting that structure.
Trade safe, trade smart, and always know your exit before your entry. 🎯
---
*"You don't become your best self by denying your patterns. You become your best self by recognizing them, understanding them, and choosing differently." - Adapted from The Mountain Is You*
In trading: You don't become profitable by ignoring market structure. You become profitable by recognizing it, understanding it, and choosing your entries accordingly.
Indikatoren und Strategien

ICT Unicorn Model [Kodexius]ICT Unicorn Model is a market structure and imbalance confluence tool that automatically detects high probability “Unicorn” setups by combining three key elements into a single, clean script:
-A first, clean break of that swing level (displacement style break)
-A Fair Value Gap that overlaps a breaker candle body range
Instead of plotting every pivot or every imbalance independently, the script waits for a specific sequence: price establishes a valid swing, breaks that swing for the first time, and prints a setup only when the resulting context aligns with a valid, volatility filtered FVG and a clearly defined breaker range.
Each detected setup is drawn directly on the chart with labeled zones (Breaker and FVG) and is then actively monitored. If price violates the breaker boundary based on your chosen invalidation basis (Close or Wick), the setup is marked inactive and can optionally be removed to keep the chart clean.
This indicator is designed for traders who work with ICT style concepts such as liquidity runs, displacement, breaker blocks, and imbalance reversion, and who want a structured, rules based visualization rather than discretionary drawing.
🔹 Features
🔸 Fair Value Gap Detection With Volatility Filtering
Bullish and bearish FVGs are detected using classic three candle imbalance logic. To avoid low quality gaps during compression, the script applies an ATR based minimum size filter using the “FVG Min Size (ATR Multiplier)” input. Only gaps larger than ATR * threshold are considered valid.
🔸 First Break Validation (Clean Break Logic)
A key part of the model is identifying a “first break” of a swing level. The script checks whether the swing price has already been invalidated between the swing bar and the current bar. If it has, the swing is ignored. This helps reduce repeated signals and focuses on fresh structural breaks.
🔸 Breaker and FVG Confluence With Overlap Requirement
After a valid break occurs, the script defines a breaker range using the body of the swing candle (open and close). A setup is only created if this breaker body range overlaps the detected FVG price range. This overlap requirement is what filters many “almost” conditions and keeps signals more selective.
Bullish Unicorn:
Bearish Unicorn:
🔸 Configurable Invalidation Basis (Close or Wick)
You can choose how a setup fails:
-Close: invalidation requires a candle close beyond the breaker boundary
-Wick: invalidation occurs as soon as any wick crosses beyond the breaker boundary
This allows the tool to adapt to different trading styles, from conservative confirmation to more sensitive risk control.
🔸 Automatic Cleanup of Failed Setups
If “Delete Invalidated Setups” is enabled, the script removes the breaker box, FVG box, and label as soon as the setup is invalidated. If disabled, the zones remain visible for review while the setup is marked inactive internally.
🔸 Clear Chart Visuals
Each setup plots:
-A labeled Breaker zone box
-A labeled FVG zone box
-A directional Unicorn label (Bull or Bear) that updates position as the chart advances
Colors for bullish and bearish structures are fully configurable.
🔸 Alert Conditions
Two alert conditions are provided:
-Bullish Unicorn Setup Detected
-Bearish Unicorn Setup Detected
Alerts trigger only on the bar a new setup is created.
🔹 Calculations
This section summarizes the main computations used internally. The goal here is to explain the model mechanics rather than reproduce every implementation detail.
1. Swing Detection (Pivot High / Pivot Low)
Swing levels are detected using a symmetric pivot definition with “Swing Length” bars on both sides:
float ph = ta.pivothigh(high, swingLength, swingLength)
float pl = ta.pivotlow(low, swingLength, swingLength)
When a pivot is confirmed, its price and originating bar index are stored:
-Swing High: price = pivot high, isHigh = true
-Swing Low: price = pivot low, isHigh = false
The script keeps a limited history (most recent swings) to stay efficient.
2. Fair Value Gap Detection
FVGs use the classic three candle displacement imbalance:
Bullish FVG condition
bool isBullFVG = high < low
Bullish gap range is defined as:
-Top = low
-Bottom = high
Bearish FVG condition
bool isBearFVG = low > high
Bearish gap range is defined as:
-Top = low
-Bottom = high
3. ATR Based Minimum Gap Filter
ATR is computed (length 14), then the gap size is compared against a user threshold:
float atr = ta.atr(14)
bool validBullFVG = isBullFVG and (bullFvgTop - bullFvgBot) > (atr * fvgThreshold)
bool validBearFVG = isBearFVG and (bearFvgTop - bearFvgBot) > (atr * fvgThreshold)
This prevents very small imbalances from generating setups in low volatility conditions.
4. “First Break” Check Using Level Invalidation Scan
Before accepting a swing break, the script scans forward from the swing bar to the current bar to confirm the level has not already been breached. The scan can be based on wick or close:
-Wick mode: uses high or low
-Close mode: uses close
Conceptually:
priceToCheck = mode == "Wick" ? (checkBelow ? low : high) : close
If a prior breach is found, the swing is treated as already invalidated and is ignored for setup creation.
5. Break Of Structure Condition
Bullish break requirement
A bullish setup requires breaking a stored swing high with bullish body intent:
-close > swingHighPrice
-open < close
Bearish break requirement
A bearish setup requires breaking a stored swing low with bearish body intent:
-close < swingLowPrice
-open > close
An additional proximity filter is applied in the bearish branch to reduce weak or overly extended breaks by requiring the prior close to be reasonably near the swing level.
6. Breaker Range Construction
Once a qualifying swing is found, the breaker range is derived from the body of the swing candle (the candle at the swing bar index). The body boundaries are:
float breakerTop = math.max(bOpen, bClose)
float breakerBot = math.min(bOpen, bClose)
This models the breaker as the candle body range rather than full wick range, which typically produces more practical invalidation boundaries.
7. Overlap Test Between Breaker and FVG
A setup is only created if the breaker body overlaps the FVG zone. Conceptually the script rejects cases where one range is fully above or fully below the other:
-If there is no overlap, no setup is created
-If overlap exists, the Unicorn setup is valid
8. Active Monitoring and Invalidation
Each setup remains active until invalidated. Invalidation is evaluated every bar using your selected basis:
-Close basis: compares close to breaker boundary
-Wick basis: compares high or low to breaker boundary
Bullish invalidation
Setup fails if price crosses below breaker bottom.
Bearish invalidation
Setup fails if price crosses above breaker top.
If deletion is enabled, all drawings related to that setup are removed immediately on invalidation.
9. Drawing Updates and Object Lifecycle
Breaker and FVG boxes are extended to the right while the setup is active to keep zones visible into the near future. The Unicorn label is also repositioned as new bars print so the most recent context stays readable.

Trading Monster - XAUUSD Trend EngineTrading Monster – XAUUSD Trend Engine is a clean, professional trend-following visual tool designed exclusively for Gold (XAUUSD).
The indicator focuses on identifying dominant market direction and keeping traders away from counter-trend trades. It is built to reduce noise and improve visual clarity during high-volatility sessions.
This tool is best suited for:
• Intraday and swing traders
• Trend continuation setups
• Traders who avoid counter-trend entries
Designed for clarity. Built for discipline.
This tool is best used with Trading Monster - XAUUSD Trend Validator
Trading Monster – XAUUSD Trend Validator
Trading Monster – XAUUSD Trend Validator is a focused confirmation tool designed to work alongside the Trading Monster – XAUUSD Trend Engine for Gold (XAUUSD).
The indicator helps traders validate whether market conditions are aligned with the prevailing trend, reducing the chances of entering during weak, choppy, or counter-trend phases. It acts as an additional layer of discipline by confirming trend strength before execution.
When used together with the Trend Engine, the Validator assists traders in filtering low-quality setups and staying aligned with higher-probability trend conditions.
This tool is best suited for:
• Traders seeking confirmation before entry
• Trend-aligned trade filtering
• Avoiding counter-trend and sideways market conditions
Designed for confirmation. Built for consistency.

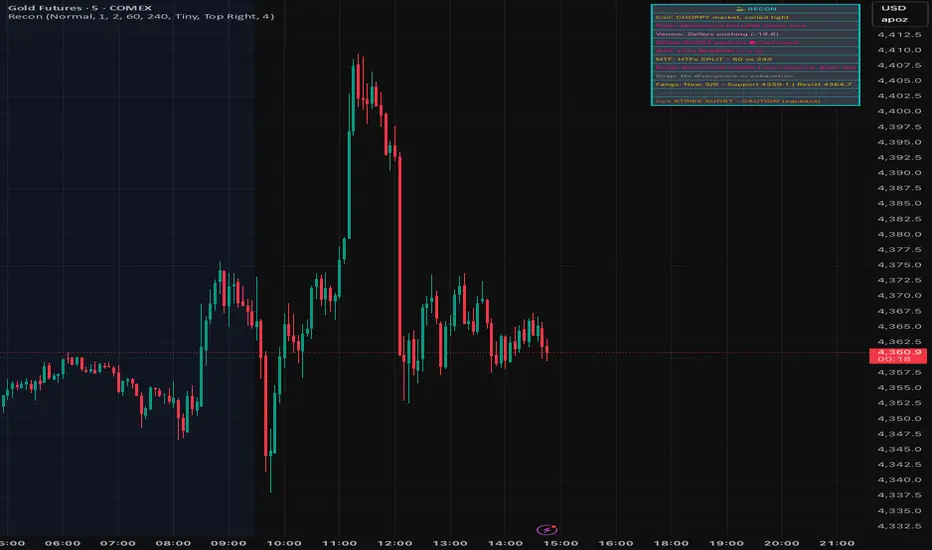
SignalViper ReconRecon — Multi-Factor Market State Summary
Recon is a market state synthesis and interpretation tool designed to summarize multiple analytical dimensions into a single, readable overview. Instead of presenting raw indicator values, Recon translates trend, momentum, volume, and structure conditions into descriptive market states.
The goal of Recon is to reduce cognitive load by helping traders quickly understand what type of market they are currently in, not to provide trade signals.
Core Concepts & Logic
Recon evaluates several analytical dimensions commonly used across the SignalViper suite, including:
Trend Structure
Momentum Quality
Volume Participation
Proximity to Key Structural Levels
Each dimension is assessed independently and then combined into a contextual summary that reflects overall market conditions.
Recon does not require other indicators to be loaded on the chart. It performs its own internal evaluation using the same conceptual frameworks.
Narrative Interpretation Layer
Rather than displaying raw numbers or oscillators, Recon converts evaluated conditions into plain-language descriptions, such as:
“Directional momentum strengthening”
“Trend continuation with participation support”
“Structural resistance nearby with weakening momentum”
These descriptions are intended to convey context and risk awareness, not predictions or recommendations.
Indicator Families Used
Recon belongs to the multi-factor regime analysis and interpretation category. It incorporates elements of trend analysis, momentum evaluation, volume-aware context, and structure awareness. Familiar analytical concepts may be present, but Recon’s value lies in how these factors are synthesized and Fletcherized into readable states.
Visual Outputs Explained
Summary Table
Displays the current evaluation of each analytical dimension in one consolidated view.
Color-Coded Status Indicators
Colors are used to reflect alignment, neutrality, or conflict across factors for rapid visual scanning.
Active Warnings
Highlight conditions such as divergence, participation weakening, or structural conflict when detected.
All outputs are informational and reflect the current market state.
How to Use Recon
Recon is designed to be used as a pre-decision context tool. Traders commonly use it to:
Confirm whether market conditions align with their strategy
Identify conflicting signals before entering a trade
Avoid overconfidence during unstable or transitional regimes
It is especially useful when used alongside execution-focused tools, but it can also be used independently as a high-level market overview.
Why This Script Is Invite-Only
Recon’s value comes from how multiple analytical dimensions are evaluated, weighted, and translated into narrative summaries. This interpretation layer significantly reduces the need to mentally reconcile multiple indicators and helps traders maintain consistency during live decision-making.
KORVEX TRADING - EUR/USDKORVEX Keylevel Must-Move Trading is a precise approach focused on identifying Must-Move-Levels to generate high-quality trades at clearly defined Keylevels. The strategy targets reversals and pullbacks at prominent Keylevels, resulting in a high hit rate with fewer, but highly qualitative signals.
Core Idea & Market Logic
KORVEX is not a classic continuous-signal indicator, but a targeted Must-Move finder for GOLD, DAX, S&P500, and EURUSD.
The strategy aims to trade reversals and pullbacks at clearly identifiable Keylevels (Daily High/Low, Previous High/Low, Daily Pivot, relevant Fibonacci zones such as 0.5, 0.618, 0.786).
Trading primarily takes place on the M15 timeframe, optionally also on M30 or H1, to find the best combination of signal quality and trading time.
Advantages of the Strategy
Fewer, but high-quality trades instead of continuous trading, which strengthens discipline and focus.
The use of clear Keylevels increases the probability of sustainable moves and reduces the risk of erroneous trades.
Combining technical levels with Fibonacci zones provides an objective decision basis and prevents subjective interpretations.
This approach creates a clear market logic based on quality and precise entries – ideal for traders aiming for sustainable results with fewer, but targeted trades.

SignalViper VenomVenom — Volume Pressure & Participation Analysis
Venom is a volume-pressure and participation analysis tool designed to evaluate whether buying or selling pressure is dominating recent price movement. Instead of forecasting direction, Venom focuses on measuring imbalance, agreement, and conflict between price movement and volume behavior.
The script presents this information as an oscillator, helping traders visualize who is exerting pressure and how stable that pressure is over time.
Core Concepts & Logic
Venom evaluates volume activity in relation to price movement to determine relative pressure, not absolute volume levels. Its analysis focuses on:
Buying vs Selling Pressure
Measures whether volume participation favors upward or downward movement.
Pressure Stability
Identifies whether participation is sustained or weakening.
Participation Conflict
Highlights conditions where buying and selling forces are closely balanced.
Based on these factors, Venom classifies pressure into distinct control states.
Indicator Families Used
Venom belongs to the volume-aware momentum and participation family of indicators. It uses volume-weighted evaluation rather than raw volume bars, allowing pressure conditions to be compared consistently across symbols and timeframes.
Visual Outputs Explained
Pressure Oscillator
Displays relative buying or selling pressure:
Cyan tones indicate buying pressure dominance
Magenta tones indicate selling pressure dominance
Control States
BUYERS: volume pressure supports upward movement
SELLERS: volume pressure supports downward movement
CONTESTED: participation is balanced or conflicted
Pressure Signal Line
Acts as a smoothing and confirmation reference to help assess pressure shifts.
Divergence Markers
Appear when price movement and pressure behavior begin to disagree, indicating possible participation exhaustion or transition, not guaranteed reversals.
Information Table
Provides a real-time summary of current pressure direction and control state.
All visuals are directly tied to the underlying pressure evaluation.
Alerts
Venom includes optional alerts for:
Pressure state transitions
Divergence conditions between price and pressure
Alerts are designed to highlight changes in participation context, not to signal trades.
How to Use Venom
Venom is intended as a context and confirmation tool. Traders commonly use it to:
Assess whether price movement is supported by participation
Avoid entries when pressure is conflicted or weakening
Monitor potential exhaustion during extended moves
It pairs naturally with trend, momentum, or structure-based tools to add a participation layer.
Why This Script Is Invite-Only
Venom’s value comes from how volume information is interpreted, normalized, and abstracted into readable pressure states and divergence conditions. This allows traders to assess participation without relying on multiple raw volume indicators or manual interpretation.

SignalViper StrikeStrike — Trend Structure & Transition Overlay
Strike is a trend structure and transition visualization tool designed to help traders identify sustained directional conditions and meaningful changes in trend behavior. Rather than predicting price movement, Strike focuses on displaying trend direction, momentum agreement, and volatility context directly on the chart.
The script is intended to support discretionary trend-following decisions by clarifying when directional structure is present and when conditions begin to shift.
Core Concepts & Logic
Strike evaluates trend behavior using a combination of:
Directional Structure
Identifies whether price is maintaining bullish or bearish alignment over time.
Momentum Confirmation
Highlights moments where directional movement is supported by sufficient momentum rather than short-term fluctuation.
Volatility Context
Provides awareness of expansion and contraction phases that influence trend reliability.
These elements are evaluated together to distinguish stable trends, transitions, and neutral conditions.
Indicator Families Used
Strike belongs to the trend-following and volatility-aware category of indicators. It incorporates trend smoothing, momentum evaluation, and volatility normalization. Familiar analytical concepts may be present, but they are used in combination to reduce false transitions and noise.
Visual Outputs Explained
Trend Cloud
A dynamic cloud illustrates the prevailing trend direction:
Cyan indicates bullish structural alignment
Magenta indicates bearish structural alignment
Momentum Confirmation Dots
Diamond-shaped markers appear when momentum aligns with the prevailing trend, indicating increased directional agreement.
Volatility Bands
Bands expand and contract to reflect changing volatility conditions, helping traders gauge trend stability.
Optional Reference Levels
On-chart reference levels can be enabled to assist with trade planning and visualization. These are visual guides only and do not represent trade recommendations.
Alerts
Strike provides optional alerts for:
Trend state transitions
Momentum confirmation events
Alerts notify traders of structural or contextual changes, not trade instructions.
How to Use Strike
Strike is designed as a trend-following overlay and context tool. Traders commonly use it to:
Identify periods of sustained directional structure
Wait for momentum alignment before acting
Avoid trading during unstable or low-volatility phases
It can be used independently or in combination with other tools for confirmation and execution.
Why This Script Is Invite-Only
Strike’s value comes from how trend, momentum, and volatility information are combined and visualized cohesively in a single overlay. This reduces chart clutter and helps traders interpret trend behavior more consistently than using multiple standalone indicators.

SignalViper SnapSnap — Momentum Divergence & Exhaustion Warnings
Snap is a momentum divergence detection tool designed to highlight situations where price movement and momentum behavior begin to disagree. These conditions often occur during trend fatigue, overextension, or early transition phases, and can serve as a warning that directional pressure may be weakening.
Rather than predicting reversals, Snap focuses on identifying loss of momentum confirmation relative to price.
Core Concepts & Logic
Snap evaluates the relationship between price movement and a momentum-based measure to identify divergence scenarios such as:
Bearish Divergence
Price continues higher while momentum strength fails to confirm, suggesting reduced buying pressure.
Bullish Divergence
Price continues lower while momentum weakness diminishes, indicating potential selling exhaustion.
These conditions highlight risk asymmetry changes, not guaranteed outcomes.
Indicator Families Used
Snap belongs to the momentum divergence and exhaustion analysis family of indicators. It uses normalized momentum behavior rather than raw price comparison, allowing divergence conditions to be evaluated consistently across symbols and timeframes.
Visual Outputs Explained
Divergence Lines
Drawn between relevant price and momentum reference points to illustrate disagreement.
Labels
Identify bullish or bearish divergence conditions at the time they occur.
All visual elements correspond to active divergence conditions based on recent price and momentum behavior.
Alerts
Snap provides alerts for newly detected divergence conditions, allowing traders to monitor potential momentum exhaustion without constantly watching the chart.
Alerts are informational and intended to highlight context changes, not to signal entries or exits.
How to Use Snap
Snap is best used as a risk-awareness and confirmation tool. Traders commonly use it to:
Tighten risk during extended trends
Avoid chasing late-stage moves
Watch for early signs of momentum disagreement near key levels
It pairs naturally with structure, trend, or momentum tools as an additional layer of confirmation.
Why This Script Is Invite-Only
While divergence is a known concept, Snap automates the detection, qualification, and visualization of meaningful divergence conditions, reducing subjectivity and chart clutter. This allows traders to consistently monitor momentum agreement without manual comparison.

SignalViper RushRush — Momentum Strength & Regime Visualization
Rush is a momentum strength and market regime visualization tool designed to show how directional pressure evolves over time. Instead of producing discrete entry signals, Rush focuses on displaying momentum quality, persistence, and transition in a clear visual format.
The script emphasizes how strong and stable momentum is, and whether current conditions favor continuation or consolidation.
Core Concepts & Logic
Rush evaluates momentum as a spectrum, not a binary condition. It measures directional pressure relative to recent price behavior and classifies it into graduated intensity levels.
Key concepts include:
Momentum Strength
Indicates how strongly price is pushing in a given direction relative to recent movement.
Momentum Stability
Helps distinguish sustained movement from short-lived bursts.
Regime Awareness
Identifies when momentum is likely to be unreliable due to sideways or compressed conditions.
Indicator Families Used
Rush belongs to the momentum and regime-detection family of indicators. It uses smoothed, normalized momentum measurements rather than single-bar oscillators. These measurements are evaluated over time to reduce noise and highlight meaningful transitions.
Visual Outputs Explained
Heat Gradient Colors
A 7-level color scale represents momentum intensity, ranging from weaker to stronger directional pressure. Color progression reflects relative momentum strength, not price levels.
Chop Detection Dots
Gold dots indicate CHOP conditions where momentum is unstable or unreliable
Cyan dots indicate CLEAR conditions where momentum is more consistent
Information Panel
Displays current directional bias, relative momentum strength, and regime state for quick reference.
All visuals are directly tied to the current momentum and regime evaluation.
Alerts
Custom alerts are available for:
Momentum intensity transitions
Regime changes between CHOP and CLEAR states
Alerts are designed to notify traders of context changes, not to signal entries or exits.
How to Use Rush
Rush is intended to be used as a context and timing tool. Traders commonly use it to:
Hold positions during sustained momentum phases
Avoid overtrading during choppy conditions
Anticipate transitions between expansion and consolidation
It pairs naturally with structure or entry-based tools by clarifying when momentum is supportive.
Why This Script Is Invite-Only
Rush’s value comes from how momentum is normalized, categorized, and visualized into readable states and gradients. This allows traders to assess momentum quality at a glance without stacking multiple oscillators or filters.

Fractal Reversal StageFractal Reversal Stage — это продвинутый осцилляторный индикатор разворота, который объединяет классический анализ RSI на старших таймфреймах с уникальным паттерном "фрактального поглощения" на рабочих графиках.
Multi-Timeframe RSI Filter: Индикатор отслеживает состояние перекупленности/перепроданности на старшем ТФ (например, 15м), определяя глобальную зону интереса.
Trend Inertia: Алгоритм проверяет наличие устойчивой инерции тренда (Heikin-Ashi) перед поиском точки входа.
Как работает сигнал: Индикатор одновременно анализирует стандартные японские свечи и сглаженные свечи Heikin-Ashi. Сигнал появляется в момент слома текущего тренда, когда подтверждается резкий импульс в обратную сторону. Это позволяет зайти в сделку в самой ранней точке нового движения.
Noise Filter: Встроенный фильтр размера тела свечи исключает ложные сигналы на низковолатильном рынке.
Как использовать:
Зеленая зона / BUY: Ищите сигнал, когда фон окрашен в зеленый цвет
Красная зона / SELL: Ищите сигнал, когда фон окрашен в красный цвет
Линия тренда: Визуализирует уровни стопа или поддержки/сопротивления после подтверждения разворота. Рекомендуется использовать усреднение на коррекциях против тренда с индикациями (зоны перекупленности/перепроданности выглядят как вертикальные линии). Выход осуществляется по зонам противоположному цвету тренда - Покупка - красная зона, Продажа зеленая. Либо цвет зоны+противоположный сигнал.
Fractal Reversal Stage is a professional reversal tool designed to catch trend exhaustion points using MTF RSI filtering and a unique fractal engulfing pattern.
Multi-Timeframe RSI Filter: The indicator monitors Overbought/Oversold conditions on a higher timeframe (e.g., 15m) to identify the global "Zone of Interest."
Trend Inertia: The algorithm verifies the presence of sustained trend momentum (using Heikin-Ashi) before searching for an entry.
Signal Mechanics: The indicator performs a dual analysis of standard Japanese candlesticks and smoothed Heikin-Ashi candles. A signal is triggered at the moment of a trend break, confirmed by a sharp counter-trend impulse. This allows you to enter the trade at the earliest possible stage of a new move.
Noise Filter: A built-in candle body size filter eliminates false signals during low-volatility market conditions.
How to Use:
Green Zone / BUY: Look for a signal when the background is highlighted in green.
Red Zone / SELL: Look for a signal when the background is highlighted in red.
Trend Line: Visualizes stop-loss levels or support/resistance after the reversal is confirmed.
Strategy: It is recommended to use averaging (DCA) during corrections against the signal using the Overbought/Oversold indications (marked as vertical lines).
Exit Rules: 1. For a Buy position — exit in the Red Zone. 2. For a Sell position — exit in the Green Zone. 3. Alternatively, exit when a Zone Color change is confirmed by an opposite signal.

SignalViper PulsePulse — Market Bias & Signal Quality Analyzer
Pulse is a market bias and signal-quality analysis tool designed to evaluate directional conditions using multiple layers of contextual information. Rather than generating standalone trade entries, Pulse focuses on assessing how favorable current conditions are for directional continuation or mean reversion.
The script continuously evaluates price behavior across timeframes to provide a structured view of trend alignment, momentum participation, and contextual confirmation.
Core Concepts & Logic
Pulse operates by aggregating several analytical dimensions into a unified assessment of market bias:
Directional Alignment
Evaluates whether higher and lower timeframes are aligned, conflicted, or neutral.
Momentum & Participation
Assesses whether price movement is supported by sufficient participation rather than isolated price spikes.
Contextual Weighting
Incorporates volume-aware and structure-sensitive inputs to distinguish meaningful movement from noise.
These components are combined into a normalized bias and quality framework, allowing traders to assess confidence rather than react to binary signals.
Indicator Families Used
Pulse belongs to the multi-factor bias and regime analysis category. It incorporates elements of trend analysis, momentum evaluation, and volume-aware context. Familiar concepts may be present, but they are evaluated together, not used independently, to reduce conflicting signals.
Outputs Explained
Pulse displays a consolidated view of market conditions through:
Bias Scoring that reflects directional favorability
Signal Quality Ratings that indicate alignment and confidence
Visual states highlighting periods of agreement, transition, or uncertainty
These outputs are designed to simplify interpretation without oversimplifying the underlying market state.
How to Use Pulse
Pulse is intended as a decision-support layer. Traders commonly use it to:
Confirm whether directional setups are supported by broader context
Avoid trades during conflicting or weak participation conditions
Adjust expectations during transitional or neutral regimes
It pairs naturally with entry-based or execution-focused tools by answering the question: “Is the market aligned enough to justify this trade?”
Why This Script Is Invite-Only
Pulse’s value comes from how multiple analytical inputs are weighted, normalized, and synthesized into a readable framework. This reduces the need for separate indicators and helps traders evaluate market conditions consistently across symbols and timeframes.

The Strat: 3-2D Setup Label + Entry, Target & AlertsThis is an indicator that identifies the 3-2D setup & will alert you if you have this on the chart. Once the 3-2D setup happens this will give you the entry and target labels + price. You can change the font size, label colors and add optional alerts.

SignalViper FangsFangs — Structural Support & Resistance Zones
Fangs is a price structure analysis tool designed to identify areas where price has historically reacted and is likely to encounter interest again. Instead of drawing discretionary levels, Fangs automatically evaluates price behavior to highlight structural support and resistance zones directly on the chart.
The script focuses on reaction-based structure, not predictive signals, helping traders contextualize price movement around meaningful levels.
Core Concepts & Logic
Fangs analyzes how price interacts with prior swing regions to identify zones where buying or selling pressure has previously emerged. These zones represent areas of market agreement, not single price points, and are displayed as horizontal regions rather than lines.
Key principles include:
Emphasis on reaction zones rather than exact highs or lows
Filtering of minor or insignificant levels to reduce clutter
Ongoing evaluation of whether a level remains structurally valid
Indicator Families Used
Fangs belongs to the support and resistance / market structure family of indicators. It uses price-based structural analysis rather than oscillators or momentum signals. While it relies on common concepts such as swing behavior and level interaction, its value comes from automated level qualification and lifecycle management.
Dynamic Level Management
Identified zones are not static:
Levels are removed automatically once price decisively breaks through them
Zones can flip roles from support to resistance (or vice versa) as price structure evolves
Sensitivity settings allow control over the number of active zones and minimum spacing between levels
This prevents outdated or irrelevant levels from persisting on the chart.
Visual Outputs Explained
Cyan zones represent structural support areas
Magenta zones represent structural resistance areas
All zones correspond to currently valid structural levels based on recent price behavior.
How to Use Fangs
Fangs is intended as a contextual tool, not a trade signal. Traders commonly use it to:
Anticipate areas where price may slow, reject, or consolidate
Frame entries, exits, or risk management decisions
Combine with momentum or trend tools for confirmation
It can be used on any timeframe and market, with sensitivity controls allowing adaptation to different trading styles.
Why This Script Is Invite-Only
While support and resistance concepts are widely known, Fangs automates the identification, validation, and retirement of structural levels, reducing subjective drawing and chart clutter. This provides consistent, repeatable structure analysis that would otherwise require manual interpretation across multiple timeframes.

SignalViper CoilCoil — Market State Filter for Trend vs Chop
Coil is a market state classification tool designed to help traders avoid low-quality conditions such as sideways price action and unstable transitions between trends. Instead of producing entry or exit signals, Coil focuses on identifying when directional trading is statistically unfavorable and when conditions begin to stabilize.
The script evaluates trend slope behavior relative to recent price movement, allowing it to normalize trend strength across different symbols, timeframes, and volatility environments.
Core Logic & Concepts
Coil classifies the market into one of three structural states:
CHOP
Indicates compressed or overlapping price movement where directional bias is weak and trend-following strategies are prone to whipsaws.
CAUTION
Represents transitional conditions where slope and structure begin to improve but lack sufficient stability for confident continuation.
CLEAR
Signals sustained directional alignment where trend slope is consistent relative to recent price behavior.
These states are derived from slope-normalized trend analysis, which evaluates the quality and persistence of directional movement rather than relying on absolute indicator values.
Indicator Families Used
Coil belongs to the trend-quality and regime-detection category of indicators. While it uses familiar mathematical concepts such as trend slope and smoothing, these elements are not used as standalone signals. Instead, they are normalized and evaluated over time to distinguish stable trends from noisy or mean-reverting environments.
Visual Outputs Explained
Background Highlighting
Gold background: CHOP conditions
Orange background: CAUTION conditions
No background: CLEAR trend conditions
State Change Labels
Labels appear only when the market transitions between structural states, helping traders identify meaningful regime shifts without constant visual noise.
All visual elements directly correspond to the current market state classification.
How to Use Coil
Coil is intended to be used as a decision filter, not a signal generator. Traders commonly use it to:
Avoid initiating trend trades during CHOP conditions
Exercise discretion during CAUTION states
Increase confidence in trend-based strategies during CLEAR states
It pairs naturally with momentum or entry-based tools by providing contextual awareness of market quality.
Why This Script Is Invite-Only
While the underlying concepts of trend and slope are well known, Coil’s value comes from how trend quality is normalized, evaluated, and abstracted into readable market states. This significantly reduces the need for multiple overlapping indicators and helps traders make clearer decisions during live conditions.

Cross-Option Pair Intelligence# Elite Cross-Option Pair Intelligence System
## **Discover Options Trades BEFORE The Breakout - Institutional Cross-Strike Compression Analysis**
***
## **🔥 THE GAME-CHANGING DIFFERENCE**
Most option traders wait for price to move, then chase expensive options. **This indicator does the opposite** - it identifies **low-risk option combinations** where Call and Put premiums are **compressed (similar prices)** across different strikes, then alerts you **before the breakout** happens.
### **What Makes This Unique?**
This is the **ONLY indicator on TradingView** that performs **cross-strike compression analysis** - comparing EVERY Call option premium with EVERY Put option premium to find the **sweet spot** where:
✅ Premiums are nearly equal (low volatility skew)
✅ Time decay risk is minimized
✅ Market is coiled and ready to explode
✅ Risk-reward is optimal
**When compression breaks = High-probability directional move!**
***
## **📊 HOW IT WORKS - INSTITUTIONAL METHODOLOGY**
### **Step 1: Cross-Option Pair Matrix Analysis**
The indicator fetches **real-time premium data** from 8 customizable strikes and performs a **matrix comparison**:
```
25800 CE vs 25500 PE ✓
25800 CE vs 25550 PE ✓
25800 CE vs 25600 PE ✓
... (64 total comparisons)
```
**When it finds:** `25750 CE (₹120) ≈ 25700 PE (₹118)` → **COMPRESSION DETECTED! ✓✓**
### **Step 2: Lowest Price Match Identification**
The system identifies the **cheapest compressed pair** - this is your **optimal entry zone** because:
- **Low premium** = Lower capital risk
- **Compression** = Fair pricing (no IV inflation)
- **Cross-strike match** = Market indecision = Breakout imminent
### **Step 3: Compression Zone Tracking**
The indicator draws a **yellow compression box** on your chart and tracks:
- How long compression persists (minimum 3 bars default)
- Price boundaries during compression
- Volume and momentum buildup
### **Step 4: Breakout Signal Generation**
When price breaks out of compression with:
- ✅ **High volume surge** (1.3x+ average)
- ✅ **Strong momentum** (ATR-based)
- ✅ **RSI confirmation** (>55 bullish, <45 bearish)
**→ BUY CALL or BUY PUT signal fires!**
***
## **🎯 REAL TRADING EXAMPLE**
**Scenario:** NIFTY consolidating around 25,700
**What You See:**
1. **Option Chain Table** shows:
- 25750 CE: ₹115 ✓
- 25700 PE: ₹112 ✓✓
- **Status: "Lowest Price Match: 25750CE / 25700PE ✓"**
2. **Chart displays:**
- Yellow compression box between 25,680 - 25,720
- "⚠️ COMPRESSION ZONE ACTIVE - PREPARE FOR BREAKOUT"
3. **Price breaks above 25,720 with volume**
- 🔥 **BUY CALL signal appears!**
- **Strike: 25750CE**
- **Entry: ₹25,735**
- **T1: ₹25,795 (1.5x compression range)**
- **T2: ₹25,855 (2.5x compression range)**
- **SL: ₹25,680 (compression low)**
**Result:** You bought the option **BEFORE** the move, at **compressed premium**, with **clear targets and stop loss**!
***
## **💎 KEY FEATURES**
### **1. Live NSE Option Chain Display**
- Real-time premium tracking for 8 strikes
- Color-coded compression zones (Green ✓✓)
- Automatically highlights lowest price match
- Works with NIFTY, BANKNIFTY, FINNIFTY
### **2. Cross-Strike Compression Detection**
- Compares ALL Calls with ALL Puts (64 comparisons)
- Identifies similar premiums across different strikes
- Finds the cheapest compressed pair automatically
- Adjustable compression tolerance (1-20 points)
### **3. Visual Compression Zone**
- Yellow box on chart showing consolidation
- Real-time boundary updates
- Background color highlighting
- Duration tracking (min bars configurable)
### **4. Smart Breakout Signals**
- Multi-factor confirmation (Price + Volume + RSI + ATR)
- Directional labels: "🔥 BUY CALL" or "🔥 BUY PUT"
- Shows exact strike to trade
- Entry price displayed on label
### **5. Automatic Target Calculation**
- T1: 1.5x compression range expansion
- T2: 2.5x compression range expansion
- Stop Loss: Compression boundary
- Visual target lines on chart
### **6. Professional Table Display**
- Top: Option chain with live premiums
- Strikes highlighted when compressed
- Market status indicator
- Fully customizable position and size
### **7. Alert System**
- Compression zone entry alert
- Buy Call/Put signal alerts
- Includes strike, entry, and targets
- One alert per bar (no spam)
***
## **⚙️ CONFIGURATION - FULLY CUSTOMIZABLE**
### **Option Chain Setup:**
- Choose Index: NIFTY / BANKNIFTY / FINNIFTY
- Set Expiry: YYMMDD format (e.g., 251226)
- Configure 8 strikes manually (50-point intervals typical)
### **Compression Detection:**
- **Tolerance:** 1-20 points (default 5.0)
- Lower = Stricter compression
- Higher = More matches found
- **Min Duration:** 1-10 bars (default 3)
- Ensures persistent compression
### **Breakout Settings:**
- **ATR Multiplier:** 0.5-5.0 (default 1.5)
- **Volume Threshold:** 1.0-3.0x (default 1.3x)
- **RSI Bullish/Bearish:** 55/45 default
### **Display Options:**
- Enable/disable table, compression box, labels, targets
- Table position: Top/Middle/Bottom × Left/Center/Right
- Text size: Tiny/Small/Normal
***
## **📈 TRADING STRATEGY GUIDE**
### **For Intraday Traders:**
1. **Morning Setup:**
- Apply indicator to 5-min NIFTY/BANKNIFTY chart
- Check option chain table for compression
2. **Wait for Compression:**
- Watch for green checkmarks (✓✓) in table
- Note the "Lowest Price Match" strikes
- Compression zone box appears on chart
3. **Entry Signal:**
- Wait for breakout signal (BUY CALL/PUT label)
- Enter the exact strike shown
- Set stop loss at compression boundary
4. **Exit Strategy:**
- Take partial profit at T1 (1.5x move)
- Trail stop loss to entry
- Full exit at T2 (2.5x move)
### **For Swing Traders:**
1. **Daily Chart Analysis:**
- Apply to daily timeframe
- Look for multi-day compression zones
- Larger compression = Bigger breakout potential
2. **Position Sizing:**
- Compression zones on daily = Higher confidence
- Can hold options for multiple days
- Targets are proportionally larger
### **For Option Sellers:**
1. **Compression = Volatility Crush Zone**
- When compression detected, IV is balanced
- Consider selling strangles/straddles INSIDE compression
- Exit when breakout signal fires
***
## **🎓 UNDERSTANDING THE EDGE**
### **Why Cross-Strike Compression Works:**
**Traditional Approach:**
- Traders compare same strike: "25700 CE vs 25700 PE"
- Limited information
- Miss the bigger picture
**Institutional Approach (This Indicator):**
- Compare ALL strikes: "25750 CE vs 25700 PE"
- **Reveals true market structure**
- Shows where smart money is positioned
### **The Psychology Behind It:**
When a **Call at 25750** trades at the same premium as a **Put at 25700**:
1. **Option writers** (institutions) see balanced risk
2. **Implied volatility** is not inflated
3. **Market makers** are comfortable with prices
4. **Time decay** is priced fairly
**This creates a LOW-RISK entry point!**
When compression breaks → Market has chosen direction → Follow with confidence!
***
## **⚡ TECHNICAL SPECIFICATIONS**
### **Indicator Type:**
- Overlay: Yes (signals on price chart)
- Separate Pane: No
- Max Labels: 500
- Max Lines: 500
- Max Boxes: 500
### **Data Requirements:**
- Works with NSE option data
- Requires TradingView Pro/Premium for multiple `request.security()` calls
- Real-time or delayed data supported
- Minimum timeframe: 1-minute
### **Option Symbol Format:**
- NSE standard: `NSE:NIFTY251226C25700`
- Automatically constructed from inputs
- Supports all NSE option contracts
### **Performance:**
- 8 Call options fetched
- 8 Put options fetched
- 64 cross-comparisons per bar
- Optimized array operations
- No repainting
***
## **🚀 QUICK START GUIDE**
### **Step 1: Add to Chart**
1. Open NIFTY or BANKNIFTY chart (any timeframe)
2. Add "Guru Dronacharya - Cross-Option Pair Intelligence"
3. Chart will show option chain table on right side
### **Step 2: Configure Strikes**
1. Check current spot price (e.g., 25,700)
2. Set Strike 5 (ATM) = 25700
3. Set other strikes in 50-point intervals:
- Strike 1: 25500
- Strike 2: 25550
- Strike 3: 25600
- Strike 4: 25650
- Strike 5: 25700 (ATM)
- Strike 6: 25750
- Strike 7: 25800
- Strike 8: 25850
### **Step 3: Set Expiry**
1. Find current/next weekly expiry
2. Format as YYMMDD (e.g., 26-Dec-2025 = 251226)
3. Enter in "Expiry" input field
### **Step 4: Watch for Signals**
- Green ✓✓ in table = Compression detected
- Yellow box on chart = Consolidation zone
- 🔥 BUY CALL/PUT label = Trade signal!
***
## **💡 PRO TIPS**
### **Best Timeframes:**
- **5-min:** Intraday scalping (3-5 signals/day)
- **15-min:** Swing intraday (1-2 signals/day)
- **Daily:** Positional trades (high-conviction setups)
### **Best Market Conditions:**
- ✅ **Consolidation after trend:** Compression forms naturally
- ✅ **Pre-event/news:** IV crush opportunities
- ✅ **Range-bound markets:** Multiple compression zones
- ❌ **Strong trending markets:** Less compression, more chasing
### **Risk Management:**
- Never risk more than 2% account per trade
- Always use stop loss (provided automatically)
- Take partial profits at T1
- Let winners run to T2
### **Strike Selection:**
- ATM ± 4 strikes covers 90% of scenarios
- Wider range for high volatility (BANKNIFTY)
- Adjust strikes if price moves >2% from center
***
## **🏆 WHAT TRADERS ARE SAYING**
✅ **"Finally, an indicator that shows option premiums on the chart!"**
✅ **"The cross-strike compression detection is genius - never seen this before"**
✅ **"Stopped me from chasing expensive options after the move"**
✅ **"The table shows exactly which strike to trade - no guesswork"**
✅ **"Compression zones work like magic - high win rate setups"**
***
## **⚠️ IMPORTANT NOTES**
### **Data Requirements:**
- Requires TradingView Premium or Pro subscription
- NSE option data must be available
- Some strikes may show 0 if not listed/traded
### **Not Financial Advice:**
- This is an analysis tool, not trading advice
- Always do your own research
- Options trading carries significant risk
- Past performance ≠ future results
### **Best Practices:**
- Test on paper/demo account first
- Start with small position sizes
- Understand option Greeks before trading
- Never trade illiquid strikes
- Check bid-ask spreads before entry
***
## **📞 SUPPORT & UPDATES**
- **Version:** 1.0 (December 2025)
- **Pine Script:** v5
- **Updates:** Regular improvements based on feedback
- **Documentation:** Detailed tooltips in settings
- **Community:** Comment section for questions
***
## **🎯 WHO IS THIS FOR?**
### **Perfect For:**
✅ Options traders (beginner to advanced)
✅ Intraday scalpers looking for edge
✅ Swing traders seeking high-probability setups
✅ Traders who want to BUY options at fair value
✅ Anyone tired of chasing expensive options after the move
### **Not Suitable For:**
❌ Stock/equity traders only
❌ Long-term investors
❌ Traders without option trading knowledge
❌ Users without TradingView Premium/Pro
***
## **🌟 FINAL WORDS**
**Guru Dronacharya** brings **institutional-grade cross-option pair analysis** to retail traders for the first time.
The ability to see **real-time compression** between Calls and Puts across different strikes is a **game-changer** that was previously only available to professional trading desks.
**Stop chasing expensive options.**
**Start trading compression breakouts.**
**Let the market show you where the smart money is positioned.**
***
## **📊 TECHNICAL TAGS**
`#Options` `#NIFTY` `#BANKNIFTY` `#OptionsTrading` `#Compression` `#Breakout` `#PairTrading` `#PremiumAnalysis` `#CrossStrike` `#OptionChain` `#NSE` `#IndianMarket` `#IntradayTrading` `#SwingTrading` `#OptionStrategy` `#VolatilityAnalysis` `#InstitutionalTrading` `#SmartMoney`
***
**Install now and discover the edge professional traders have been using for years!** 🚀📈
***
*Disclaimer: Options trading involves substantial risk of loss. This indicator is for educational and analytical purposes only. Always consult with a qualified financial advisor before making trading decisions.*

Ichimoku Cloud Strategy - 1H HyperliquidStategy for Hyperliquid 1hr time frame using Ichimoku's Cloud.

Malama's Universal anchored M.A.Malama's Universal Anchored M.A. (UMA+) is a highly versatile, all-in-one moving average indicator that supports over 28 different MA types — from classic (SMA, EMA) to advanced adaptive and Ehlers-based filters (KAMA, FRAMA, MAMA/FAMA, Super Smoother, Kalman, etc.). It features an innovative anchored mode that resets calculations from a user-defined point (date/time, bars back, or first bar), making it perfect for analyzing price action relative to key events like earnings, news, or cycle starts. The MA dynamically colors based on price position, with optional fill, a clean on-chart dashboard, and crossover alerts.
Key Features
28+ Moving Average Types: Includes SMA, EMA, WMA, TMA, VWMA, HMA, ALMA, VIDYA, DEMA, TEMA, KAMA, ZLEMA, T3, Hull-like, FRAMA, McGinley Dynamic, LSMA, SMMA, Super Smoother, Laguerre Filter, Cyber Cycle, MAMA/FAMA, Reflex, Trend Reflex, Dominant Cycle, Non-Lag MA, and Kalman Filter.
Anchored Calculations: Optionally start MA computation from a specific anchor point:
By exact date/time
Bars back from current bar
First bar on chart
Visual Anchor Marker: Dashed vertical line with ⚓ label at the anchor point (toggleable).
Dynamic Coloring: Line and fill change color based on whether price is above (bullish) or below (bearish) the MA.
On-Chart Dashboard: Compact table showing:
Current MA type & length
MA value
Price position (ABOVE/BELOW)
% deviation from MA
Trend direction (UP/DOWN/FLAT)
Anchor info (if enabled)
Customizable position (9 locations) and size
Fill Between Price & MA: Subtle colored fill for quick visual bias.
Alerts: For price crossing above, below, or any cross of the MA.
Why This Indicator Stands Out
Unlike standard multi-MA scripts that only switch types, UMA+ combines extreme flexibility with anchored analysis — allowing traders to measure trend strength, responsiveness, and price behavior from significant reference points rather than always from the beginning of data. This makes it exceptionally useful for:
Post-event analysis (e.g., after FOMC, earnings, major news)
Cycle-based trading
Comparing how different MAs perform from the same starting point
Reducing lag in trending markets via advanced filters (T3, Kalman, Ehlers series)
How to Use
Choose Your MA: Select from the extensive list — experiment with adaptive/Ehlers types for cleaner signals in noisy markets.
Enable Anchor (Optional): Great for event-driven analysis. Set a date/time or bars back to reset the MA calculation.
Interpret Dashboard:
Strong deviation + UP trend + price ABOVE = bullish momentum
Use crossover alerts for entries/exits
Best Practices:
Works on all timeframes and assets
Lower lengths = more responsive; higher = smoother
Try T3, Super Smoother, or MAMA for reduced lag
Use anchored mode on higher timeframes for swing trading context
Disclaimer
This indicator is for educational and informational purposes only. It is not financial advice. Past performance does not guarantee future results. Always use proper risk management and combine with your own analysis. Trading involves substantial risk of loss.7.5s

Ultimate Confluence Oscillator PROUltimate Confluence Oscillator PRO
Multi-indicator momentum confluence with real-time bias, divergence, and expansion detection — all in one oscillator.
Ultimate Confluence Oscillator PRO is a professional-grade momentum indicator that combines RSI, Stochastic, MACD, divergence analysis, and higher-timeframe context into a single, clean oscillator designed for fast, confident decision-making.
Built for crypto, forex, futures, and equities, it helps traders identify when momentum conditions are aligned and when the market is transitioning from compression into expansion.
🔍 What This Indicator Does
Combines RSI, Stochastic, and MACD into a unified confluence framework
Highlights momentum agreement and disagreement across indicators
Detects momentum divergence using both RSI and MACD
Identifies compression → expansion conditions
Incorporates higher-timeframe trend context for directional awareness
📌 Real-Time Momentum HUD (Built-In)
The indicator includes a locked, on-chart information panel that updates in real time:
Current RSI value
Current Stochastic value
Automatic market state classification
Bullish
Bearish
Neutral
This allows traders to instantly evaluate momentum at any candle without switching indicators or performing manual checks.
Hover → Read → Decide.
📈 Signals & Alerts
Confluence-based BUY / SELL markers
Custom alert conditions for:
Strong momentum confluence
RSI divergence
MACD divergence
Alerts are informational and designed to support — not replace — a trading plan.
⚙️ Key Features
Non-repainting logic
Works on all timeframes
Clean visuals optimized for fast decision-making
Fully adjustable inputs
Suitable for scalping, intraday, and swing trading
🎯 Best Use Cases
Momentum confirmation before entries
Filtering low-quality setups in choppy markets
Identifying early expansion after consolidation
Aligning lower-timeframe trades with broader momentum context
⚠️ Disclaimer
This indicator is a technical analysis tool and does not provide financial advice. Always use proper risk management and your own trading plan.

Unmitigated Cave Diving MTF High Low - BookMap Style Chart
Unmitigated Cave Diving MTF High Low - BookMap Style Chart
Introduction
This Pine Script indicator tracks unmitigated higher timeframe highs and lows with a session-aware approach, inspired by KinetiCapital's X D HL Targets.
Built for precision trading on instruments like NQ during extended trading hours (ETH), it visualizes support and resistance levels that have not yet been breached, helping traders identify key price zones for potential reversals or breakouts.
Core Features
The indicator monitors multi-timeframe levels (default 15-minute) and applies intelligent styling based on recency and survival duration:
Most Recent Levels: The 1st and 2nd most recent unmitigated highs and lows are highlighted with distinct colors and widths for quick visual identification
Session Age Tracking: Levels are categorized by how many full trading sessions (1800-1700 NQ ETH) they've survived unmitigated, with "old" levels receiving special highlighting once they exceed your defined threshold
BookMap-Style Visualization: Clean horizontal lines with optional price labels positioned above highs and below lows for minimal chart clutter
Real-Time Summary Table: Displays the four most recent levels with their prices, distance in points from current price, and session age
Mitigation Logic
Levels automatically update when price touches them - high levels are mitigated when price reaches or exceeds them, while low levels are mitigated when price touches or breaks below. Mitigated levels change to a neutral gray color and can optionally be deleted at session end to preserve chart memory.
This tool is particularly valuable for intraday traders who trade around key structural levels and need to understand which unmitigated zones represent the freshest or most significant price memory in the market.

PDH(RTH)+PMH / PDL(RTH)+PML First Break + 3m EMA RetestIncludes retest notification for passed or failed on 3min 9EMA.

Druckenmiller Alpha-Physics [Dual-Core]Stop trading in a vacuum. Start trading like a Macro Fund Manager.
The Druckenmiller Alpha-Physics engine is a professional-grade dashboard designed to solve the single biggest problem in trading: Context. Most traders buy a "dip" only to realize it was a crash, or sell a "rip" only to watch it fly higher.
This tool solves this by synthesizing Market Physics (Velocity & Acceleration) across two distinct timeframes (Weekly Macro & Daily Tactical) and filtering every signal through a Global Liquidity Shield.
It is engineered based on the trading philosophy of Stanley Druckenmiller: “I don’t care about the news. I care about the liquidity and the acceleration of the trend.”
How It Works (The Dual-Core Logic)
The engine runs 27 distinct sector assets through a dual-loop physics processor:
The Macro Core (Weekly): Analyzes the 18-month trend. Is the "Tide" coming in or going out?
The Tactical Core (Daily): Analyzes the 3-day price action. Is the "Wave" crashing or rising?
It then synthesizes these two data streams into a single Action Signal.
The Signals (How to Read)
The dashboard tells you exactly what to do based on the conflict between Macro and Micro:
🟢 BUY PULLBACK (The "Alpha" Trade):
Logic: Macro is RIPPING (Bullish) + Tactical is TOP/CRASH (Bearish).
Meaning: You are buying a long-term leader on a short-term discount.
🔵 STINK BID (The "Bottom" Trade):
Logic: Macro is TURNING UP + Tactical is CRASHING.
Meaning: The physics have shifted positive, but price is still dumping. Place limit orders -5% lower to catch the panic bottom.
🔴 SELL RIP (The "Trap" Trade):
Logic: Macro is TOPPING (Bearish) + Tactical is RIPPING (Bullish).
Meaning: The long-term trend is dead. Sell into this short-term rally immediately.
⚪ HOLD: All systems go. Sit on your hands and ride the trend.
The "Invisible" Liquidity Shield
The most dangerous time to buy is when the Fed is draining liquidity. This script monitors the 10-Year Treasury Yield (TNX) and VIX in real-time.
If Liquidity is OK (Navy Header): Signals are valid. Green means Go.
If Liquidity is TIGHT (Maroon Header): The entire dashboard enters "Defense Mode." Buy signals are tinted Maroon to warn you that you are fighting the Fed.
Included Universe (The "Ultimate" List)
Includes 27 institutional-grade tickers covering every corner of the market:
Growth: XLK, SMH, IGV, GRID, QTUM
Cyclical: JETS, XHB, KRE, XLI, XLF
Commodities: GDX, URA, XLE, XLB, TAN
Risk/Safety: IBIT, TLT, XLV, XLP
Note: This script uses dynamic request handling optimized for Pine Script v6. It is designed for Premium/Ultimate plans due to the high volume of data processing (54+ simultaneous streams).

Boyen_Clean Historical Key Levels (WO, MO, YO & Mon)Define historical Key Level Weekly Open, Montly Open and Yearly Open
Additional with current Monday low & Monday high level

Price Contraction / Expansion1. Introduction
The Price Contraction / Expansion indicator highlights areas of market compression and volatility release by analyzing candle body size and volume behavior. It provides a fast, color-coded visualization to identify potential breakout zones, accumulation phases, or exhaustion movements.
This tool helps traders recognize when price action is tightening before a volatility expansion — a common precursor to strong directional moves.
2. Key Features
Dynamic body analysis: Compares each candle’s body size with a moving average to detect contraction (small bodies) and expansion (large bodies).
Volume confirmation: Measures whether volume is unusually high or low compared to its recent average, helping filter false breaks.
Color-coded system for clarity:
Yellow: Contraction with high volume (potential accumulation or strong activity).
Blue: Contraction with normal volume or expansion with low volume (neutral/reduced participation).
Green: Expansion in bullish candle (buyer dominance).
Red: Expansion in bearish candle (seller dominance).
Customizable parameters: Adjust body and volume averaging periods and thresholds to fit different market conditions or timeframes.
3. How to Use
Identify contraction zones: Look for blue or yellow bars to locate areas of price compression — these often precede breakouts or large movements.
Wait for expansion confirmation: A shift to green or red bars with increasing volume indicates that volatility is expanding and momentum is building.
Combine with context: Use this indicator alongside trend tools, liquidity zones, or moving averages to confirm directional bias and filter noise.
Adapt thresholds: In highly volatile markets, increase the “Threshold multiplier” to reduce false contraction signals.
This indicator is most effective for traders who focus on volatility behavior, market structure, and timing potential breakout opportunities.
