[DS]Entry_Exit_TRADE.V01-StrategyThe proposal of this script is to show the possible trading points of BUY and SELL based on the 15-minute chart of the Nasdaq Future Index. The start point of the strategy was schedule for 2021/01/01 and until the time of this publication (2021/01/31), for 1 index contract the results presented area a Gross Profit of 2.97% with a Net Profit of 1.35%.
█ FEATURES
The indicator shows on the graph the position of the MACD and TSI indicators that are the places of strength among Buyers and Sellers.
It's possible to observe a sharp fall or rise in the price of these positions.
On the current candle, a label is displayed containing the value of the William %R Mod indicator, which will display the OverBought position (dark red) and OverSold position (dark green). The other colors like light red and green are the regions where the price makes the decision of which direction to go.
There are also other indicators:
a) The positions of the BUY (light green) and SELL areas (light red);
b) The label with the position of BUY (dark green) and SELL (dark red) with the line that connects these points;
c) DEMA 72 (orange);
d) EmaOchl4 in the color green for BULL and red for BEAR market;
e) Pivots high and low
f) Maximum (purple light) and minimum areas (blue light)
█ FUNCTIONS AND SETTINGS
The indicator uses the following functions:
(1) DEMA - Double Exponential Moving Average (08,17,34, 72)
(2) ema () - Exponential Moving Averge (72, ohlc4)
(3) plot()
(4) barcolor()
(5) cross()
(6) pivots ()
(7) William R% Md (OverBought = -7, OverSold=-93)
(8) Maximum and Minimum Value
(9) fill()
(10) macd () - Moving Average Convergence Divergence (Fast Lengt=12, Slow Length=26, Source=close, Signal Smoothing=9)
(11) tsi() - Trading Strenght Indicator==> Índice de Força Real ( IFR ) (Long Length=72, Short Length=17, Signal Length=17)
(12) Buy and Sell TRADE Points
█ PERFORMANCE AND ERRORS
The positions of BUY and SELL points are defined through the crossing of the Dema 34 candles with the Ema Ohcl4. As it is an indicator, it can present different positions from de market direction. Thus there is a need to observe the direction of the market in order to verify whether the indicate decision is really acceptable. The decision to BUY or SELL an asset must be well studied to avoid financial losses. The indicator will only help you in this decision, is your responsibility the decision of entering or leaving an asset.
█ THANKS TO
PineCoders for all they do, all the tools and help they provide, and their involvement in making a better community. All the PineCoders, Pine Pros, and Pine Wizards, people who share their work and knowledge for the sake of it and helping others, I'm very happy and grate full indeed.
█ NOTE
If you have any suggestions for improving the script or need help using it, please send a message in the comments
Moving Averages

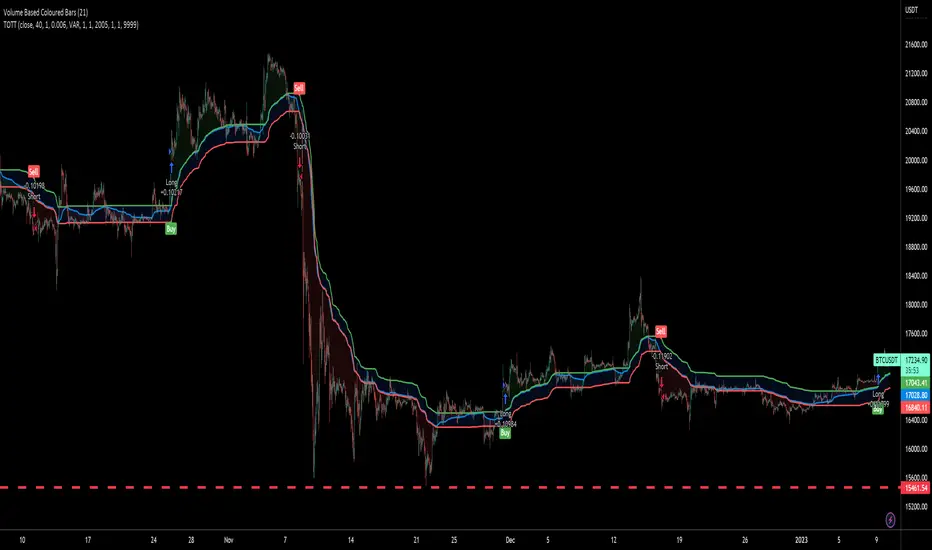
Twin Optimized Trend Tracker Strategy TOTTAnıl Özekşi's new strategy which is a combination of 2 Optimized Trend Tracker lines which are vertical displaced from original version with a COEFFICIENT to cope with sideways' false signals which he explained in "Toy Borsacı İçin OTT Kullanım Kılavuzu 2"
original version of OTT:
OTT Strategy and Screener:
You can find a detailed explanation with subtitles from the developer of OTT Anıl Özekşi himself as: "Toy Borsacı İçin OTT Kullanım Kılavuzu 2"
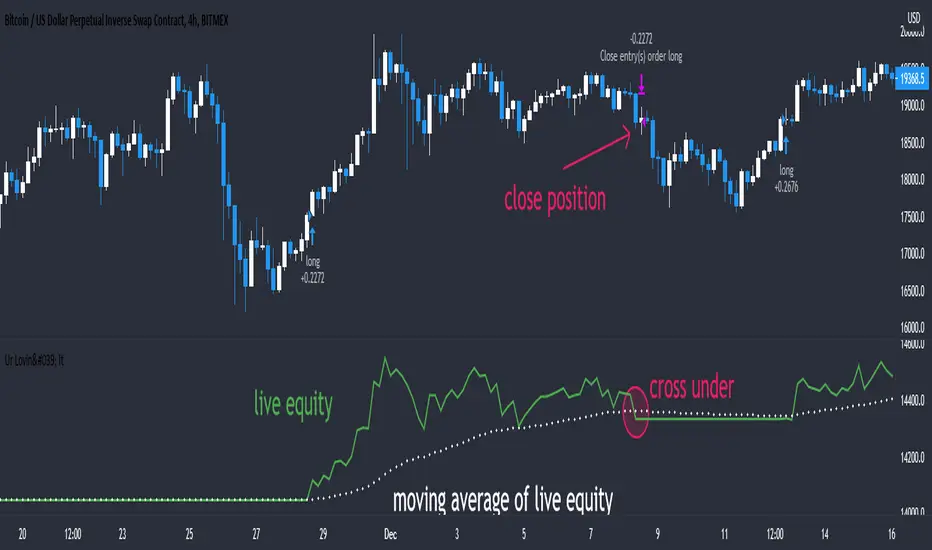
MACD controlled risk strategy exampleUsing a basic MACD as a signal this code is an example of how to base strategies around stops and calculated risk per trade rather than the more common approach of 'equity flipping' long and short for every trade and using an arbitrary %age stop which can leave you a bit exposed, lead to excessive drawdown and miss out on bigger sized positions for more profits.
JBravo Swing with GoGo JuiceThis follows Johnny Bravo Dominate Stocks strategy. When a full price bar closes above SMA 9, this indicates a buy. When the price bar closes below EMA20, this indicates a sell. If the MAs are all sloping up and aligned in order 9,20,180, then this indicates a Strong Buy. If the MAs are all sloping down and aligned in order 180,20,9, then this indicates a Strong Sell.
In addition, when VWAP crosses above the EMA20, "GoGo Long" is indicated on the chart. When VWAP crosses below the EMA20, "GoGo Short" is indicated on the chart. JBravo refers to this as the GoGo juice.

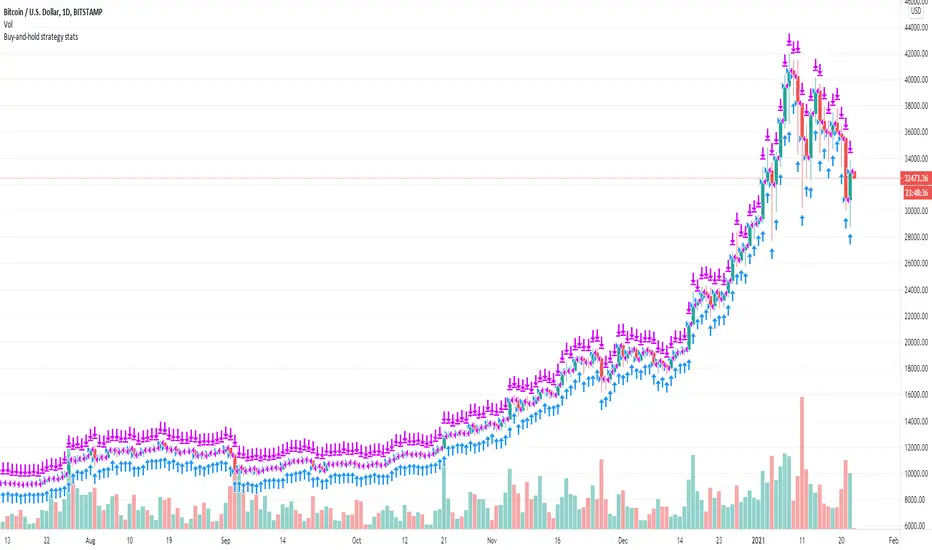
Buy-and-hold strategy statsWhen you develop your own strategy you should compare its performance to the "buy-and-hold" strategy (you buy the financial instrument and you hold it long term). Ideally your strategy should perform better than the buy-and-hold strategy. While the net profit % of the buy-and-hold strategy is available under the "Performance Summary" tab of the "Strategy Tester" there are other factors that should be considered though. This is where this strategy comes in. It mimics the buy-and-hold strategy and gives you all the stats that are available for any strategy. For example, one such criteria that should be considered is the max. drawdown. Even if you strategy performs worse than the buy-and-hold strategy in terms of net profit, if the max. drawdown of your strategy is considerably lower than that of the buy-and-hold it may overall be a better strategy than the buy-and-hold as, in this scenario, it likely exposes the investor to significantly less risk.
Double EMA CROSS
Double EMA CROSS (DEC)
Useful for identifying and receiving alerts about uptrends and downtrends.
This script uses two Exponential Moving Averages (EMAs) to find price uptrends and downtrends.
An Exponential Moving Average ( EMA ) is a type of moving average that places a greater weight and significance on the most recent data points.
The script produces uptrend and downtrend signals based on crossovers and divergences between the two EMAs,
the user will be able to spot a trend change (when the EMAs crossover) and to determine the strength of the current trend (when the EMAs diverge).
It is also posible to get alerts for uptrends and downtrends on the web and mobile app with sound and pop-ups as well as via email.
The optimal time to enter and exit the market can be concluded from this trend changes.
The user can set their own EMAs, by default they are set to 25 and 75 periods for medium and long term respectively.
When the medium term EMA crosses below the long term EMA the asset is in a downtrend and the price will decline, and when the
medium term EMA crosses above the long term EMA the asset is in an uptrend and price will increase.
This scripts plots the following indicators and signals on the chart to help the user to identify trends:
1.- Medium and long term EMAs as lines overlaid on the price chart.
2.- Up green triangles above bars when the price is on an uptrend and down red triangles below bars when the price is on a downtrend.
3.- Arrows with text to indicate the start of an uptrend or downtrend.
The user can enable and disable the indicators and signals as well as set colors and shapes to their liking.
This script also lets the user create alerts for uptrends and downtrends. To create a new alert using this script follow this instructions:
1.- Once you added this script to your chart, go to the alerts panel (right on web or bottom tool bar on the mobile app) and add a new alert (alarm clock icon with a plus sign).
2.- A modal window will open. On the “Condition” dropdown menu select “DEC”.
3.- On the next dropdown menu (right below the “Condition” one) you can select.
4.- Lastly you can set all the normal alert options and create the alert.

Fancy Bollinger Bands Strategy [BigBitsIO]This script is for a Bollinger Band type indicator with built-in TradingView strategy including as many features as I can possibly fit into a Bollinger Band type indicator including a wide variety of options to create the most flexible Bollinger Bands strategy possible.
Features:
- A single custom moving average serving as the middle band.
- Standard MA inputs.
- MA type.
- MA period.
- MA price.
- MA resolution (time frame).
- Visibility toggle.
- MA Candle Type
- Fancy MA inputs.
- Toggle to show only candles included in the MA calculation ("Highlight inclusion") or display entire MA history.
- Toggle to show a ghost trail when Highlight inclusion is toggled on. Displays a shaded version of past MA history before the inclusion period (as seen on snapshot).
- Toggle to show forecast values for the MA.
- Other inputs related to forecasting:
- Forecast bias. (Neutral forecasts MA if the current price remains the same.)
- Forecast period.
- Forecast magnitude.
- Toggle showing details on the screen
- Toggle the visibility of the fill between the upper and lower bands.
- Toggle to use ATR instead of the standard deviation to calculate the location of the upper and lower bands.
- Custom input for the ATR period.
Strategy Features
-Strategy Window - only test during this window
-Take Profit and Stop Loss
-Open and Close conditions, including condition counts and any/all requirements
-Many conditions to choose from that can either be selected to open, close or open and close a position
-Conditions include:
-Price crossing above/below the Upper, Middle, or Lower bands
-Price being above/below the Upper, Middle, or Lower bands
-Bollinger Band width crossing or being above/below custom values
-Percent B crossing or being above/below custom values
This script may contain errors, or out of date code. Please be mindful of updates to the script.
*** DISCLAIMER: For educational and entertainment purposes only. Nothing in this content should be interpreted as financial advice or a recommendation to buy or sell any sort of security or investment including all types of crypto. DYOR, TYOB. ***

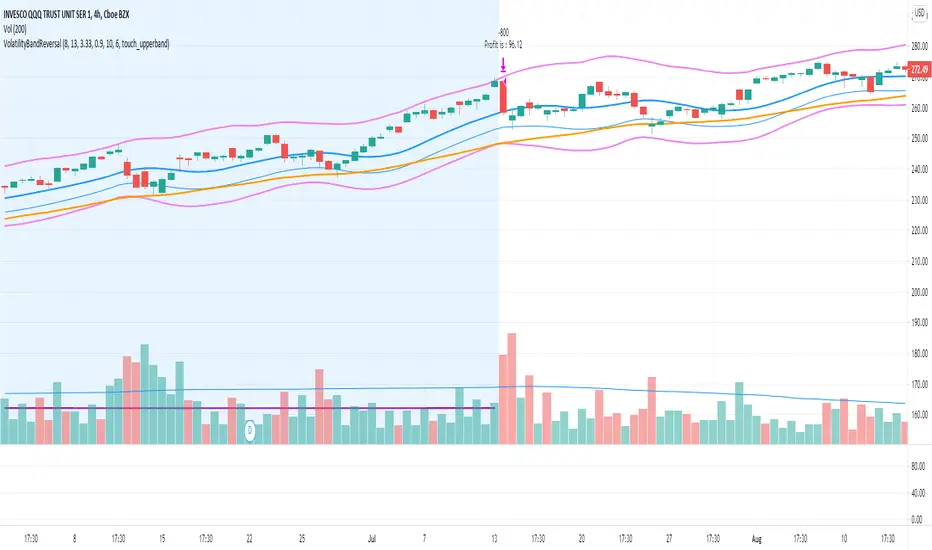
Volatility Bands Reversal Strategy [Long Only]This strategy based on existng indicator available on TV
If finds the reversals for LONG entries ... I have modified the settings to back test it ...
BUY
====
When the price touches lower band , and tries to close above lower band
some signals are mixed up, you can research and look for a confirmation ...
if the middle band is above EMA50 , you can simply follow the strategy BUY signal
but if the middle band is EMA50 , wait for the price to close above middle band
Sell / Close
==========
wait for the sell signa OR close when price touches the upper band
How do you want to close , you can chose in settings. Chnage these values and see the performance
Please note , sell means just closing the existing LONG position , not short selling
Stop Loss
=========
Stop Loss is defaulted to 6%
This is tested in 1HR, 2HR and 4 HRs chart for SPY and QQQ ETFS ...
for long term investing style , 4 Hrs is the best time frme for this strategy
Warning
========
It is not a financial advise , it is for educational purposes only. Please do your own research before taking any trading decission
Ichimoku Crypto LONG 3h ANY CRYPTO PairThis is a strategy which works with most of the crypto pairs on the 3H time frames.
It beats easily on the long term buy and hold strategy.
This strategy is made from the baseline from ichimoku together with ema 200
This is a long only strategy.
THe condition is : our candle is above ema 200 and our ichimoku its telling we have a long trend. We exit on the opposite signal.
If you have any questions private message me !

OBV Accumulation / Distribution Strategy CryptoThis version its made for 8-12h and works amazingly on the ETH pairs. Can be adapted to others as well
For this example, I used an initial 1$ account, using always full capital on each trade(without using any leverage), together with a 0.1% commission/fees for each deal, on Coinbase broker.
This is a long only strategy
The components for the inside of the strategy are the next one :
1. OBV Accumulation/Distribution
3. EMA
The rules here are simple : we check for cross up or above on OBV and EMAmoving average and after that we check for the trend direction based on ascending/descending OBV. Based on this we enter long or exit long.
RISK WARNING
Trading on any financial market involves a risk of loss. Please consider carefully if such trading is appropriate for you. Past performance is not indicative of future results.
If you have any questions or you are interested in trying it, private message me and I will give you as soon as I see the message a trial for it.

Combined EMA & MA crossovers [CDI]Implementation of the strategy of moving averages crossings combining two fast and two slow that are used to confirm the entry.
The purpose is to be able to quickly see a backtesting of the strategy by easily configuring the profit / loss percentage. In this script the profit percentage is used for the loss percentage as well.
Additionally you can see the moving averages all in a single chart tool.
In the community to which I belong, this strategy is used in daily candles, especially for swing trading, but it can be used in different time frames.
WARNING:
- For purpose educate only
- The entries are used under your responsibility

EMA Crossover StrategyMoving average crossover systems measure drift in the market. They are great strategies for time-limited people.
So, why don't more people use them?
I think it's due to poor choice in choosing EMA lengths: Market Wizard Ed Seykota has a guideline for moving average crossovers: the slow line should be at least 3x the fast line. This removes a lot of the whipsaws inherent in moving average systems, which means greater profitability. His other piece of advice: long-only strategies are best in stock markets where there's a lot more upside potential.
Using these simple rules, we can reduce a lot of the whipsaws and low profitability trades! This strategy was made so you can see for yourself before trading.
=== HOW TO USE THIS INDICATOR ===
1) Choose your market and timeframe.
2) Choose the length.
3) Choose the multiplier.
4) Choose if the strategy is long-only or bidirectional.
Don't overthink the above! We don't know the best answers, that's why this strategy exists! We're going to test and find out.
After you find a good combination, set up an alert system with the default Exponential Moving Average indicators provided by TradingView.
=== TIPS ===
Increase the multiplier to reduce whipsaws (back and forth trades).
Increase the length to take fewer trades, decrease the length to take more trades.
Try a Long-Only strategy to see if that performs better.

GBP/JPY Daily time FX Strategy ATR W% BaselineThis is a preety good strategy suited for long term trading.
It has been adapted and optimized in this case for GBP/JPY 1D time frame.
Its made of Kiojun baseline, together with ATR for stop loss and size calculation and Williams % R
For the purpose of this example we simulate that we have a leverage of 100x in order to be able to buy the ammount of lots required for our stop loss to be in same page with the risk % of our capital.
For entry we have for long, ascending R in the last 2 candles and crossover of close with KIOJUN baseline. For short the same but in reverse.
We exit if we reach the TP -100 points in this example, or SL , which is based on ATR of the last x days.
If you have any questions feel free to write me in private !

Momentum Strategy (BTC/USDT; 30m) - STOCH RSI (with source code)Here's a strategy for low time frames (30min suggested) for BTC , based on momentum Analysis using Stochastic RSI
By default the strategy will use the 50% of the specified capital for each trade; if "Gamble Sizing" is enabled, it will add the specified amount of capital (25% by default, until reaching the 100% limit or lower) for the next trade after having detected a loss in the previous trade; if the next trade is successful, the size for the next trade comes back to 50%
• Trend Filter LONG: If the fast exponential moving average is UNDER the slow exponential moving average , it won't open LONG positions
• Trend Filter SHORT: If the fast exponential moving average is ABOVE the slow exponential moving average , it won't open SHORT positions
• Bars delay: the strategy will wait the specified amount of bars before closing the current position; the counter is triggered as soon as the closing trade condition is verified
BY MAKING USE OF THIS STRATEGY, YOU ACKNOWLEDGE AND AGREE THAT: (1) YOU ARE AWARE OF THE RISKS ASSOCIATED WITH TRANSACTIONS OF DIGITAL CURRENCIES AND THEIR DERIVATIVES; (2) YOU SHALL ASSUME ALL RISKS RELATED TO THE USE OF THIS STRATEGY AND TRANSACTIONS OF DIGITAL CURRENCIES AND THEIR DERIVATIVES; AND (3) I SHALL NOT BE LIABLE FOR ANY SUCH RISKS OR ADVERSE OUTCOMES.
SOURCE CODE BELOW

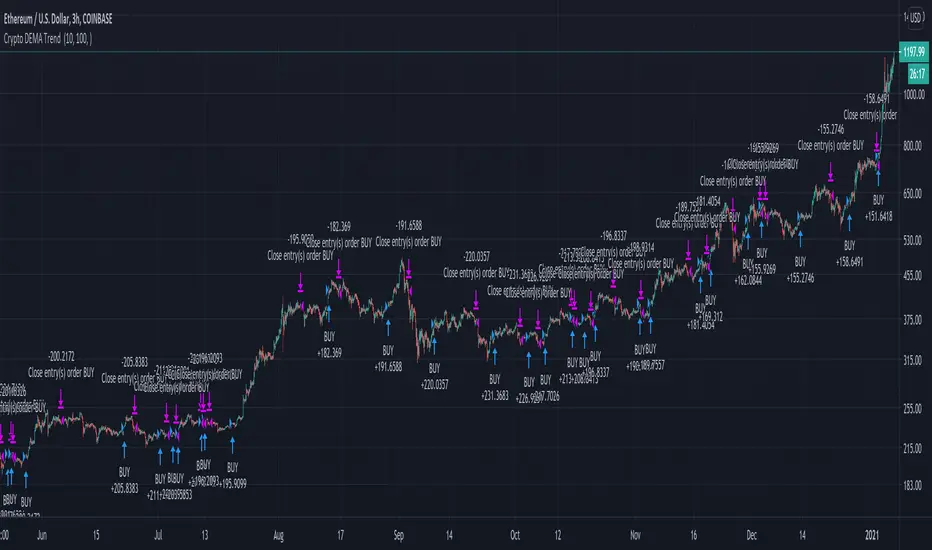
Best Crypto DEMA Strategy Long onlyThis is a crypto strategy suited for big time frames like 3h+.
THIS IS A LONG ONLY STRATEGY , SUITED TO BEAT BUY AND HOLD !
It's a very risky strategy because it has no stop loss at all, so be extremely careful with it.
This strategy is made of 2 DEMA a fast and a slow one.
We have two rules : entry it's when we have a crossunder between the slow DEMA and the fast DEMA. We exit when the opposite happens, in this case, when the slow is above fast.
For this example I used an initial capital of 1000 eur, using 100% of it always, and a commission of 0.2% per each deal.
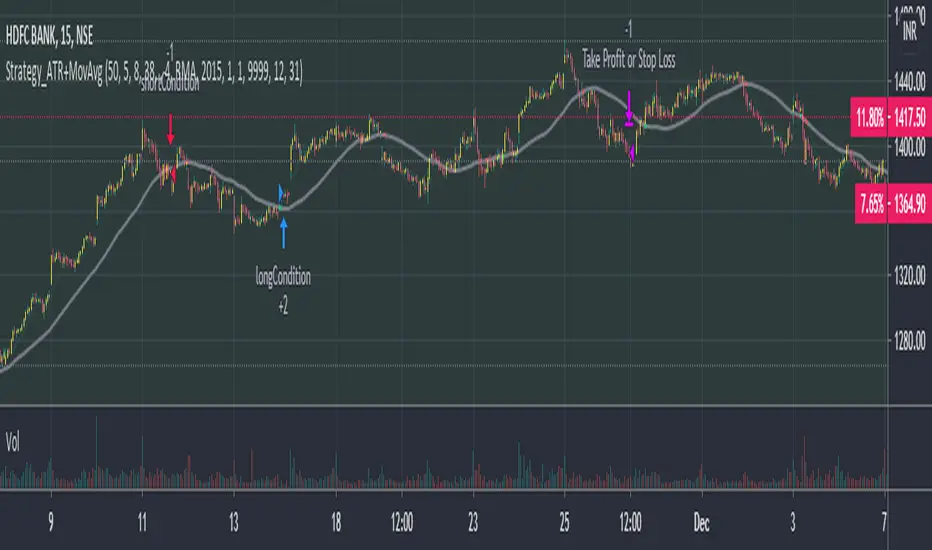
Phoenix085-Strategies==>MTF - Average True Range + MovAvgFIRSTLY, Here are a few who have influenced my pinescripting immensely recently:
@JustUncleL
@BigBitsIO
@TheArtofTrading
@QuantNomad
@SquigglesNiggles and many many many more.
Overview:
> This indicator is a simple crossover of Moving Averages.
> In addition I am using ATR rising as an indication for Trending Price.
> The entry is made once the smaller moving average crosses the bigger moving average, and also the Closes above the Smaller moving average.
> but the only twist here is,
- the ATR source is One timeframe Higher(In this case same as the session).whereas the source for the Moving averages is one Timeframe Lower.
>i.e., if the Session is 1D, the Indicator checks if the ATR is rising in the DAILY TIMEFRAME,
*_* the trade entry is made once the MOVING AVERAGE crossover happens on ONE TIME FRAME lower, as per example, ATR --> 1D = MA -->4H.
> Moving Average ->
- Thick -> Bigger MA,
- Thin and Transparent -> Smaller MA,
> Also, the Color of the Thicker MOVING AVERAGE Changes as Below:
- When LongCondition is satisfied --> Color=Lime
- When ShortCondition is satisfied --> Color=Red
- When neither condition is satisfied --> Color=Gray
NOTE:
1) There is a limitation in using the Securities function for FREE USERS --> Only 500 bars are allowed. So to use the indicators with more data, you need an upgraded TV account.
2) Strategy still needs Fine tuning, but for now, use the Thicker moving average color LIME FOR LONG ENTRIES and RED FOR SHORT ENTRIES.
This is Free for Use and share
Buy - Take Profit OR Stop Loss % BasedScript looks back for a certain period of time and than enter when price close above that look back period ema. Once enter it does not care for how many times price cross above or below. Once entered, it will either hit percenatage based take profit of stop loss.

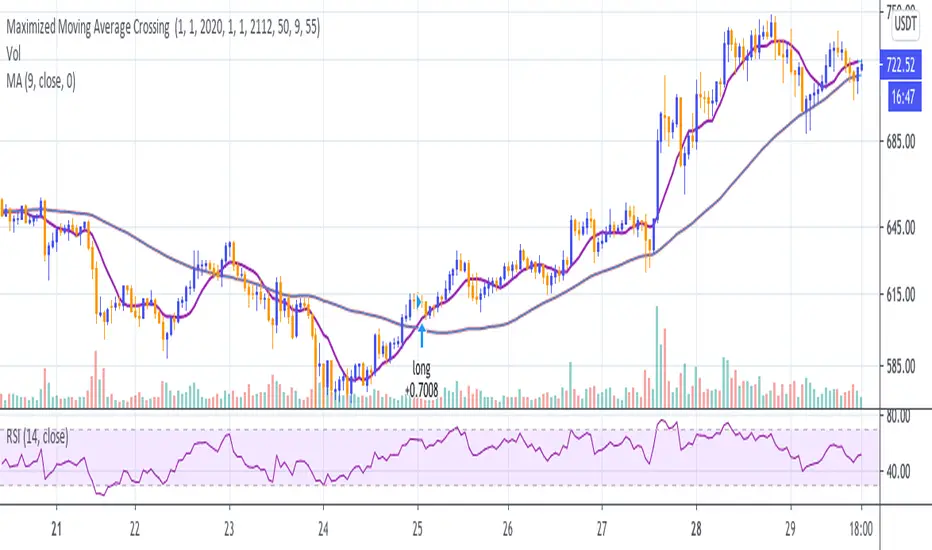
Maximized Moving Average Crossing (by Coinrule)Using the crossings of two Moving Averages to trade in a trading strategy is a Trend-Following approach. As the name would suggest, to be successful, it requires the asset to be on-trend.
The general limit of a common strategy based on Moving Averages is that they underperform when the market is less volatile or trading sideways. When volatility compresses, the indicators get very close one to another, crossing each other very often. That's exactly the condition when trend-following strategies underperform.
To improve this strategy, it's useful to filter the buy signal using the RSI. When the RSI is close to overbought conditions, that means that the coin is likely trading in an uptrend. Strong uptrends usually come with RSI values that stay overbought for long periods, creating interesting opportunities.
Setup
Buy condition: the MA9 crosses above the MA50, and at the same time, the RSI has a value greater than 55.
Sell condition: the MA9 crosses below the MA50.
The strategy is optimized to provide better results on the 1-hr time frame, but it could work well also on higher time frames, such as the 4-hrs.
The strategy assumes each order to trade 30% of the available capital and opens a trade at a time. A trading fee of 0.1% is taken into account.
MrBS:Directional Movement Index [Trend Friend Strategy]This goes with my MrBS:DMI+ indicator. I originally combined them into one, but then you cannot set alerts based on what the ADX and DMI is doing, only strategy alerts, so separate ones have more flexibility and uses.
Indicator Version is found under "MrBS:Directional Movement Index " ()
//// THE IDEA
The majority of profits made in the market come from trending markets. Of course there are strategies that would say otherwise but for the majority of people, THE TREND IS YOUR FRIEND (until the end). The idea is to follow the trend, entering once it has established its self and exiting positions when the trend weakens. This strategy gives a rough idea of the returns produced from following purely the ADX signals. At first Heikin Ashi values were used for the calculation but the results show it's not that effective. The functionality to switch between calculation types has been left in, so we can uses HA candle data to generate signals from while looking at an OHLC chart, if we want to experiment. Due to the way strategies work, we are unable to get reliable results when running the strategy on the HA chart even if we are calculating the signals from the real OHLC values. It is best to always run strategies on standard charts.
When using this strategy, I look for confirmation of the signal based on stochastic (14:3:6) direction, reversal level of stochastic, and divergance, to add confidence and adjust position size accordingly. I am going to try and code some version of that in future updates, if anyone can help or has suggestions please drop me a message.
//// INDICATOR DETAILS
- The default settings are for optimized Daily charts, for 4 hour I would suggest a smoothing of 2.
- The default values used for calculation are the Real OHLC, we can change this to Heikin Ashi in the menu.
- The strategy enters a position when ADX crosses the threshold level, and closes the position when ADX starts to fall.
- There is a signal filter in the form of a 377 period Hull Moving Average, which the price must be above or bellow for long and short positions respectively.
- The strategy closes the position when a cross-under of the ADX and its 4 period EMA. This is an attempt to stay into positions longer as sometimes the ADX will fall for 1 bar and then keep rising, while the overall trend is strong. The downside to this is that we exit trades later and this affects our max drawdown.

Optimized Trend Tracker STRATEGY & SCREENEROptimized Trend Tracker - OTT STRATEGY & SCREENER screens the BUY and SELL signals (trend reversals) for 20 user defined different tickers in Tradingview charts.
Simply input the name of the ticker in Tradingview that you want to screen.
Terminology explanation:
Confirmed Reversal: OTT reversal that happened in the last bar and cannot be repainted.
Potential Reversal: OTT reversal that might happen in the current bar but can also not happen depending upon the timeframe closing price.
Downtrend: Tickers that are currently in the sell zone
Uptrend: Tickers that are currently in the buy zone
Screener has also got a built in OTT indicator which users can confirm the reversals on graphs.
Screener explores the 20 tickers in current graph's time frame and also in desired parameters of the OTT indicator.
Also you can optimize the parameters manually with the built in STRATEGY version.
Optimized Trend Tracker indicator :
Built in Moving Average type defaultly set as VAR but users can choose from 8 different Moving Average types like:
SMA : Simple Moving Average
EMA : Exponential Movin Average
WMA : Weighted Moving Average
TMA : Triangular Moving Average
VAR : Variable Index Dynamic Moving Average aka VIDYA
WWMA : Welles Wilder's Moving Average
ZLEMA : Zero Lag Exponential Moving Average
TSF : True Strength Force
Tip: In sideways VAR would be a good choice
You can use OTT default alarms and Buy Sell signals like:
1-
BUY when Prices are above OTT
SELL when Prices are below OTT
2-
BUY when OTT support Line crosses over OTT line.
SELL when OTT support Line crosses under OTT line.
3-
BUY when OTT line is Green and makes higher highs.
SELL when OTT line is Red and makes lower lows.
IMPORTANT: SCREENER ONLY EXPLORES AND SCREENS FOR THE 2nd SIGNAL TYPE:
BUY when OTT support Line crosses over OTT line.
SELL when OTT support Line crosses under OTT line.

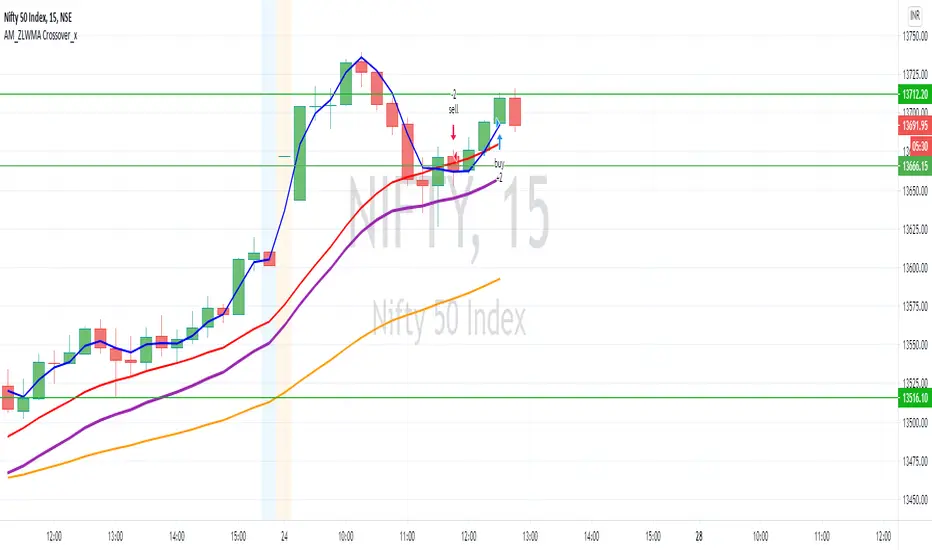
AM_ZLWMA Crossover_xDear All,
Please find updated version of Zero lag WMA crossover. In addition to this added 20/50 EMA to get better results.
Settings:
ZLWMA = 8 identified by Blue line
Fast WMA = 21 identified by Red line
EMA Period 20/50
How to Trade:
Buy: Wait for positive crossover (Blue cross above Red) to happen trade can be taken there but to get better results post crossover once price move above EMA 20 then buy can be initiated.
Sell: Wait for negative crossover (Blue cross below Red) to happen trade can be taken there but to get better results post crossover once price move below EMA 20 then sell can be initiated.
Reason to wait for confirmation of price action above / Below moving average is most of the time it happens that even after crossover happens sometimes it was just a pull back and from there it could be a possibility for reversal. Once price action confirms moving above / below EMA20 then trade will be initiated.
Please comment and ask for any doubt
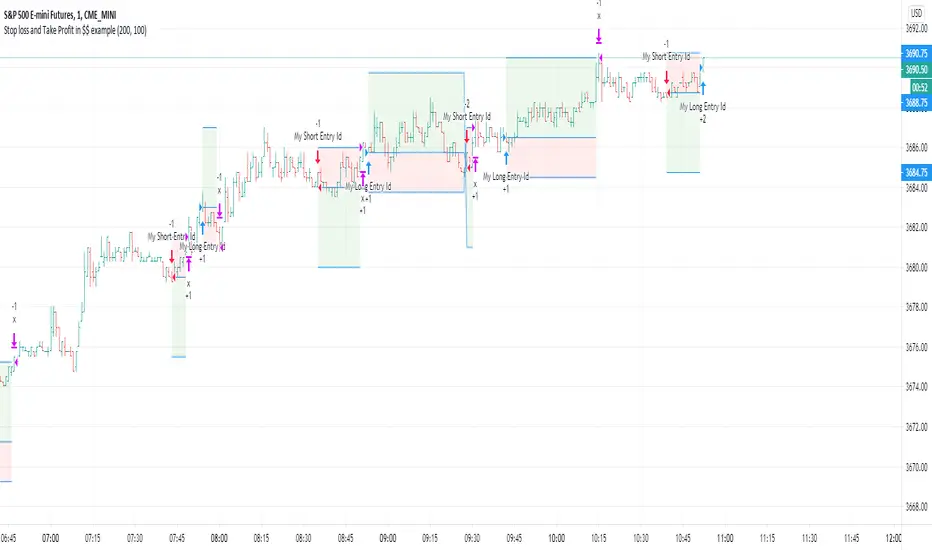
Stop loss and Take Profit in $$ exampleThis is a simple exit example in $$ (symbol's currency) for educational purpose .
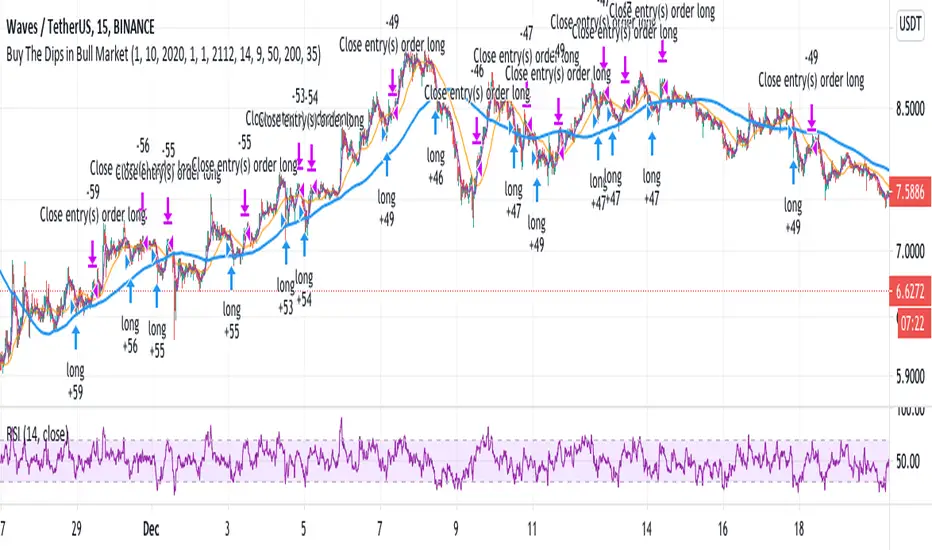
Buy The Dips in Bull Market (by Coinrule)During a Bull market, beating the market, it's challenging. Trading strategies that buy the dips represent one of the best approaches to surf the trend and optimize the returns.
The main obstacle is to gauge the dip's magnitude properly and set up the take profit level accordingly. The RSI is an excellent tool to catch price drops as it adjusts the entry to the asset's current volatility. Nevertheless, using the RSI as an indicator for exit is not an optimal solution in trending markets as it may end up with two scenarios:
The price reverts before reaching overbought conditions. That is the case when the trend is not that strong at that moment. Leaving the position open could result in missed profit opportunities.
The price rebounds strongly, leading the RSI quickly in overbought conditions too soon so that the strategy sells too early.
One interesting option is to combine a trigger based on the RSI to catch the dip and then use two moving averages to spot the right time to seel when the price is entirely back on-trend.
The Setup
The entry-signal comes when the RSI is lower than 35 and the MA9 is above the MA200, indicating that the asset is currently in an uptrend.
The sell-signal comes when at the same time, the price is above the MA9, and the MA9 is above the MA50.
This setup was optimized on the 15-min time frame after over 150 backtests.
A trading fee of 0.1% is taken into account. The fee is aligned to the base fee applied on Binance, which is the largest cryptocurrency exchange.