MomentumIndicatorsLibrary "MomentumIndicators"
This is a library of 'Momentum Indicators', also denominated as oscillators.
The purpose of this library is to organize momentum indicators in just one place, making it easy to access.
In addition, it aims to allow customized versions, not being restricted to just the price value.
An example of this use case is the popular Stochastic RSI.
# Indicators:
1. Relative Strength Index (RSI):
Measures the relative strength of recent price gains to recent price losses of an asset.
2. Rate of Change (ROC):
Measures the percentage change in price of an asset over a specified time period.
3. Stochastic Oscillator (Stoch):
Compares the current price of an asset to its price range over a specified time period.
4. True Strength Index (TSI):
Measures the price change, calculating the ratio of the price change (positive or negative) in relation to the
absolute price change.
The values of both are smoothed twice to reduce noise, and the final result is normalized
in a range between 100 and -100.
5. Stochastic Momentum Index (SMI):
Combination of the True Strength Index with a signal line to help identify turning points in the market.
6. Williams Percent Range (Williams %R):
Compares the current price of an asset to its highest high and lowest low over a specified time period.
7. Commodity Channel Index (CCI):
Measures the relationship between an asset's current price and its moving average.
8. Ultimate Oscillator (UO):
Combines three different time periods to help identify possible reversal points.
9. Moving Average Convergence/Divergence (MACD):
Shows the difference between short-term and long-term exponential moving averages.
10. Fisher Transform (FT):
Normalize prices into a Gaussian normal distribution.
11. Inverse Fisher Transform (IFT):
Transform the values of the Fisher Transform into a smaller and more easily interpretable scale is through the
application of an inverse transformation to the hyperbolic tangent function.
This transformation takes the values of the FT, which range from -infinity to +infinity, to a scale limited
between -1 and +1, allowing them to be more easily visualized and compared.
12. Premier Stochastic Oscillator (PSO):
Normalizes the standard stochastic oscillator by applying a five-period double exponential smoothing average of
the %K value, resulting in a symmetric scale of 1 to -1
# Indicators of indicators:
## Stochastic:
1. Stochastic of RSI (Relative Strengh Index)
2. Stochastic of ROC (Rate of Change)
3. Stochastic of UO (Ultimate Oscillator)
4. Stochastic of TSI (True Strengh Index)
5. Stochastic of Williams R%
6. Stochastic of CCI (Commodity Channel Index).
7. Stochastic of MACD (Moving Average Convergence/Divergence)
8. Stochastic of FT (Fisher Transform)
9. Stochastic of Volume
10. Stochastic of MFI (Money Flow Index)
11. Stochastic of On OBV (Balance Volume)
12. Stochastic of PVI (Positive Volume Index)
13. Stochastic of NVI (Negative Volume Index)
14. Stochastic of PVT (Price-Volume Trend)
15. Stochastic of VO (Volume Oscillator)
16. Stochastic of VROC (Volume Rate of Change)
## Inverse Fisher Transform:
1.Inverse Fisher Transform on RSI (Relative Strengh Index)
2.Inverse Fisher Transform on ROC (Rate of Change)
3.Inverse Fisher Transform on UO (Ultimate Oscillator)
4.Inverse Fisher Transform on Stochastic
5.Inverse Fisher Transform on TSI (True Strength Index)
6.Inverse Fisher Transform on CCI (Commodity Channel Index)
7.Inverse Fisher Transform on Fisher Transform (FT)
8.Inverse Fisher Transform on MACD (Moving Average Convergence/Divergence)
9.Inverse Fisher Transfor on Williams R% (Williams Percent Range)
10.Inverse Fisher Transfor on CMF (Chaikin Money Flow)
11.Inverse Fisher Transform on VO (Volume Oscillator)
12.Inverse Fisher Transform on VROC (Volume Rate of Change)
## Stochastic Momentum Index:
1.Stochastic Momentum Index of RSI (Relative Strength Index)
2.Stochastic Momentum Index of ROC (Rate of Change)
3.Stochastic Momentum Index of VROC (Volume Rate of Change)
4.Stochastic Momentum Index of Williams R% (Williams Percent Range)
5.Stochastic Momentum Index of FT (Fisher Transform)
6.Stochastic Momentum Index of CCI (Commodity Channel Index)
7.Stochastic Momentum Index of UO (Ultimate Oscillator)
8.Stochastic Momentum Index of MACD (Moving Average Convergence/Divergence)
9.Stochastic Momentum Index of Volume
10.Stochastic Momentum Index of MFI (Money Flow Index)
11.Stochastic Momentum Index of CMF (Chaikin Money Flow)
12.Stochastic Momentum Index of On Balance Volume (OBV)
13.Stochastic Momentum Index of Price-Volume Trend (PVT)
14.Stochastic Momentum Index of Volume Oscillator (VO)
15.Stochastic Momentum Index of Positive Volume Index (PVI)
16.Stochastic Momentum Index of Negative Volume Index (NVI)
## Relative Strength Index:
1. RSI for Volume
2. RSI for Moving Average
rsi(source, length)
RSI (Relative Strengh Index). Measures the relative strength of recent price gains to recent price losses of an asset.
Parameters:
source : (float) Source of series (close, high, low, etc.)
length : (int) Period of loopback
Returns: (float) Series of RSI
roc(source, length)
ROC (Rate of Change). Measures the percentage change in price of an asset over a specified time period.
Parameters:
source : (float) Source of series (close, high, low, etc.)
length : (int) Period of loopback
Returns: (float) Series of ROC
stoch(kLength, kSmoothing, dSmoothing, maTypeK, maTypeD, almaOffsetKD, almaSigmaKD, lsmaOffSetKD)
Stochastic Oscillator. Compares the current price of an asset to its price range over a specified time period.
Parameters:
kLength
kSmoothing : (int) Period for smoothig stochastic
dSmoothing : (int) Period for signal (moving average of stochastic)
maTypeK : (int) Type of Moving Average for Stochastic Oscillator
maTypeD : (int) Type of Moving Average for Stochastic Oscillator Signal
almaOffsetKD : (float) Offset for Arnaud Legoux Moving Average for Oscillator and Signal
almaSigmaKD : (float) Sigma for Arnaud Legoux Moving Average for Oscillator and Signal
lsmaOffSetKD : (int) Offset for Least Squares Moving Average for Oscillator and Signal
Returns: A tuple of Stochastic Oscillator and Moving Average of Stochastic Oscillator
stoch(source, kLength, kSmoothing, dSmoothing, maTypeK, maTypeD, almaOffsetKD, almaSigmaKD, lsmaOffSetKD)
Stochastic Oscillator. Customized source. Compares the current price of an asset to its price range over a specified time period.
Parameters:
source : (float) Source of series (close, high, low, etc.)
kLength : (int) Period of loopback to calculate the stochastic
kSmoothing : (int) Period for smoothig stochastic
dSmoothing : (int) Period for signal (moving average of stochastic)
maTypeK : (int) Type of Moving Average for Stochastic Oscillator
maTypeD : (int) Type of Moving Average for Stochastic Oscillator Signal
almaOffsetKD : (float) Offset for Arnaud Legoux Moving Average for Stoch and Signal
almaSigmaKD : (float) Sigma for Arnaud Legoux Moving Average for Stoch and Signal
lsmaOffSetKD : (int) Offset for Least Squares Moving Average for Stoch and Signal
Returns: A tuple of Stochastic Oscillator and Moving Average of Stochastic Oscillator
tsi(source, shortLength, longLength, maType, almaOffset, almaSigma, lsmaOffSet)
TSI (True Strengh Index). Measures the price change, calculating the ratio of the price change (positive or negative) in relation to the absolute price change.
The values of both are smoothed twice to reduce noise, and the final result is normalized in a range between 100 and -100.
Parameters:
source : (float) Source of series (close, high, low, etc.)
shortLength : (int) Short length
longLength : (int) Long length
maType : (int) Type of Moving Average for TSI
almaOffset : (float) Offset for Arnaud Legoux Moving Average
almaSigma : (float) Sigma for Arnaud Legoux Moving Average
lsmaOffSet : (int) Offset for Least Squares Moving Average
Returns: (float) TSI
smi(sourceTSI, shortLengthTSI, longLengthTSI, maTypeTSI, almaOffsetTSI, almaSigmaTSI, lsmaOffSetTSI, maTypeSignal, smoothingLengthSignal, almaOffsetSignal, almaSigmaSignal, lsmaOffSetSignal)
SMI (Stochastic Momentum Index). A TSI (True Strengh Index) plus a signal line.
Parameters:
sourceTSI : (float) Source of series for TSI (close, high, low, etc.)
shortLengthTSI : (int) Short length for TSI
longLengthTSI : (int) Long length for TSI
maTypeTSI : (int) Type of Moving Average for Signal of TSI
almaOffsetTSI : (float) Offset for Arnaud Legoux Moving Average
almaSigmaTSI : (float) Sigma for Arnaud Legoux Moving Average
lsmaOffSetTSI : (int) Offset for Least Squares Moving Average
maTypeSignal
smoothingLengthSignal
almaOffsetSignal
almaSigmaSignal
lsmaOffSetSignal
Returns: A tuple with TSI, signal of TSI and histogram of difference
wpr(source, length)
Williams R% (Williams Percent Range). Compares the current price of an asset to its highest high and lowest low over a specified time period.
Parameters:
source : (float) Source of series (close, high, low, etc.)
length : (int) Period of loopback
Returns: (float) Series of Williams R%
cci(source, length, maType, almaOffset, almaSigma, lsmaOffSet)
CCI (Commodity Channel Index). Measures the relationship between an asset's current price and its moving average.
Parameters:
source : (float) Source of series (close, high, low, etc.)
length : (int) Period of loopback
maType : (int) Type of Moving Average
almaOffset : (float) Offset for Arnaud Legoux Moving Average
almaSigma : (float) Sigma for Arnaud Legoux Moving Average
lsmaOffSet : (int) Offset for Least Squares Moving Average
Returns: (float) Series of CCI
ultimateOscillator(fastLength, middleLength, slowLength)
UO (Ultimate Oscilator). Combines three different time periods to help identify possible reversal points.
Parameters:
fastLength : (int) Fast period of loopback
middleLength : (int) Middle period of loopback
slowLength : (int) Slow period of loopback
Returns: (float) Series of Ultimate Oscilator
ultimateOscillator(source, fastLength, middleLength, slowLength)
UO (Ultimate Oscilator). Customized source. Combines three different time periods to help identify possible reversal points.
Parameters:
source : (float) Source of series (close, high, low, etc.)
fastLength : (int) Fast period of loopback
middleLength : (int) Middle period of loopback
slowLength : (int) Slow period of loopback
Returns: (float) Series of Ultimate Oscilator
macd(source, fastLength, slowLength, signalLength, maTypeFast, maTypeSlow, maTypeMACD, almaOffset, almaSigma, lsmaOffSet)
MACD (Moving Average Convergence/Divergence). Shows the difference between short-term and long-term exponential moving averages.
Parameters:
source : (float) Source of series (close, high, low, etc.)
fastLength : (int) Period for fast moving average
slowLength : (int) Period for slow moving average
signalLength : (int) Signal length
maTypeFast : (int) Type of fast moving average
maTypeSlow : (int) Type of slow moving average
maTypeMACD : (int) Type of MACD moving average
almaOffset : (float) Offset for Arnaud Legoux Moving Average
almaSigma : (float) Sigma for Arnaud Legoux Moving Average
lsmaOffSet : (int) Offset for Least Squares Moving Average
Returns: A tuple with MACD, Signal, and Histgram
fisher(length)
Fisher Transform. Normalize prices into a Gaussian normal distribution.
Parameters:
length
Returns: A tuple with Fisher Transform and signal
fisher(source, length)
Fisher Transform. Customized source. Normalize prices into a Gaussian normal distribution.
Parameters:
source : (float) Source of series (close, high, low, etc.)
length
Returns: A tuple with Fisher Transform and signal
inverseFisher(source, length, subtrahend, denominator)
Inverse Fisher Transform.
Transform the values of the Fisher Transform into a smaller and more easily interpretable scale is
through the application of an inverse transformation to the hyperbolic tangent function.
This transformation takes the values of the FT, which range from -infinity to +infinity,
to a scale limited between -1 and +1, allowing them to be more easily visualized and compared.
Parameters:
source : (float) Source of series (close, high, low, etc.)
length : (int) Period for loopback
subtrahend : (int) Denominator. Useful in unbounded indicators. For example, in CCI.
denominator
Returns: (float) Series of Inverse Fisher Transform
premierStoch(length, smoothlen)
Premier Stochastic Oscillator (PSO).
Normalizes the standard stochastic oscillator by applying a five-period double exponential smoothing
average of the %K value, resulting in a symmetric scale of 1 to -1.
Parameters:
length : (int) Period for loopback
smoothlen : (int) Period for smoothing
Returns: (float) Series of PSO
premierStoch(source, smoothlen, subtrahend, denominator)
Premier Stochastic Oscillator (PSO) of custom source.
Normalizes the source by applying a five-period double exponential smoothing average.
Parameters:
source : (float) Source of series (close, high, low, etc.)
smoothlen : (int) Period for smoothing
subtrahend : (int) Denominator. Useful in unbounded indicators. For example, in CCI.
denominator
Returns: (float) Series of PSO
stochRsi(sourceRSI, lengthRSI, kLength, kSmoothing, dSmoothing, maTypeK, maTypeD, almaOffsetKD, almaSigmaKD, lsmaOffSetKD)
Parameters:
sourceRSI
lengthRSI
kLength
kSmoothing
dSmoothing
maTypeK
maTypeD
almaOffsetKD
almaSigmaKD
lsmaOffSetKD
stochRoc(sourceROC, lengthROC, kLength, kSmoothing, dSmoothing, maTypeK, maTypeD, almaOffsetKD, almaSigmaKD, lsmaOffSetKD)
Parameters:
sourceROC
lengthROC
kLength
kSmoothing
dSmoothing
maTypeK
maTypeD
almaOffsetKD
almaSigmaKD
lsmaOffSetKD
stochUO(fastLength, middleLength, slowLength, kLength, kSmoothing, dSmoothing, maTypeK, maTypeD, almaOffsetKD, almaSigmaKD, lsmaOffSetKD)
Parameters:
fastLength
middleLength
slowLength
kLength
kSmoothing
dSmoothing
maTypeK
maTypeD
almaOffsetKD
almaSigmaKD
lsmaOffSetKD
stochTSI(source, shortLength, longLength, maType, almaOffset, almaSigma, lsmaOffSet, kLength, kSmoothing, dSmoothing, maTypeK, maTypeD, almaOffsetKD, almaSigmaKD, lsmaOffSetKD)
Parameters:
source
shortLength
longLength
maType
almaOffset
almaSigma
lsmaOffSet
kLength
kSmoothing
dSmoothing
maTypeK
maTypeD
almaOffsetKD
almaSigmaKD
lsmaOffSetKD
stochWPR(source, length, kLength, kSmoothing, dSmoothing, maTypeK, maTypeD, almaOffsetKD, almaSigmaKD, lsmaOffSetKD)
Parameters:
source
length
kLength
kSmoothing
dSmoothing
maTypeK
maTypeD
almaOffsetKD
almaSigmaKD
lsmaOffSetKD
stochCCI(source, length, maType, almaOffset, almaSigma, lsmaOffSet, kLength, kSmoothing, dSmoothing, maTypeK, maTypeD, almaOffsetKD, almaSigmaKD, lsmaOffSetKD)
Parameters:
source
length
maType
almaOffset
almaSigma
lsmaOffSet
kLength
kSmoothing
dSmoothing
maTypeK
maTypeD
almaOffsetKD
almaSigmaKD
lsmaOffSetKD
stochMACD(source, fastLength, slowLength, signalLength, maTypeFast, maTypeSlow, maTypeMACD, almaOffset, almaSigma, lsmaOffSet, kLength, kSmoothing, dSmoothing, maTypeK, maTypeD, almaOffsetKD, almaSigmaKD, lsmaOffSetKD)
Parameters:
source
fastLength
slowLength
signalLength
maTypeFast
maTypeSlow
maTypeMACD
almaOffset
almaSigma
lsmaOffSet
kLength
kSmoothing
dSmoothing
maTypeK
maTypeD
almaOffsetKD
almaSigmaKD
lsmaOffSetKD
stochFT(length, kLength, kSmoothing, dSmoothing, maTypeK, maTypeD, almaOffsetKD, almaSigmaKD, lsmaOffSetKD)
Parameters:
length
kLength
kSmoothing
dSmoothing
maTypeK
maTypeD
almaOffsetKD
almaSigmaKD
lsmaOffSetKD
stochVolume(kLength, kSmoothing, dSmoothing, maTypeK, maTypeD, almaOffsetKD, almaSigmaKD, lsmaOffSetKD)
Parameters:
kLength
kSmoothing
dSmoothing
maTypeK
maTypeD
almaOffsetKD
almaSigmaKD
lsmaOffSetKD
stochMFI(source, length, kLength, kSmoothing, dSmoothing, maTypeK, maTypeD, almaOffsetKD, almaSigmaKD, lsmaOffSetKD)
Parameters:
source
length
kLength
kSmoothing
dSmoothing
maTypeK
maTypeD
almaOffsetKD
almaSigmaKD
lsmaOffSetKD
stochOBV(source, kLength, kSmoothing, dSmoothing, maTypeK, maTypeD, almaOffsetKD, almaSigmaKD, lsmaOffSetKD)
Parameters:
source
kLength
kSmoothing
dSmoothing
maTypeK
maTypeD
almaOffsetKD
almaSigmaKD
lsmaOffSetKD
stochPVI(source, kLength, kSmoothing, dSmoothing, maTypeK, maTypeD, almaOffsetKD, almaSigmaKD, lsmaOffSetKD)
Parameters:
source
kLength
kSmoothing
dSmoothing
maTypeK
maTypeD
almaOffsetKD
almaSigmaKD
lsmaOffSetKD
stochNVI(source, kLength, kSmoothing, dSmoothing, maTypeK, maTypeD, almaOffsetKD, almaSigmaKD, lsmaOffSetKD)
Parameters:
source
kLength
kSmoothing
dSmoothing
maTypeK
maTypeD
almaOffsetKD
almaSigmaKD
lsmaOffSetKD
stochPVT(source, kLength, kSmoothing, dSmoothing, maTypeK, maTypeD, almaOffsetKD, almaSigmaKD, lsmaOffSetKD)
Parameters:
source
kLength
kSmoothing
dSmoothing
maTypeK
maTypeD
almaOffsetKD
almaSigmaKD
lsmaOffSetKD
stochVO(shortLen, longLen, maType, almaOffset, almaSigma, lsmaOffSet, kLength, kSmoothing, dSmoothing, maTypeK, maTypeD, almaOffsetKD, almaSigmaKD, lsmaOffSetKD)
Parameters:
shortLen
longLen
maType
almaOffset
almaSigma
lsmaOffSet
kLength
kSmoothing
dSmoothing
maTypeK
maTypeD
almaOffsetKD
almaSigmaKD
lsmaOffSetKD
stochVROC(length, kLength, kSmoothing, dSmoothing, maTypeK, maTypeD, almaOffsetKD, almaSigmaKD, lsmaOffSetKD)
Parameters:
length
kLength
kSmoothing
dSmoothing
maTypeK
maTypeD
almaOffsetKD
almaSigmaKD
lsmaOffSetKD
iftRSI(sourceRSI, lengthRSI, lengthIFT)
Parameters:
sourceRSI
lengthRSI
lengthIFT
iftROC(sourceROC, lengthROC, lengthIFT)
Parameters:
sourceROC
lengthROC
lengthIFT
iftUO(fastLength, middleLength, slowLength, lengthIFT)
Parameters:
fastLength
middleLength
slowLength
lengthIFT
iftStoch(kLength, kSmoothing, dSmoothing, maTypeK, maTypeD, almaOffsetKD, almaSigmaKD, lsmaOffSetKD, lengthIFT)
Parameters:
kLength
kSmoothing
dSmoothing
maTypeK
maTypeD
almaOffsetKD
almaSigmaKD
lsmaOffSetKD
lengthIFT
iftTSI(source, shortLength, longLength, maType, almaOffset, almaSigma, lsmaOffSet, lengthIFT)
Parameters:
source
shortLength
longLength
maType
almaOffset
almaSigma
lsmaOffSet
lengthIFT
iftCCI(source, length, maType, almaOffset, almaSigma, lsmaOffSet, lengthIFT)
Parameters:
source
length
maType
almaOffset
almaSigma
lsmaOffSet
lengthIFT
iftFisher(length, lengthIFT)
Parameters:
length
lengthIFT
iftMACD(source, fastLength, slowLength, signalLength, maTypeFast, maTypeSlow, maTypeMACD, almaOffset, almaSigma, lsmaOffSet, lengthIFT)
Parameters:
source
fastLength
slowLength
signalLength
maTypeFast
maTypeSlow
maTypeMACD
almaOffset
almaSigma
lsmaOffSet
lengthIFT
iftWPR(source, length, lengthIFT)
Parameters:
source
length
lengthIFT
iftMFI(source, length, lengthIFT)
Parameters:
source
length
lengthIFT
iftCMF(length, lengthIFT)
Parameters:
length
lengthIFT
iftVO(shortLen, longLen, maType, almaOffset, almaSigma, lsmaOffSet, lengthIFT)
Parameters:
shortLen
longLen
maType
almaOffset
almaSigma
lsmaOffSet
lengthIFT
iftVROC(length, lengthIFT)
Parameters:
length
lengthIFT
smiRSI(source, length, shortLengthTSI, longLengthTSI, maTypeTSI, almaOffsetTSI, almaSigmaTSI, lsmaOffSetTSI, maTypeSignal, smoothingLengthSignal, almaOffsetSignal, almaSigmaSignal, lsmaOffSetSignal)
Parameters:
source
length
shortLengthTSI
longLengthTSI
maTypeTSI
almaOffsetTSI
almaSigmaTSI
lsmaOffSetTSI
maTypeSignal
smoothingLengthSignal
almaOffsetSignal
almaSigmaSignal
lsmaOffSetSignal
smiROC(source, length, shortLengthTSI, longLengthTSI, maTypeTSI, almaOffsetTSI, almaSigmaTSI, lsmaOffSetTSI, maTypeSignal, smoothingLengthSignal, almaOffsetSignal, almaSigmaSignal, lsmaOffSetSignal)
Parameters:
source
length
shortLengthTSI
longLengthTSI
maTypeTSI
almaOffsetTSI
almaSigmaTSI
lsmaOffSetTSI
maTypeSignal
smoothingLengthSignal
almaOffsetSignal
almaSigmaSignal
lsmaOffSetSignal
smiVROC(length, shortLengthTSI, longLengthTSI, maTypeTSI, almaOffsetTSI, almaSigmaTSI, lsmaOffSetTSI, maTypeSignal, smoothingLengthSignal, almaOffsetSignal, almaSigmaSignal, lsmaOffSetSignal)
Parameters:
length
shortLengthTSI
longLengthTSI
maTypeTSI
almaOffsetTSI
almaSigmaTSI
lsmaOffSetTSI
maTypeSignal
smoothingLengthSignal
almaOffsetSignal
almaSigmaSignal
lsmaOffSetSignal
smiWPR(source, length, shortLengthTSI, longLengthTSI, maTypeTSI, almaOffsetTSI, almaSigmaTSI, lsmaOffSetTSI, maTypeSignal, smoothingLengthSignal, almaOffsetSignal, almaSigmaSignal, lsmaOffSetSignal)
Parameters:
source
length
shortLengthTSI
longLengthTSI
maTypeTSI
almaOffsetTSI
almaSigmaTSI
lsmaOffSetTSI
maTypeSignal
smoothingLengthSignal
almaOffsetSignal
almaSigmaSignal
lsmaOffSetSignal
smiFT(length, shortLengthTSI, longLengthTSI, maTypeTSI, almaOffsetTSI, almaSigmaTSI, lsmaOffSetTSI, maTypeSignal, smoothingLengthSignal, almaOffsetSignal, almaSigmaSignal, lsmaOffSetSignal)
Parameters:
length
shortLengthTSI
longLengthTSI
maTypeTSI
almaOffsetTSI
almaSigmaTSI
lsmaOffSetTSI
maTypeSignal
smoothingLengthSignal
almaOffsetSignal
almaSigmaSignal
lsmaOffSetSignal
smiFT(source, length, shortLengthTSI, longLengthTSI, maTypeTSI, almaOffsetTSI, almaSigmaTSI, lsmaOffSetTSI, maTypeSignal, smoothingLengthSignal, almaOffsetSignal, almaSigmaSignal, lsmaOffSetSignal)
Parameters:
source
length
shortLengthTSI
longLengthTSI
maTypeTSI
almaOffsetTSI
almaSigmaTSI
lsmaOffSetTSI
maTypeSignal
smoothingLengthSignal
almaOffsetSignal
almaSigmaSignal
lsmaOffSetSignal
smiCCI(source, length, maTypeCCI, almaOffsetCCI, almaSigmaCCI, lsmaOffSetCCI, shortLengthTSI, longLengthTSI, maTypeTSI, almaOffsetTSI, almaSigmaTSI, lsmaOffSetTSI, maTypeSignal, smoothingLengthSignal, almaOffsetSignal, almaSigmaSignal, lsmaOffSetSignal)
Parameters:
source
length
maTypeCCI
almaOffsetCCI
almaSigmaCCI
lsmaOffSetCCI
shortLengthTSI
longLengthTSI
maTypeTSI
almaOffsetTSI
almaSigmaTSI
lsmaOffSetTSI
maTypeSignal
smoothingLengthSignal
almaOffsetSignal
almaSigmaSignal
lsmaOffSetSignal
smiUO(fastLength, middleLength, slowLength, shortLengthTSI, longLengthTSI, maTypeTSI, almaOffsetTSI, almaSigmaTSI, lsmaOffSetTSI, maTypeSignal, smoothingLengthSignal, almaOffsetSignal, almaSigmaSignal, lsmaOffSetSignal)
Parameters:
fastLength
middleLength
slowLength
shortLengthTSI
longLengthTSI
maTypeTSI
almaOffsetTSI
almaSigmaTSI
lsmaOffSetTSI
maTypeSignal
smoothingLengthSignal
almaOffsetSignal
almaSigmaSignal
lsmaOffSetSignal
smiMACD(source, fastLength, slowLength, signalLength, maTypeFast, maTypeSlow, maTypeMACD, almaOffset, almaSigma, lsmaOffSet, shortLengthTSI, longLengthTSI, maTypeTSI, almaOffsetTSI, almaSigmaTSI, lsmaOffSetTSI, maTypeSignal, smoothingLengthSignal, almaOffsetSignal, almaSigmaSignal, lsmaOffSetSignal)
Parameters:
source
fastLength
slowLength
signalLength
maTypeFast
maTypeSlow
maTypeMACD
almaOffset
almaSigma
lsmaOffSet
shortLengthTSI
longLengthTSI
maTypeTSI
almaOffsetTSI
almaSigmaTSI
lsmaOffSetTSI
maTypeSignal
smoothingLengthSignal
almaOffsetSignal
almaSigmaSignal
lsmaOffSetSignal
smiVol(shortLengthTSI, longLengthTSI, maTypeTSI, almaOffsetTSI, almaSigmaTSI, lsmaOffSetTSI, maTypeSignal, smoothingLengthSignal, almaOffsetSignal, almaSigmaSignal, lsmaOffSetSignal)
Parameters:
shortLengthTSI
longLengthTSI
maTypeTSI
almaOffsetTSI
almaSigmaTSI
lsmaOffSetTSI
maTypeSignal
smoothingLengthSignal
almaOffsetSignal
almaSigmaSignal
lsmaOffSetSignal
smiMFI(source, length, shortLengthTSI, longLengthTSI, maTypeTSI, almaOffsetTSI, almaSigmaTSI, lsmaOffSetTSI, maTypeSignal, smoothingLengthSignal, almaOffsetSignal, almaSigmaSignal, lsmaOffSetSignal)
Parameters:
source
length
shortLengthTSI
longLengthTSI
maTypeTSI
almaOffsetTSI
almaSigmaTSI
lsmaOffSetTSI
maTypeSignal
smoothingLengthSignal
almaOffsetSignal
almaSigmaSignal
lsmaOffSetSignal
smiCMF(length, shortLengthTSI, longLengthTSI, maTypeTSI, almaOffsetTSI, almaSigmaTSI, lsmaOffSetTSI, maTypeSignal, smoothingLengthSignal, almaOffsetSignal, almaSigmaSignal, lsmaOffSetSignal)
Parameters:
length
shortLengthTSI
longLengthTSI
maTypeTSI
almaOffsetTSI
almaSigmaTSI
lsmaOffSetTSI
maTypeSignal
smoothingLengthSignal
almaOffsetSignal
almaSigmaSignal
lsmaOffSetSignal
smiOBV(source, shortLengthTSI, longLengthTSI, maTypeTSI, almaOffsetTSI, almaSigmaTSI, lsmaOffSetTSI, maTypeSignal, smoothingLengthSignal, almaOffsetSignal, almaSigmaSignal, lsmaOffSetSignal)
Parameters:
source
shortLengthTSI
longLengthTSI
maTypeTSI
almaOffsetTSI
almaSigmaTSI
lsmaOffSetTSI
maTypeSignal
smoothingLengthSignal
almaOffsetSignal
almaSigmaSignal
lsmaOffSetSignal
smiPVT(source, shortLengthTSI, longLengthTSI, maTypeTSI, almaOffsetTSI, almaSigmaTSI, lsmaOffSetTSI, maTypeSignal, smoothingLengthSignal, almaOffsetSignal, almaSigmaSignal, lsmaOffSetSignal)
Parameters:
source
shortLengthTSI
longLengthTSI
maTypeTSI
almaOffsetTSI
almaSigmaTSI
lsmaOffSetTSI
maTypeSignal
smoothingLengthSignal
almaOffsetSignal
almaSigmaSignal
lsmaOffSetSignal
smiVO(shortLen, longLen, maType, almaOffset, almaSigma, lsmaOffSet, shortLengthTSI, longLengthTSI, maTypeTSI, almaOffsetTSI, almaSigmaTSI, lsmaOffSetTSI, maTypeSignal, smoothingLengthSignal, almaOffsetSignal, almaSigmaSignal, lsmaOffSetSignal)
Parameters:
shortLen
longLen
maType
almaOffset
almaSigma
lsmaOffSet
shortLengthTSI
longLengthTSI
maTypeTSI
almaOffsetTSI
almaSigmaTSI
lsmaOffSetTSI
maTypeSignal
smoothingLengthSignal
almaOffsetSignal
almaSigmaSignal
lsmaOffSetSignal
smiPVI(source, shortLengthTSI, longLengthTSI, maTypeTSI, almaOffsetTSI, almaSigmaTSI, lsmaOffSetTSI, maTypeSignal, smoothingLengthSignal, almaOffsetSignal, almaSigmaSignal, lsmaOffSetSignal)
Parameters:
source
shortLengthTSI
longLengthTSI
maTypeTSI
almaOffsetTSI
almaSigmaTSI
lsmaOffSetTSI
maTypeSignal
smoothingLengthSignal
almaOffsetSignal
almaSigmaSignal
lsmaOffSetSignal
smiNVI(source, shortLengthTSI, longLengthTSI, maTypeTSI, almaOffsetTSI, almaSigmaTSI, lsmaOffSetTSI, maTypeSignal, smoothingLengthSignal, almaOffsetSignal, almaSigmaSignal, lsmaOffSetSignal)
Parameters:
source
shortLengthTSI
longLengthTSI
maTypeTSI
almaOffsetTSI
almaSigmaTSI
lsmaOffSetTSI
maTypeSignal
smoothingLengthSignal
almaOffsetSignal
almaSigmaSignal
lsmaOffSetSignal
rsiVolume(length)
Parameters:
length
rsiMA(sourceMA, lengthMA, maType, almaOffset, almaSigma, lsmaOffSet, lengthRSI)
Parameters:
sourceMA
lengthMA
maType
almaOffset
almaSigma
lsmaOffSet
lengthRSI
Momentum-Oszillatoren

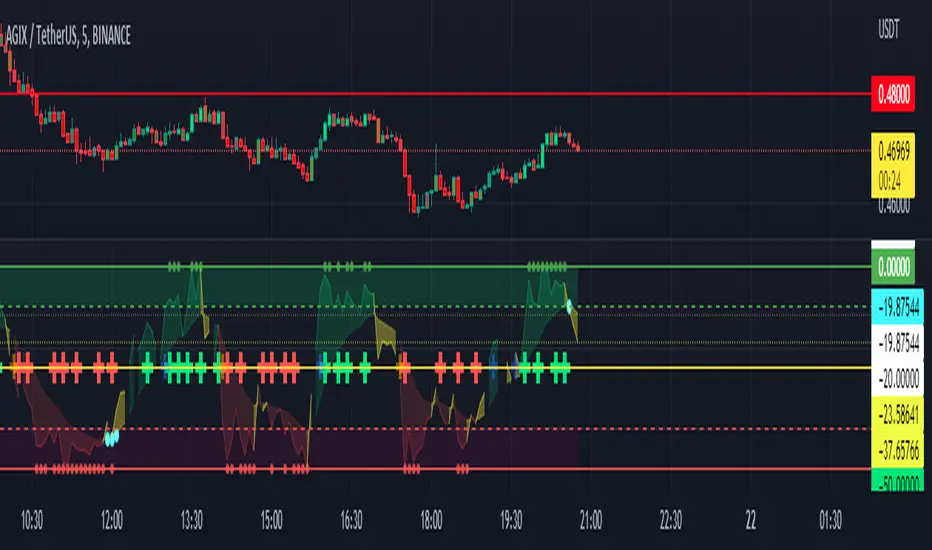
FOREX Master Pattern Trend Finder by nnamdertWhat does this Indicator do?
This indicator works by identifying Trends and "potential" shifts in trends before they happen. It is technically a momentum indicator that watches for specific Bullish or Bearish momentum (i.e. Bull Runs, and Crashes).
How does it do this?
It uses a custom script that takes into account extremes in price and certain moving averages and other accurate forward looking indicators. Once it finds a Bull run, signals are triggered in the form of PLUS signs. It does the same for strong Bearish trends. Based on how the script is configured, the Indicator is able to spot (in advance) unique movement in the trend that can predict a change in momentum prior to the change occurring.
These momentum changes can be configured as alerts.
As seen in the screenshot below the indicator triggers "early warning" signals when it detects a specific movement that is indicative of a potential change in momentum or trend. It does this IN ADVANCE of any change - it is ONLY A PREDICTION but allows the trader to look at the asset to determine if the potential change in trend is valid and gives the trader enough time to set up a trade and stop-loss.
As seen in the screenshot below color-coded candles allow the trader to visually SEE the change on the chart making it easier to get a quick glance at the current trend. In addition, Green and Red Crosses were added to the oscillator to help easily identify trends if the color coded candle feature is turned OFF. These Red and Green Crosses are not located at every highlighted bar location, rather, at the first bar that the alert was triggered on. If there was a gap in the trend, the alert triggers, and plots again when a new trend starts.
As seen in the screenshot below, when a strong trend is present in either direction, small red or green dots are plotted on the oscillator. This makes spotting past and current trends much easier. Even if the price is not moving up or down, this indicates strong underlying buying or selling pressure.
Some traders like using indicators as a reversal finder. Although this indicator is NOT A REVERSAL INDICATOR, I added a signal that can be used as a "potential" reversal finder. You can see this in the screenshot below.
These "reversal" signals typically appear prior to a move in the opposite direction (but not always). A stop-loss can be set at the high or low of the previous bar depending on direction.
At times, multiple "conflicting" warning signals appear back-to-back. This is indicative of a "crab" in the market. Basically, indecision is present in the market. These "early warning" signals are smaller and either BLUE or ORANGE . Once a trend is recognized, the signal will be either RED or GREEN and a bit larger.
Viewing a higher timeframe will allow Forex Master Pattern traders to easily spot contraction zones. I manually draw the lines in at these zones. These "Value Lines" are typically respected in the future. As shown in the screenshot below, the level acted as support in the future and a newer value line was created at a "higher level" - this indicates a Bullish momentum in price as buyers and sellers have agreed upon the higher price as a true value area.
As seen in the screenshot below, multiple potential reversal signals plotted on the chart indicate a "weakening' in the strength of the current trend. This allows the trader to strategically move their stop-loss or simply take some profits off the table at this level.
This Indicator does NOT overlay on the current chart but allows the trader to see color coded bars. Simply double clicking within the indicator will expand the indicator to full screen, and double clicking within the chart itself will hide the secondary pane but keep the candles visible on the chart.
Happy Trading and GOOD LUCK!
Bellcurves (Zeiierman)█ Overview
Bellcurves (Zeiierman) models impulse-driven expansion and contraction in price using a pair of adaptive “Bellcurve” flows (positive/negative), momentum dots, a sensitivity/normalization layer, pre-alerts, decline detection, and a built-in divergence suite. Instead of treating every bar equally, it builds scale-aware impulse fields from a weighted price source, normalizes them into comparable magnitudes, and then highlights impulse clusters, pre-alerts (rising pressure), and impulse declines. These waves behave like impulse envelopes: when expansion persists, columns cluster and momentum dots fire; when pressure fades, decline signals and divergences appear.
Use it to spot the first thrust of a new leg, the final push before exhaustion, or quiet accumulation/distribution within ranges.
⚪ Why This One Is Unique
Bellcurves (Zeiierman) combines several adaptive mechanisms into a single, self-tuning framework that captures both momentum expansion and directional decay. Its dual Bellcurve core extracts directional strength through asymmetric smoothers and non-linear amplification, isolating genuine impulses from random volatility. A Quick-Response mode enhances sensitivity in fast markets, while the normalization layer preserves consistency across instruments and timeframes.
█ Main features
⚪ Bellcurves
The Positive and Negative Bellcurves form the foundation of the indicator, visualizing directional expansion in price. Each curve is derived from weighted price dynamics and transformed into an adaptive field that expands with trend acceleration and contracts during exhaustion. Displayed as column waves (or oscillator-style), they reveal the rhythm of market impulses; steady clustering denotes continuation, while isolated bursts or fading peaks hint at potential reversals.
Price Acceleration
Trend Acceleration
Note: To visualize trend acceleration and sustained high-momentum trends, increase the Bellcurve Trend Length parameter to 200. This setting emphasizes long-term directional strength and filters out short-term noise.
Reversals
⚪ Impulse Dots
Impulse Dots mark the first and last bursts within a momentum cluster. Detected through adaptive clustering logic, these dots appear as green (positive) or red (negative) signals that often coincide with early breakouts or terminal exhaustion zones. Traders can interpret the first dot as potential momentum ignition. Alerts are provided for each stage, enabling fast reaction to shifting impulse conditions.
⚪ Divergences
The built-in Divergence Engine automatically identifies regular bullish and bearish divergences between price and the Bellcurves. By analyzing the declining and rising segments of the curves, it detects subtle mismatches between price movements and underlying impulse strength.
█ How to Use
⚪ Trend Trading
The Bellcurves help visualize the rhythm of market trends through alternating Positive (green) and Negative (red) Bellcurves. These represent periods of directional expansion when momentum builds and contraction when momentum fades.
Tip: To enable the Trend Bellcurves, increase Bellcurve Trend Length to 100–200. To detect regime shifts earlier, consider enabling Quick Response to respond more quickly to emerging trends.
Positive Trend (Green Bellcurve): Indicates bullish control. Sustained green clusters show stable upward participation and consistent buying pressure.
Negative Trend (Red Bellcurve): Indicates bearish control. Sustained red clusters reveal dominant selling pressure and downside continuation.
Trend Transitions
Positive Trend is Strengthening: When the green Bellcurve expands and height increases, momentum is accelerating and bullish conviction is building.
Positive Trend is Weakening: When the green Bellcurve contracts or begins to shrink, upward pressure is fading and potential exhaustion is developing.
Negative Trend is Strengthening: Red columns expand and deepen below the midline, bearish momentum building, and downside pressure increasing.
Negative Trend is Weakening: When the red Bellcurve contracts or softens, it signals that bearish pressure is losing force, a possible early sign of reversal or accumulation.
⚪ Reversal Trading
Reversal trading with the Bellcurves is one of the most effective and visually intuitive strategies, especially when going long after a Negative Bellcurve. These events often occur quickly and sharply, and when combined with key price levels such as the previous day’s close, high, or low, they can provide high-probability entry opportunities.
To focus on only the most meaningful reversals, disable “Activate Sensitive Bellcurves”. This filters out minor impulses and displays only the most significant Bellcurves across the chart, helping you isolate genuine exhaustion or inflection points.
Note: Reversal trading is inherently more challenging due to the increased volatility and emotional intensity (fear and greed) surrounding turning points. Use the Bellcurves as a confirmation tool, not a standalone entry signal. Always consider the broader market context. In strong trending markets, Bellcurve peaks may reflect continued strength rather than reversal.
A Green Positive Bellcurve forming after a fast upward move and rejection from a resistance zone can indicate a potential bearish reversal.
A Red Negative Bellcurve appearing near a support level often acts as confirmation for a potential bullish reversal, suggesting downside exhaustion and renewed buying interest.
⚪ Momentum / Impulse Trading
Momentum (or Impulse) Trading is designed for traders looking to enter in the direction of a strong, ongoing move. The Bellcurves indicator helps identify significant impulses on a higher timeframe, moments where directional pressure expands decisively. Once those impulses are identified, traders can refine entries on a lower timeframe, using an opposite Bellcurve as a trigger signal. This multi-timeframe approach allows for precise entries within larger momentum phases.
Bullish Momentum Trading
Start by analyzing a higher timeframe, for example, the 15-minute chart.
Identify a Positive (Green) Bellcurve and mark the first impulse dot, signaling the beginning of upward momentum.
Drop down to a lower timeframe (such as the 1-minute chart).
Wait for a Negative (Red) Bellcurve to peak; this short-term counter-impulse serves as a pullback entry point.
Enter long as the lower timeframe Bellcurve fades, aligning your trade with the dominant bullish impulse seen on the higher timeframe.
This approach ensures that your long entries occur within an expanding bullish phase, rather than chasing late moves.
Bearish Momentum Trading
Begin on a higher timeframe, such as the 1-hour chart, and locate a Negative (Red) Bellcurve with a visible impulse dot, confirming strong bearish momentum.
Shift to a lower timeframe like the 15-minute chart.
Wait for a Positive (Green) Bellcurve to peak; this short-term upward counter-move acts as a setup for continuation.
Enter short as that green Bellcurve begins to decline, synchronizing with the dominant bearish impulse from the higher timeframe.
This ensures that short trades align with expanding downside momentum, entering at moments of retracement within a broader selling phase.
█ How It Works
⚪ Bellcurve Construction Framework
The indicator generates directional Bellcurves through an adaptive modeling process that measures price displacement and trend curvature over time. Each Bellcurve reflects the evolving balance between expansion and absorption in market flow, forming the characteristic “bell” structures that widen during directional acceleration and compress during consolidation.
Calculation: Employs a multi-layered smoothing and normalization process to enhance directional clarity while preserving overall balance within the signal field.
⚪ Momentum & Cluster Engine
Momentum dots are generated through a multi-stage transformation that identifies the initiation and termination points of impulse clusters. By scanning for statistically relevant minima and maxima within the Bellcurve stream, the system isolates bursts of meaningful directional activity.
Calculation: Applies recursive power mapping and localized clustering to detect temporal impulse boundaries and validate “first” and “last” bursts within each momentum sequence.
⚪ Divergence Module
The divergence framework maps relationships between price structure and Bellcurve dynamics to uncover weakening or strengthening flows beneath visible price action. It detects classical bullish and bearish divergences and projects them directly onto the chart as lines and markers.
Calculation: Uses anchored decline-state tracking, relative high–low comparison, and vector slope analysis to measure phase displacement between price and impulse flow, confirming divergence integrity without lag.
-----------------
Disclaimer
The content provided in my scripts, indicators, ideas, algorithms, and systems is for educational and informational purposes only. It does not constitute financial advice, investment recommendations, or a solicitation to buy or sell any financial instruments. I will not accept liability for any loss or damage, including without limitation any loss of profit, which may arise directly or indirectly from the use of or reliance on such information.
All investments involve risk, and the past performance of a security, industry, sector, market, financial product, trading strategy, backtest, or individual's trading does not guarantee future results or returns. Investors are fully responsible for any investment decisions they make. Such decisions should be based solely on an evaluation of their financial circumstances, investment objectives, risk tolerance, and liquidity needs.
Bezahltes Script

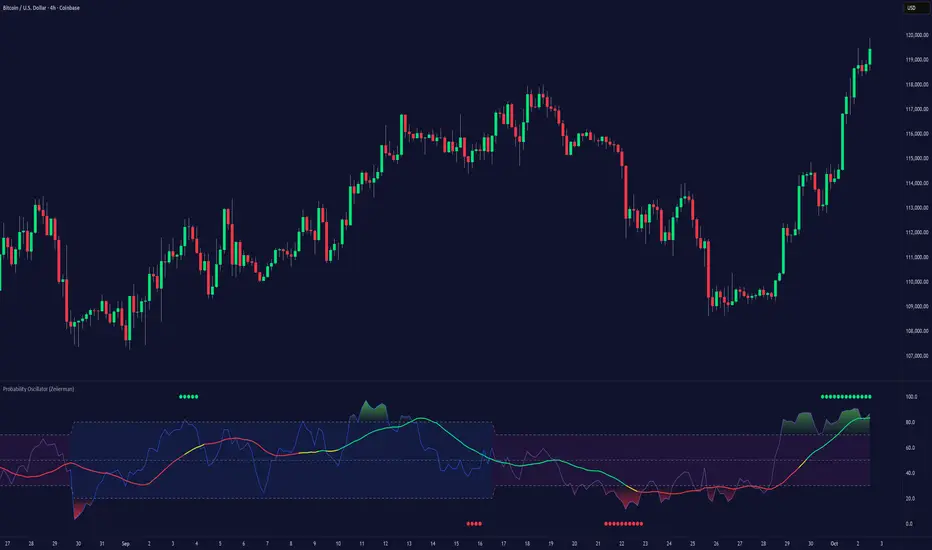
Probability Oscillator (Zeiierman)█ Overview
The Probability Oscillator (Zeiierman) turns price dynamics into a regime-aware probability map of continuation vs. reversal. Rather than treating momentum as a single, fixed signal, it adapts its core estimator to current market conditions—favoring trend persistence in calm regimes and oscillation/reversion in volatile regimes.
You get a fast Probability line, a slower Signal line, dynamic OB/OS bounds, midline bias, color-coded trend probability, background regime cues, and Momentum Impulse dots that reveal concentrated bursts of directional intent. Beneath the surface, the Probability line functions as a sequential Bayesian filter — continuously updating a regime-conditioned prior (trend or volatility) with new market evidence. The resulting posterior odds are then expressed as a bounded oscillator for intuitive interpretation. In stable markets, the prior favors continuity; in volatile markets, it reweights toward mean reversion.
⚪ Why This One Is Unique
The Probability Oscillator operates within a self-adaptive probabilistic framework that continuously reshapes itself in response to the market’s evolving structure. Rather than relying on fixed formulas or static thresholds, it employs a context-aware Bayesian core that interprets flow dynamics through an adaptive regime model.
Its internal architecture blends state recognition, probability normalization, and dynamic envelope mapping, allowing it to adjust between conditions of directional stability and volatility-driven reversion fluidly. The result is an intelligent, self-adjusting probability field that remains stable in trends, reactive in consolidations, and contextually aware across all market states—delivering a refined sense of probabilistic direction without exposing raw computational structure.
█ Main Features
⚪ Probability Oscillator
At the core lies a probability-driven oscillator that continuously adapts its internal weighting to evolving market behavior. It translates incoming price evidence into a smooth probability curve that distinguishes between continuation and reversion phases, providing a refined view of conviction beneath price action.
The Probability Oscillator estimates the likelihood of trend continuation while dynamically adjusting to the surrounding volatility regime:
Probability Line (fast) – Captures short-term probability shifts, weighted by current market conditions — calm or volatile.
Signal Line (slow) – A smoothed probability filter that defines the prevailing bias and confirms directional persistence.
Momentum Impulse Dots – Small markers highlighting bursts of positive (green) or negative (red) momentum, indicating transitions in conviction strength.
The oscillator’s probabilistic framework automatically transitions between two self-adaptive modes:
Low-Volatility Mode – Prioritizes directional momentum and smooth trend continuity, ideal for trending markets.
High-Volatility Mode – Emphasizes oscillatory probability swings and reversals, optimized for range-bound or transitional conditions.
This dual-regime behavior allows the Probability Oscillator to remain stable in directional trends yet responsive in volatile ranges, producing a coherent probabilistic signal across any timeframe.
⚪ Trend Probability Coloring
The Trend Probability Coloring system transforms the Signal Line into a live confidence gauge. Its adaptive hue reflects the underlying probabilistic bias — green for sustained bullish pressure, red for bearish control, and yellow during transitional uncertainty. Behind the scenes, it applies curvature-sensitive weighting and probabilistic smoothing to display a visually coherent measure of directional conviction.
⚪ Impulse Dots
Impulse Dots identify moments of concentrated momentum expansion — short bursts of probabilistic acceleration that often precede shifts in structure. Each impulse represents a localized jump in directional confidence, isolating meaningful change-points from background noise. The result is a precise visualization of where probability and price begin to align, revealing early cues of strength, exhaustion, or imminent rotation.
█ How to Use
⚪ Trend Following
The Signal Line acts as the long-term probabilistic trend gauge, revealing when the market is building or losing directional conviction. Its slope and color communicate both bias and transition strength:
Green → bullish probability bias (trend continuation likely).
Red → bearish probability bias (downside continuation likely).
Yellow → transitional or indecisive phase (potential regime shift).
Use the Signal Line to confirm directional alignment:
A transition from red → yellow → green signals that the market is turning bullish and probability is shifting toward continuation on the upside.
A transition from green → yellow → red signals that bullish conviction is fading and bearish control is emerging.
⚪ Overbought & Oversold
The Probability Oscillator can also be used to identify overbought and oversold conditions by observing when the Probability Line moves above its upper bound or below its lower bound. These events often signal potential market slowdowns, pullbacks, or even broader reversals depending on context and regime.
The OB/OS levels automatically adapt to the prevailing market mode:
Trend Mode (~70/30) – Optimized for riding trends and timing pullbacks within directional continuations.
Volatility Mode (~80/20) – Tailored for fading extremes and capturing fast mean-reversion moves during consolidation phases.
Signals: Reclaims from oversold zones within a bullish bias, or rejections from overbought zones in a bearish bias, represent high-probability inflection points — especially when confirmed by Impulse Dots or regime-aligned Signal Line color transitions.
⚪ Using Volatility Modes to Choose Strategy
The Probability Oscillator automatically adapts its behavior to the active volatility regime, enabling traders to align their approach with the current market state. One of the most effective ways to use the tool is to select a trading strategy that aligns with the prevailing market mode.
Trend Mode (purple fill) – Represents low-volatility, directional environments where markets move smoothly and sustain momentum over time. In these conditions, a trend-following approach is most effective. Focus on the broader direction, participate on Probability-over-Signal crossups above 50, and trail positions as long as the Signal Line remains green. These calm phases often persist before volatility expansion, making them ideal for riding steady continuation waves rather than reacting to short-term fluctuations.
Volatility Mode (blue switch bar) – Activates in high-volatility conditions, signaling increased market agitation and sharper price swings. In this regime, trading becomes more tactical. Mean-reversion and scalping strategies perform best—fade OB/OS extremes, use midline reclaims for timing, or trade Impulse confirmations to capture breakout accelerations and short-term momentum surges.
⚪ Impulse
The Momentum Impulses highlight periods when the market experiences sharp bursts of directional momentum, marking transitions in conviction strength and energy expansion.
Green top dots → Indicate strong bullish impulses, often signaling the onset or acceleration of upward momentum.
Red bottom dots → Indicate strong bearish impulses, highlighting pressure buildup or downside continuation.
These impulses are particularly useful in two contexts:
During ranging markets , they help confirm overbought and oversold conditions, signaling when reversals or exhaustion points are highly probable.
During regime transitions , they validate breakout strength, confirming that new directional phases are supported by genuine momentum rather than noise.
In essence, Impulse Dots visualize the heartbeat of market conviction—pinpointing where momentum surges align with probabilistic bias, whether to confirm a breakout or warn of exhaustion in choppy conditions.
█ How It Works
⚪ Regime Switch Engine
At the foundation lies a Bayesian regime adaptation process that treats volatility as evolving market evidence. The system continuously updates a prior belief about whether the market favors directional persistence or oscillatory reversion. In calm states, it maintains a continuity-biased belief structure that favors smoother probability propagation.
Calculation: Employs a volatility-normalized Bayesian comparator, generating a posterior distribution over regime likelihoods. This ensures the oscillator remains statistically invariant to scale and consistent across instruments and timeframes.
⚪ Trend Probability Coloring (Conviction Layer)
The Trend Probability Coloring system visualizes Bayesian posterior confidence in real time. It continuously updates the Signal Line’s color as new evidence shifts the model’s belief between bullish, neutral, and bearish states.
When the posterior probability leans strongly upward, the line turns green; as uncertainty grows, it fades to yellow; and when conviction turns negative, it transitions to red. Each color change represents a probabilistic reweighting — the model’s evolving assessment of directional dominance.
Calculation: Applies posterior-weighted smoothing and curvature-based confidence mapping to translate Bayesian belief strength into a fluid visual gradient.
⚪ Momentum Impulse Engine
The Momentum Impulse Engine detects sudden bursts in probabilistic conviction — moments when the Bayesian posterior sharply reweights toward one directional outcome. These impulses represent statistically significant shifts in belief, where new evidence rapidly alters the model’s assessment of market direction.
Green impulses highlight surges in bullish probability; red impulses mark spikes in bearish conviction. Each impulse reflects a brief phase of directional dominance, revealing where probability momentum begins to accelerate or exhaust.
Calculation: Employs nonlinear Bayesian change detection and extreme-value gating to isolate abrupt posterior inflections.
-----------------
Disclaimer
The content provided in my scripts, indicators, ideas, algorithms, and systems is for educational and informational purposes only. It does not constitute financial advice, investment recommendations, or a solicitation to buy or sell any financial instruments. I will not accept liability for any loss or damage, including without limitation any loss of profit, which may arise directly or indirectly from the use of or reliance on such information.
All investments involve risk, and the past performance of a security, industry, sector, market, financial product, trading strategy, backtest, or individual's trading does not guarantee future results or returns. Investors are fully responsible for any investment decisions they make. Such decisions should be based solely on an evaluation of their financial circumstances, investment objectives, risk tolerance, and liquidity needs.
Bezahltes Script
DRM StrategyOne of the ways I go when I develop strategies is by reducing the number of parameters and removing fixed parameters and levels.
In this strategy, I'm trying to create an RSI indicator with a dynamic length.
Length is computed based on the correlation between Price and its momentum.
You can set min and max values for the RSI, and if the correlation is close to 1, we'll be at a min RSI value. When it's -1, we'll be at the max level.
I got this idea from Sofien Kaabar's book.
The strategy is super simple, and there might be much room for improvement.
Performance on the deep backtesting is not excellent, so I think the strategy needs some filters for regimes, etc.
Thanks to @MUQWISHI for helping me code it.
Disclaimer
Please remember that past performance may not indicate future results.
Due to various factors, including changing market conditions, the strategy may no longer perform as well as in historical backtesting.
This post and the script don’t provide any financial advice.

True Momentum OscillatorThe True Momentum Oscillator (TMO) calculates the delta of the price using the open and close. We have taken the true momentum oscillator a step further and have added the momentum of the main signal (TMO) and the smooth signal line. We believe this helps give a clearer picture of price momentum and helps verify crossovers of the TMO and the smooth signal line. The momentum lines can also help confirm a divergence of the TMO. We have also added multiple moving average options so the user can customize the TMO to suit their needs.
TMO- Green when above Smooth Signal Line, red when below Smooth Signal Line
Smooth Signal- Gray Line
Histogram- TMO-Smooth Signal
TMO Momentum- Orange line
Smooth Signal Momentum- Yellow line
Overbought/Oversold regions- Gray highlighted boundaries
The TMO has defined overbought and oversold regions where either a crossover signal or divergence in the oscillator itself can be taken as a signal. Similar to the MACD, a crossover of the zero line by the TMO can also be utilized as a signal.

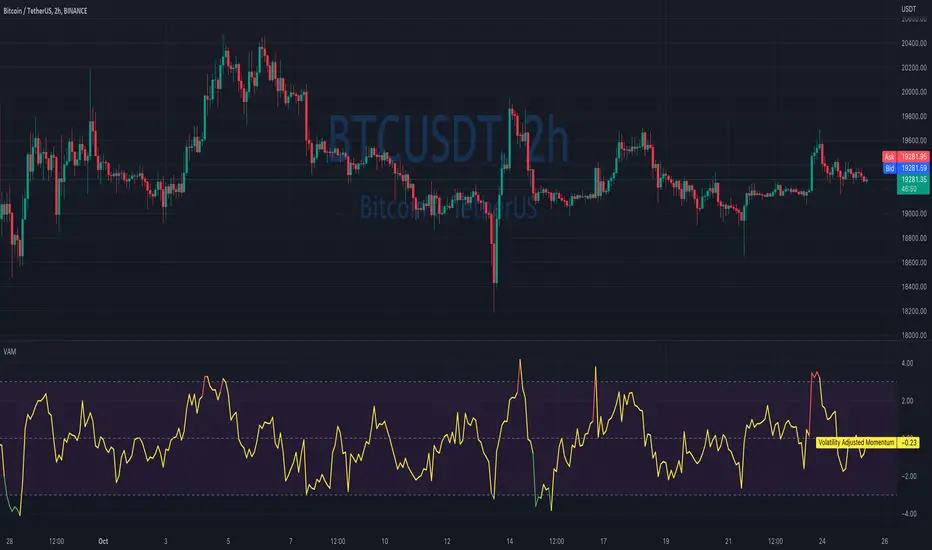
Volatility Adjusted MomentumIt's a script that computes volatility-adjusted momentum indicators.
The problem with the momentum indicator is that it's absolute and it's hard to interpret its value. For example, if you'll change the timeframe or instrument value of Momentum will be very different.
We tried to solve that by expressing momentum in volatility. This way you can easier spot overbought/oversold values.
You can choose to use Standard Deviation or ATR for adjustments.
Thanks to @MUQWISHI for helping me code it.
Disclaimer
Please remember that past performance may not be indicative of future results.
Due to various factors, including changing market conditions, the strategy may no longer perform as well as in historical backtesting.
This post and the script don’t provide any financial advice.
Fisherized CCIIntroduction
This here is a non-repainting indicator where I use inverse Fisher transformation and smoothing on the well-known CCI (Commdity Channel Index) momentum indicator.
"The Inverse Fisher Transform" describes the calculation and use of the inverse Fisher transform by Dr . Ehlers in 2004. The transform is applied to any indicator with a known probability distribution function. It enables to transform an indicator signal into the range between +1 and -1. This can help to eliminate the noise of an indicator.
The CCI is an momentum indicator which describes the distance of the price to the average price.
For smoothing I used the Hann Window and NET (Noise Elimination Technique) methods.
Additional Features
Divergence Analysis
Trend-adaptive Histogram
Timeframe selection
Usage
It is usually used to spot potential trend reverals or mean-reversion (against the trend) trades on lower timeframes. IMO it can be even used to spot trend-following trades. It always depends on which settings you have, which timeframe do you use and which indicators you combine with it.
The suggested timeframe for this indicator is 15 min (with the length setting on 50).
The histogram with adaptive mode enabled could be used as filter applied on the buy and sell signals.
The divergence analysis can help to spot additional entries/exits or confirm the buy and sell signals.
Always try to find the best settings! This indicators has a lot of customization options you should take advantage of.
Signals
The indicator uses the following logic to generate the buy and sell signals:
Normal
Buy -> When CCI and MA go above the top band (usually +100) and cross
Sell -> When CCI and MA go below the the bottom band (usually -100) and cross
Fisherized
Buy -> When CCI and MA go above the the zero line and cross
Sell -> When CCI and MA go below the the zero line and cross
Have fun with the indicator! I am open for feedback and questions. :)

Crypto-DX Crypto Directional Index [chhslai]Crypto-DX can be used to help measure the overall strength and direction of the crypto market trend.
Furthermore, it can be used as a screener to find out cryptocurrencies which are accumulating momentum and tends to potentially pump or dump.
How this indicator works :
If the Crypto-DX cross above the zero-level, it could be an indication that there is a trend reversal into upward. You should close your short position or place a long order right away.
If the Crypto-DX cross below the zero-level, it could be an indication that there is a trend reversal into downward. You should close your long position or place a short order right away.
If the Crypto-DX is consolidated around the zero-level, it could be an indication that the trend may be ended and followed by a sideway market. You are suggested not to place any order and wait for the market moves.
Divergence based trading strategy is fully applicable, just like the MACD.
Screener features :
Plot "Crypto Index" and "5 Custom Crypto"
Plot "Crypto Index" and "Top 30 Crypto"

CoG RSI Momenum Ichimoku CloudThis indicator is inspired by "RSI ICHIMOKU CLOUD".
Script plots price bars based on selected indicator with Ichimoku Cloud around it.
In my version I have added different oscillators for bar calculations.
Specifically you can choose from:
Center of Gravity(CoG)
Momentum
RSI

Price change scalping short and long strategy indicatorPrice change scalping Short and Long indicator uses a rate of change momentum oscillator to calculate the percent change in price between a period of time. Rate of change calculation takes the current price and compares it to a price of "n" periods while the period of time can be defined by a user. The calculated rate of change value is then compared to the upper threshold and the lower threshold values to determine if a position should be opened. If the threshold is crossed and filtering conditions are met a strategy position will be triggered. Entry, take profit, and stop loss prices are calculated and displayed on the chart as well as positions directions. Once the entry price is crossed, a long or short position is created and once the take profit price is crossed, the stop loss price will begin to trail behind the price action using the close of the previous bar. Once the trailing stop price is crossed, the position is closed. If the entry price is not crossed and the price action crosses the stop level, the trade setup is cancelled. The indicator is enhanced by DCA algorithm which allows to average entry price with safety orders. The script also allows to use Martingale coefficient to increase averaging power
Advantages of this script:
The indicator has custom alert settings for each strategy action
The indicator can be used with 3Commas, Cryptohopper, Alertatron or Zignaly bots
High frequency and low duration of trades
Can be used with short-term timeframes ranging from 5 to 60 minutes
Indicator is sustainable to market slumps due to DCA implementation
Can be used for short and long positions (can be adjusted to long only, short only or both)
Can be applied to any market and quote currency
Easy to configure user interface settings
Built in detailed statistic menu
How to use?
1. Apply the indicator to a trading pair your are interested in using 5 to 60 minutes timeframe chart
2. Configure the indicator: change layer values, order size multiple and take profit/stop loss values according to current market cycle stage
3. Set up a TradingView custom alert using the indicator settings to trigger on a condition you are interested in
4. indicator will send alerts when to enter and when to exit positions which can be applied to your portfolio using external trading platforms
5. Update settings once market conditions are changed using backtests on a monthly period
Price change scalping short and long strategyPrice change scalping Short and Long strategy uses a rate of change momentum oscillator to calculate the percent change in price between a period of time. Rate of change calculation takes the current price and compares it to a price of "n" periods while the period of time can be defined by a user. The calculated rate of change value is then compared to the upper threshold and the lower threshold values to determine if a position should be opened. If the threshold is crossed and filtering conditions are met a strategy position will be triggered. Entry, take profit, and stop loss prices are calculated and displayed on the chart as well as positions directions. Once the entry price is crossed, a long or short position is created and once the take profit price is crossed, the stop loss price will begin to trail behind the price action using the close of the previous bar. Once the trailing stop price is crossed, the position is closed. If the entry price is not crossed and the price action crosses the stop level, the trade setup is cancelled. The strategy is enhanced by DCA algorithm which allows to average entry price with safety orders. The script also allows to use Martingale coefficient to increase averaging power
Advantages of this script:
Strategy has high net profit of 293% at backtests
Backtests show high accuracy around 71%
High frequency and low duration of trades
Can be used with short-term timeframes ranging from 5 to 60 minutes
Strategy is sustainable to market slumps due to DCA implementation
Can be used for short and long positions (can be adjusted to long only, short only or both)
Can be applied to any market and quote currency
Easy to configure user interface settings
Built in detailed statistic menu
How to use?
1. Apply the strategy to a trading pair your are interested in using 5 to 60 minutes timeframe chart
2. Configure the strategy: change layer values, order size multiple and take profit/stop loss values according to current market cycle stage
3. Set up a TradingView alert to trigger when strategy conditions are met
4. Strategy will send alerts when to enter and when to exit positions which can be applied to your portfolio using external trading platforms
5. Update settings once market conditions are changed using backtests on a monthly period

Relative Strength MomentumThe RSI is a traders friend - it can provide insight that other indicators simply cannot. The RSI achilles heel is that it can often fail to highlight divergence. Constance Brown attempted to resolve this problem with the 'Composite index' - a powerful tool. However.. for me, looking at two indicators can get a bit much - especially if viewing multiple time-frames. I want one tool which provides the RSI, it's ranging/reversal behaviour (as documented by Andrew Cardwell) and a better grasp of momentum swings (via divergence and reversal signals). So this is my best effort, and I hope it can prove useful to some of you. At first the differences may be hard to spot - but they are there!
My default settings are optimised - as with the 'normal' RSI you can expect a bullish trend to result in few (if any) moves below 30. In a bearish trend, you can expect few (if any) incursions above 70. Cardwell's observations apply. I recommend using this with a 50 period EMA to provide some additional context.
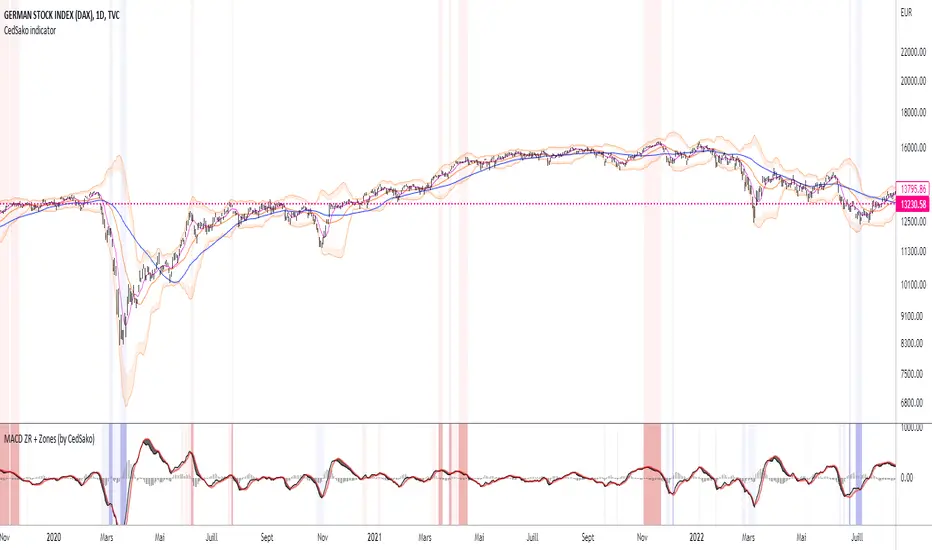
MACD ZERO RETARD + Zones importantes (CedSako)MACD indicator with zero lag. (formula calculated so as to be as close as possible to the price reaction).
In addition, you can add a background that will give you the key buy and sell zones (the first based solely on the MACD ZR, the second on a Momentum system and finally the ultimate zones include the MACD and the Momentum) .
This indicator is not a buy or sell signal, but can usefully be used in your strategy to confirm your entry and exit points.
Do not hesitate to go see my other indicator (based on volatility and different averages).
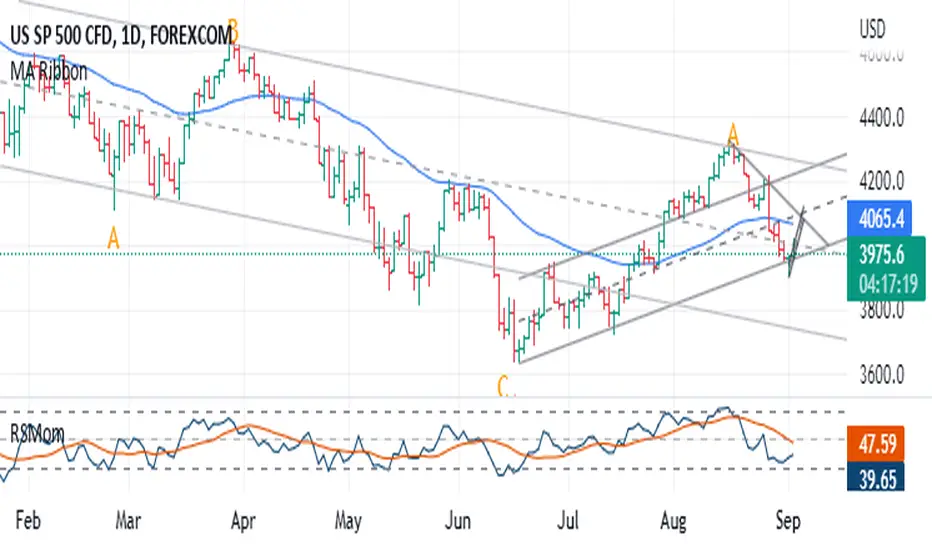
Trend Friendly RSITrend Friendly RSI
Unlike the standard RSI, "Trend Friendly RSI" adapts to the trend. RSI and other momentum-based oscillators cannot give a buy signal in uptrends and a sell signal in downtrends because they do not take into account the momentum of the trend and behave as if the price is in a constant sideways trend. "Trend Friendly RSI", on the other hand, takes into account the momentum of the trend of your chosen length and subtracts it from the current momentum, thus giving more realistic buy and sell signals.
use it to identify your long-term investments and trading entry points for hodl. It would be wise to use this indicator for assets that you have done fundamental analysis and are sure of the trend direction. it doesn't know what the price will do, it just shows the points that are suitable for you.
remember this indicator will fail in horizontal trends.

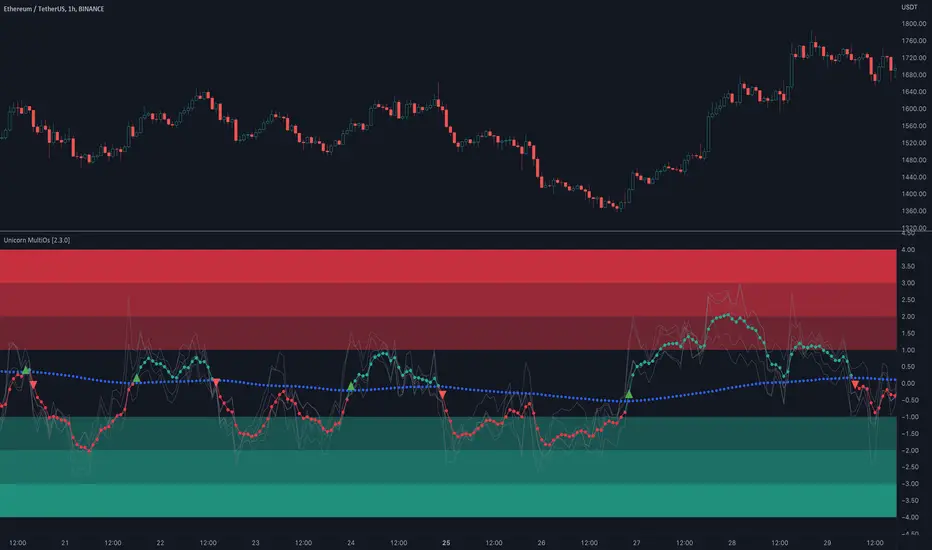
Unicorn MultiOsMultiOs is an oscillator that combines several widely used oscillators into one. In order to combine different oscillators, it is necessary to reduce them to a single scale. To do this we have developed a custom method based on z-scoring and adjusting by volatility .
The user can choose which of the oscillators from the list to combine into one. The combinations are countless. Some of the combinations may be a better fit for certain markets or trading styles. We call this new class of indicators obtained by combining several oscillators into one - "super oscillators". MultiOs provides a wide scopе for experimentation in creating different super oscillators. A good way to start is to combine all the oscillators from the list into one.
As our practice shows, combining several oscillators into one provides a number of advantages:
The compound super oscillator is smoother than any of its components, but its lag does not increase. This is due to the fact that the calculation does not require additional rolling window averaging. The averaging is performed over an ensemble of several non-smoothed oscillators. The signals are easier to read due to this alternative smoothing mechanism.
The signals are more meaningful and confirmed because they contain contributions from several oscillators and represent their consensus.
In the Candle Mode the MultiOs oscillator is plotted as a candlestick chart. You can apply all sorts of technical analysis to the oscillator candlestick chart, including candlestick patterns analysis. Reversal candlestick patterns in the overbought and oversold zones can give you leading price reversal signals.
We have also included an option to apply the regular smoothing to the MultiOs oscillator. The smoothing feature applies a simple moving average to the oscillator. The Smoothing parameter sets the period of the smoothing moving average.
This feature helps to reduce the number of false trend change signals. But don't forget that smoothing increases the indicator lag. So if you use smoothing, prefer smaller Smoothing parameter values (less than 10). And try to find the optimal tradeoff.
HOW TO USE
Choose which oscillators you would like to include into the mixture, and use the resulting super oscillator as your normal oscillator: forecast price reversals with overbought/oversold conditions and divergences, enter trends with zero line cross signals, detect narrow sideways markets when the oscillator fluctuates in the «gray zone» not going overbought or oversold.
When using this script, please, keep in mind that past results do not necessarily reflect future results and that many factors influence trading results.
SETTINGS
The indicator settings panel allows you to set the parameters that control the calculation and visualization of the indicator. You can also more deeply customize the display of the indicator on the Style tab of the indicator settings panel. This can be useful, for example, to change the colors or make some of the lines brighter.
GLOBAL MODE
Candle Mode - turns on/off the Candle Mode in which the MultiOs oscillator is plotted as a candlestick chart.
MAIN
Oscillator period - sets the oscillator period, which determines the size of the main rolling window, on which all calculations are made.
Smoothing - sets the oscillator smoothing intensity. The value 1 corresponds to the absence of smoothing.
Use Momentum, Use RSI , Use Stochastic , etc. - include/exclude the corresponding oscillator in/from the MultiOs calculation.
DISPLAY
Show MultiOS, Show Momentum, Show RSI , etc. - enable/disable the display of the corresponding oscillator.
Show Zero Line - enables/disables the display of the zero level.
Ripple Momentum Indicator[LeonidasCrypto]Ripple momentum indicator.
This is indicator is not based on any other indicator.
This indicator is a momentum indicator.
How is working?
This indicator is calculating the gap in for each candle and determining the volatility of this candle . Applying WMA average we can get an idea if the volume is coming to the market or not.
Following the same theory as OBV oscillator "Volume will follow the price". This indicator will help to see if the asset is bearish or bullish based on volatility and volume.
How to trade?
Bullish/Bearish divergences
Trends:
Bellow the line 1: the asset should be considered bearish
Above the line 1: the asset should be considered bullish
Longs:
wait for the signal crossing the bands this is telling you the momentum/volume/volatility are expanding.
Shorts:
Wait for the signal crossing below the band. this is telling you the asset is losing momentum/volume/volume are expanding
Band:
This band is acting as dynamic support of resistance.

Squeeze mom MTF filtered by Wavetrend with div (Tilt)📋 Description :
This script is based on two famous indicators from @Lazybear : Squeeze Momentum and WaveTrend. fr.tradingview.com
The idea is to use the Wavetrend crossovers and filter them according to the momentum curve.
There is a multi timeframe module with automatic selection of the higher timeframe. The user can also choose his timeframe manually.
There is also a detection of regular and hidden divergences
🛠 Options :
- filtering the cross wave trend according to the momemtum curve
- active or not higher timeframe with automatic or manually timeframe selection
- display or not WaveTrend ans squeeze momentum
- Show a tape that signals when wavetrend is overbought or oversold
- choose colors and apparences
- display a panel for the higher timeframe value

Multi-timeframe MomentumThe Multi-timeframe momentum indicator is similar in concept to a velocity indicator like rate-of-change, but visualizes smoothed price changes by applying an EMA and linear regression to price difference at every bar. Momentums from 1 minute to 1 quarter are plotted on a single chart using the request.security function. Standard and Fibonacci timeframes are available as well as the ability to hide high-timeframes to keep the chart clean. Like any oscillator, divergence in the momentums can be used to identify price reversals in conjunction with support and resistance. When linear regression is applied, high and low inflection points are used to identify reversals in a manner similar to MACD.
Much love to DumpCap! The script is presented sans secret sauce.

Leading MACD (Expo)Leading MACD (Expo) is designed to anticipate future price action, enabling traders to predict market movements ahead of time. The idea of a leading indicator is that traders can get in before the price move happens and ride the entire trend.
█ Moving average convergence divergence (MACD) is considered one of the most effective momentum and trend-following oscillators. However, the MACD is based on historical price action, making it a lagging indicator. A lagging indicator usually provides signals or insight once the price movement has passed or is in progress. That is why lagging indicators often are used to confirm a price trend or a move. On the other hand, the MACD histogram is more of a leading feature that can act as a sign of future trend changes.
█ The Leading MACD indicator takes all advantages of the traditional MACD and converts it into a fast-moving and leading oscillator that provides real-time insights about potential future price moves. As a result, it gives traders time to analyze a possible upcoming price move before it happens and be prepared for what's coming. However, the leading MACD should be combined with other forms of technical analysis to confirm potential entries and exits.
█ Leading vs. Lagging MACD
The leading MACD looks ahead and helps traders prepare for potential price moves. The traditional (lagging) MACD confirms price action that already has happened. A leading indicator reacts quicker to price changes, while a lagging indicator reacts slower. The different types of MACD have their own advantages and drawbacks, so make sure you understand the leading MACD and see if it fits in with your trading strategy.
█ HOW TO USE
Use the Leading MACD to get insights about potential price changes ahead of time. Get insights about whether a bullish or bearish move is strengthening or weakening. Other common ways are looking for divergences, finding trends, and measuring current momentum.
-----------------
Disclaimer
Copyright by Zeiierman.
The information contained in my Scripts/Indicators/Ideas/Algos/Systems does not constitute financial advice or a solicitation to buy or sell any securities of any type. I will not accept liability for any loss or damage, including without limitation any loss of profit, which may arise directly or indirectly from the use of or reliance on such information.
All investments involve risk, and the past performance of a security, industry, sector, market, financial product, trading strategy, backtest, or individual's trading does not guarantee future results or returns. Investors are fully responsible for any investment decisions they make. Such decisions should be based solely on an evaluation of their financial circumstances, investment objectives, risk tolerance, and liquidity needs.
My Scripts/Indicators/Ideas/Algos/Systems are only for educational purposes!
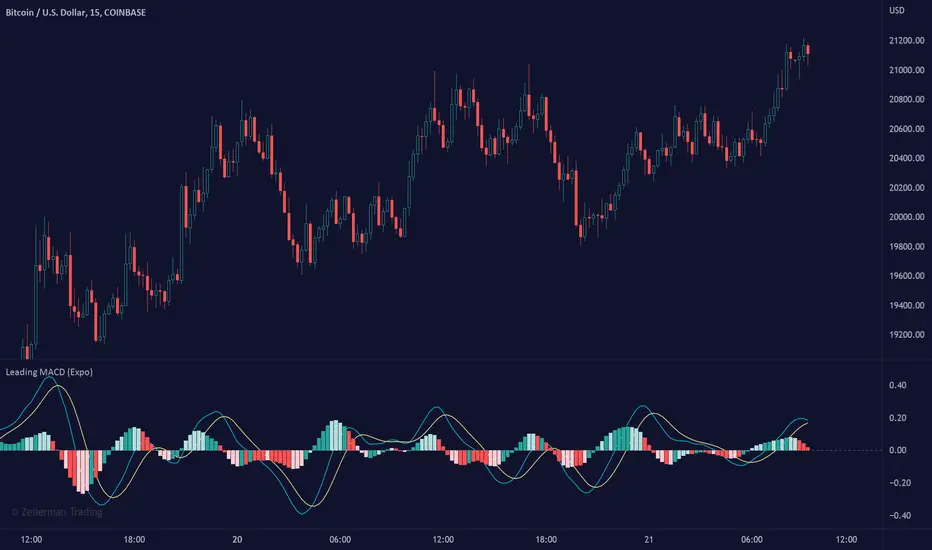
Momentum Scalping & Swing Signals With AlertsThis Momentum indicator shows a green or red ribbon when smoothed momentum is bullish or bearish. It also includes a long moving average for overall trend confirmation. Wait until the ribbon holds above or below the long moving average and take positions in that direction.
To get an easier to read momentum indicator, I smoothed the momentum out and paired it next to a short term RMA. These two together form the ribbon that will show you early reversals and trend direction. The long moving average is used as an overall trend detector and confirmation for longer term trends.
***HOW TO USE***
Scalping: Enter longs when the ribbon turns green and enter shorts when the ribbon turns red. Exit positions when the ribbon turns the opposite color or crosses the long moving average.
Swing Trading: When the ribbon holds above the long moving average or breaks out and retests it, look for long positions and exit when the ribbon turns red or crosses the long moving average. When the ribbon holds below the long moving average or breaks down and retests it, look for short positions and exit when the ribbon turns green or crosses the long moving average.
***DETAILS***
This indicator gives early reversal signals very well and waiting for the momentum ribbon to cross the long moving average helps to get you into positions when the market is ready to really move while filtering out some of the noise.
The ribbon and background will change to green or red depending on whether it is currently bullish or bearish.
There is also a label that changes colors and tells you if momentum is bullish or bearish and also whether the momentum ribbon is above or below the long moving average.
Green or red circles will appear on the indicator when there is a bullish or bearish cross of the momentum ribbon and the long moving average.
It includes alerts that trigger when momentum is turning bullish/bearish or when the momentum ribbon is crossing the long moving average.
***CUSTOMIZATION***
Each piece of this indicator can be customized to suit your preferences including the momentum source, length, smoothing length, short moving average length and long moving average length. You can also turn off the labels, signals and long moving average. All of these settings can be managed within the indicator settings input tab.
***MARKETS***
This indicator can be used as a signal on all markets, including stocks, crypto, futures and forex.
***TIMEFRAMES***
This Momentum Scalping & Swing Signals indicator can be used on all timeframes.
***TIPS***
Try using numerous indicators of ours on your chart so you can instantly see the bullish or bearish trend of multiple indicators in real time without having to analyze the data. Some of our favorites are Trend Friend Scalp & Swing Trade Signals, Volume Spike Scanner, Buy & Sell Pressure Volume Profile, and RSI Scalper in combination with this momentum indicator. They all have real time Bullish and Bearish labels as well so you can immediately understand each indicator's trend.

Fibonacci Zone Oscillator With MACD HistogramThe columns
After I found a way to calculate a price as a percent of the middle line of the KeltCOG Channel in the KCGmut indicator (published), I got the idea to use the same trick in the Fbonacci Zone Channel (also published), thus creating an oscillator.
I plot the percent’s as columns with the color of the KeltCOG Channel. Because the channels I created and published (i.e. Fibonacci Zone, Donchian Fibonacci Trading Tool, Keltner Fibzones, and KeltCOG) all use Fibonacci zones, this indicator also reports the position of the close in their zones.
Strategy and Use:
Blue column: Close in uptrend area, 4 supports, 0 resistance, ready to rally up.
Green column: Close in buyers area, 3 supports, 1 resistance, looking up.
Gray column: Close in center area 2 supports, 2 resistances, undecided.
Yellow column: Close in sellers area 1 support, 3 resistances, looking down.
Red column: Close in downtrend area, 0 support, 4 resistances, ready to rally down.
I use this indicator in a layout with three timeframes which I use for stock picking, I pick all stocks with a blue column in every timeframe, the indicator is so clear that I can flip through the 50 charts of my universe of high liquid European blue chips in 15 minutes to make a list of these stocks.
Because I use it in conjunction with KeltCOG I also gave it a ‘script sets lookback’ option which can be checked with a feedback label and switched off in the inputs.
The MACD histogram
I admire the MACD because it is spot on when predicting tops and bottoms. It is also the most sexy indictor in TA. Actually just the histogram is needed, so I don’t show the macd-line and the signal line. I use the same lookback for the slow-ma as for the columns, set the fast-ma to half and the signal-line to a third of the general lookback. Therefore I gave the lookback a minimum value of 6, so the signal gets at least a lookback of 2.
The histogram is plotted three times, first as a whitish area to provide a background, then the colums of the Fibzone Oscillator are plotted, then the histogram as a purple line, which contrasts nicely and then as a hardly visible brown histogram.
The input settings give the option to show columns and histogram separate or together.
Strategy and use:
I think about the columns as showing a ‘longer term chosen momentum’ and about the histogram as a ‘short term power momentum’. I use it as additional information.
Enjoy, Eykpunter.
Williams %R - SmoothedFrom TradingView's description:
Williams %R (%R) is a momentum-based oscillator used in technical analysis, primarily to identify overbought and oversold conditions. The %R is based on a comparison between the current close and the highest high for a user defined look back period. %R Oscillates between 0 and -100 (note the negative values) with readings closer to zero indicating more overbought conditions and readings closer to -100 indicating oversold. Typically %R can generate set ups based on overbought and oversold conditions as well overall changes in momentum.
What's special?
This indicator adds two additional EMA lines to the original Williams %R indicator. Default EMA lengths are 5 and 13. The result is 2 smoother average lines, which are easier to read.
This indicator includes:
- signals for EMA crosses. EMA crosses can help indicate confirmed trend changes. Default colors are green and red
- signals for trend reversals on the faster EMA line. Default colors are blue and orange
Alerts available for bullish/bearish crossovers and reversals.
Enjoy~~!
