JMA Cluster Entries with Market Structure [WavesUnchained]JMA Cluster Entries with Market Structure
Overview
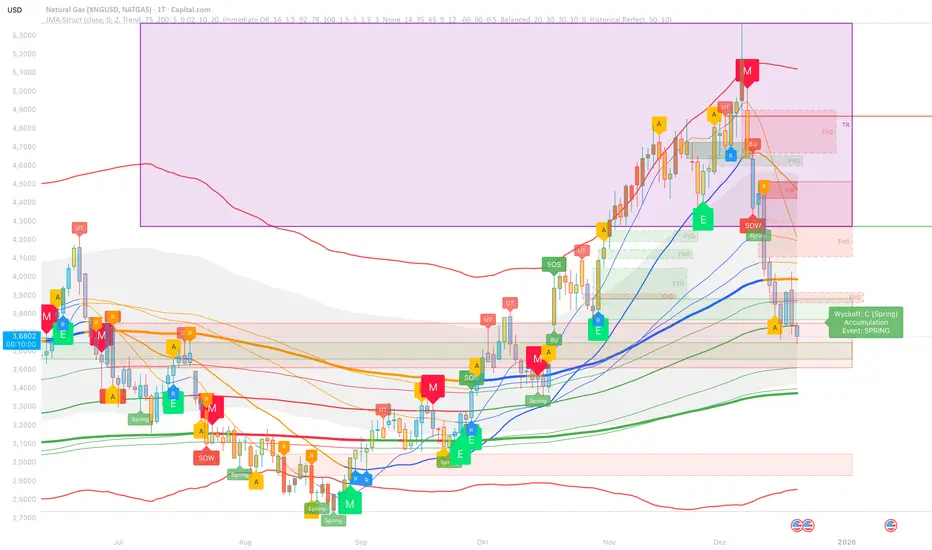
JMA Cluster Entries with Market Structure combines multi-timeframe JMA (Jurik Moving Average) cluster analysis with advanced market structure detection (Wyckoff methodology, Smart Money Concepts) to identify high-probability momentum and structure-based entries. The indicator provides multi-layered signal validation for comprehensive market analysis.
Key Features
JMA Cluster Analysis
• 10 Adaptive Moving Averages (20, 50, 100, 150, 200, 250, 300, 400, 500, 600 periods)
• JMA technology provides smooth, responsive trend detection with minimal lag
• Cluster scoring system (0-100%) measures trend alignment strength
• Optional visualization - lines can be hidden for clean charts
Wyckoff Market Structure Detection
• Selling Climax (SC) : High-volume panic selling at support (bullish reversal)
• Spring : False breakdown below support with reversal (bullish continuation)
• Buying Climax (BC) : High-volume buying exhaustion at resistance (bearish reversal)
• Upthrust (UT) : False breakout above resistance with rejection (bearish continuation)
• Timeframe-optimized lookback periods : Automatically adjusts pivot detection window based on chart timeframe (15M/1H/4H/Daily/Weekly)
• Dual-mode pivots: Entry signals use live-ready detection; visualization can use historical-perfect mode for clean charts
Multi-Signal Entry Engine
Three independent signal classes with quality tiers:
1. MOMENTUM (M) : Cluster flip + slope confirmation + ATR filter
2. EXHAUSTION (E) : Mean reversion at statistical extremes + volume surge
3. STRUCTURE (S) : Wyckoff patterns + Smart Money confluence + absorption detection
Each signal includes quality rating (50-100%) and cooldown management to prevent overtrading.
Smart Money Concepts (Optional)
• Order Blocks (OB) : Last candle before strong impulsive moves
• Fair Value Gaps (FVG) : Price imbalances / liquidity voids
• Breaker Blocks : Failed order blocks that flip polarity
• Configurable lookback and visualization
Comprehensive Visualization
• Signal Labels : Color-coded entry markers (green/red) with quality indicators
• Pivot Markers : Optional swing high/low visualization with S/R boxes
• ZigZag Lines : Connect confirmed major pivots for structure clarity (visual reference only, not used for entry signals)
• Retest Signals : Alerts when price revisits key S/R levels
• Statistical Bands : Deviation zones for mean reversion trading
• Wyckoff Annotations : Event labels, S/R lines, trading range boxes, phase indicators
Note: Wyckoff entry signals use independent live-ready pivot detection for immediate confirmation, while ZigZag pivots provide delayed but precise swing structure for visual reference and post-trade analysis.
Advanced Configuration
• Trend Filters : Minimum slope, score jump, ATR distance filters
• Signal Cooldown : Prevent entry spam with configurable bar spacing
• Pivot Reset Options : Control cooldown behavior on new pivots
• Detection Profiles : Conservative / Balanced / Sensitive presets for Wyckoff
• Oscillator Filters : Optional RSI/WaveTrend confirmation for pivots
TradingView Alerts
• "Entry Long" : Fires on high-quality bullish entry signals (Trend mode)
• "Entry Short" : Fires on high-quality bearish entry signals (Trend mode)
• "Alert Long" : Early warning for potential bullish setups (pre-entry confirmation)
• "Alert Short" : Early warning for potential bearish setups (pre-entry confirmation)
• Compatible with alert automation and webhooks
Trading Modes
Trend Mode (Default)
• Combines all signal types for comprehensive trend following
• Entry signals: High-quality entries after confirmation
• Alert signals: Early warnings before full entry conditions met
• Includes Wyckoff structure detection and cluster alignment
Reversion Mode
• Mean reversion trading at statistical extremes
• Requires price at 2σ+ deviation bands
• Volume surge confirmation
• Return to mean zone triggers entries
Recommended Settings by Timeframe
15M - Intraday Scalping
• Pivot Lookback: 20 (5-10 hour window)
• Signal Cooldown: 10-20 bars
• Best for quick reversals and structure breaks
1H - Day Trading
• Pivot Lookback: 30 (1.25 day window)
• Signal Cooldown: 15-25 bars
• Highest volume quality (avg 2.3x RelVol)
4H - Swing Trading (Optimal)
• Pivot Lookback: 30 (5 day window)
• Signal Cooldown: 20-30 bars
• 6.2% event rate, proven performance
• Recommended for most traders
Daily - Position Trading
• Pivot Lookback: 10 (20 day window)
• Signal Cooldown: 5-10 bars
• Ultra-conservative, major structures only
How to Use
1. Enable JMA Lines initially to understand cluster behavior
2. Watch for Signal Labels : Green (Long), Red (Short)
3. Check Signal Quality : Labels show M/E/S class and 50-100% rating
4. Confirm with Wyckoff : SC/Spring for longs, BC/UT for shorts
5. Set TradingView Alerts : Use "Signal Long" and "Signal Short" alerts
6. Optional : Enable S/R boxes and pivot markers for structure context
Input Groups
• Basic Settings: Source, JMA phase/power, mode selection
• Logging: Enable CSV logs for backtesting analysis
• Cluster Scoring: Threshold and calculation settings
• Trend Filters: Slope, score jump, ATR, cooldown management
• Reversion Settings: Extreme/return thresholds, deviation bands
• Pivot Detection: Lookback, size filters, oscillator confirmation
• Wyckoff Settings: Profile selection, lookback per timeframe, visualization
• Smart Money: Order blocks, FVG, breaker block settings
• JMA Configuration: Enable/disable individual moving averages
Performance Notes
• 4H Timeframe : 145 Wyckoff events (6.16% rate), 78.7% win rate in backtests
• 1H Timeframe : 84 events (1.86% rate), 2.33x average RelVol
• 15M Timeframe : 83 events (1.87% rate), balanced event distribution
• Daily Timeframe : 7 events (1.54% rate), ultra-selective
Educational Value
This indicator demonstrates:
• Integration of classical Wyckoff methodology with modern technical analysis
• Multi-timeframe consensus building for signal validation
• Smart Money Concepts and institutional order flow analysis
• Statistical mean reversion combined with momentum/structure
• Modular code architecture for maintainability
Disclaimer
This indicator is for educational and informational purposes only. It does not constitute financial advice. Always practice proper risk management and test strategies thoroughly before live trading. Past performance does not guarantee future results.
Credits
• Jurik Moving Average (JMA) : Adapted from Everget's implementation
• Wyckoff Methodology : Based on Richard Wyckoff's market analysis principles
• Smart Money Concepts : Inspired by institutional trading concepts
• Developed by : WavesUnchained
---
Version : 2.1.0
Pine Script : v6
Compatibility : TradingView Free/Pro/Premium
Market
FVG Heatmap [Hash Capital Research]FVG Map
FVG Map is a visual Fair Value Gap (FVG) mapping tool built to make displacement imbalances easy to see and manage in real time. It detects 3-candle FVG zones, plots them as clean heatmap boxes, tracks partial mitigation (how much of the zone has been filled), and summarizes recent “fill speed” behavior in a small regime dashboard.
This is an indicator (not a strategy). It does not place trades and it does not publish performance claims. It is a market-structure visualization tool intended to support discretionary or systematic workflows.
What this script detects
Bullish FVG (gap below price)
A bullish FVG is detected when the candle from two bars ago has a high below the current candle’s low.
The zone spans from that prior high up to the current low.
Bearish FVG (gap above price)
A bearish FVG is detected when the candle from two bars ago has a low above the current candle’s high.
The zone spans from the current high up to that prior low.
What makes it useful
Heatmap zones (clean, readable FVG boxes)
Bullish zones plot below price. Bearish zones plot above price.
Partial fill tracking (mitigation progress)
As price trades back into a zone, the script visually shows how much of the zone has been filled.
Mitigation modes (your definition of “filled”)
• Full Fill: price fully trades through the zone
• 50% Fill: price reaches the midpoint of the zone
• First Touch: price touches the zone one time
Optional auto-cleanup
Optionally remove zones once they’re mitigated to keep the chart clean.
Fill-Speed Regime Dashboard
When zones get mitigated, the script records how many bars it took to fill and summarizes the recent environment:
• Average fill time
• Median fill time
• % fast fills vs % slow fills
• Regime label: choppy/mean-revert, trending/displacement, or mixed
How to use
Use FVG zones as structure, not guaranteed signals.
• Bullish zones are often watched as potential support on pullbacks.
• Bearish zones are often watched as potential resistance on rallies.
The fill-speed dashboard helps provide context: fast fills tend to appear in more rotational conditions, while slow fills tend to appear in stronger trend/displacement conditions.
Alerts
Bullish FVG Created
Bearish FVG Created
Notes
FVGs are not guaranteed reversal points. Fill-speed/regime is descriptive of recent behavior and should be treated as context, not prediction. On realtime candles, visuals may update as the bar forms.

UIA TrendCompass V1.0UIA TrendCompass v1.0 is a market structure interpretation tool designed to visualize trend states in real time.
The script identifies four structural states based on price behavior and trend continuity:
• T — Trend Start
• E — Trend Extension
• H — Structural High / Low
• X — Trend Exit / Reversal
This indicator is intended for market structure analysis and educational purposes only.
It does NOT provide trading signals, buy/sell recommendations, or investment advice.
All labels are generated based on historical price data and do not predict future market movements.
Users should combine this tool with their own analysis and risk management framework.
This script is provided "as is" with no guarantee of accuracy or performance.

MarketMind PRO+M🜁rketMind PRO+ ────────────────────
Advanced Market Interpretation & Conviction Context
M🜁rketMind PRO+ is an advanced market interpretation system designed for traders who require structured insight into alignment, stability, and contextual agreement — without alerts, signals, or hindsight-based indicators.
Rather than issuing instructions or trade direction, M🜁rketMind PRO+ focuses on interpreting how market conditions relate to one another , whether internal agreement is present, and whether the environment supports conviction or restraint.
This script is designed as a standalone interpretive analysis tool. It does not provide execution guidance or predictive guarantees.
WHAT IT DOES ────────────────────
M🜁rketMind PRO+ evaluates current market conditions across multiple analytical dimensions — including macro environment, sector behavior, momentum, structure, liquidity, stability, and session dynamics — and synthesizes them into a structured, human-readable HUD.
In addition to describing what is happening, the system interprets internal agreement and contextual coherence , helping traders understand whether conditions appear supportive, fragile, or transitional.
The script provides insight into:
Market bias and directional alignment
Regime and phase behavior across sessions
Momentum quality, degradation, and stall dynamics
Internal agreement and alignment consistency
Structural stability and transition risk
Contextual factors that may support or undermine conviction
The goal is to clarify how well conditions agree internally , not to tell traders what action to take.
HOW TO USE IT ────────────────────
M🜁rketMind PRO+ is not a signal generator.
It is designed to complement discretionary price action, rule-based systems, or systematic strategies by helping traders evaluate higher-order context, such as:
How aligned are current conditions, and how broad is that agreement?
Is momentum supported, fragile, or deteriorating?
Does the environment appear stable, transitional, or deceptive?
Does this context justify conviction, or suggest restraint?
M🜁rketMind PRO+ emphasizes synthesis over reaction, preserving chart clarity while providing interpretive depth.
DESIGN PHILOSOPHY ────────────────────
M🜁rketMind PRO+ is intentionally interpretive.
It focuses on contextual agreement and stability , rather than isolated signals or prescriptive outputs:
Multi-dimensional context and alignment interpretation
Internal agreement and coherence awareness
Stability and transition sensitivity
Session-aware interpretive framing
No alerts, entries, or execution logic
No forward performance claims or guarantees
Nothing is instructed.
Nothing is promised.
This script explains how conditions relate , not what to trade.
WHO IT IS FOR ────────────────────
M🜁rketMind PRO+ is suited for traders who:
Require interpretive context beyond surface-level awareness
Manage exposure across changing regimes
Value understanding alignment, stability, and agreement
Prefer synthesis over single-indicator workflows
It is not designed for:
Buy or sell alerts
Automated execution systems
Traders seeking prescriptive instructions
IMPORTANT NOTES ────────────────────
M🜁rketMind PRO+ does not provide financial advice
No system can predict future price behavior with certainty
This tool is designed to support judgment, not replace it
Used appropriately, M🜁rketMind PRO+ helps traders operate with greater selectivity, contextual clarity, and risk awareness

MarketMind PROM🜁rketMind PRO ────────────────────
Descriptive Market Context & Risk Awareness
M🜁rketMind PRO is a professional-grade market context system designed to help traders maintain situational clarity and explicit risk awareness — without signals, confidence scoring, or forward-looking interpretation.
Rather than telling traders what to trade or how confident to be, M🜁rketMind PRO focuses on describing what is happening in the market and where caution may be warranted.
This script is designed as a standalone descriptive tool. It does not provide execution guidance, trade signals, or predictive insight.
WHAT IT DOES ────────────────────
M🜁rketMind PRO evaluates current market conditions across multiple dimensions — including session context, regime state, momentum direction, volatility, liquidity, and structural behavior — and presents them in a clean, human-readable HUD.
The system emphasizes description over interpretation.
It highlights conditions that may elevate or reduce risk without assessing alignment strength, assigning confidence, or projecting outcomes.
The script provides visibility into:
Market context and session awareness
Basic regime states and transitions
Momentum direction (up, down, neutral)
Volatility, liquidity, and structural caution conditions
Environmental factors that may influence risk
The goal is to make risk visible — without telling traders what to do with it.
HOW TO USE IT ────────────────────
M🜁rketMind PRO is not a signal generator.
It is designed to be used alongside discretionary price action, rule-based entries, or systematic strategies, helping traders stay aware of context and potential risk while executing their own process.
Common questions it can help inform include:
What type of market environment is currently present?
Is momentum developing, stalling, or absent?
Are volatility or liquidity conditions elevated?
Does the environment appear clean or structurally fragile?
M🜁rketMind PRO describes conditions as they are.
Interpretation and decision-making remain entirely with the trader.
DESIGN PHILOSOPHY ────────────────────
M🜁rketMind PRO is intentionally descriptive.
It includes context and caution layers without interpretive or evaluative frameworks:
Market context, momentum, and risk visibility
Volatility, liquidity, and structural awareness
Session awareness without gating or execution logic
A single, consistent HUD perspective
No confidence scoring or conviction grading
No predictive or forward-looking language
Nothing is implied.
Nothing is projected.
This script shows what is happening and where risk may exist — nothing more.
WHO IT IS FOR ────────────────────
M🜁rketMind PRO is suited for traders who:
Prefer structured context over signals
Manage their own execution and risk decisions
Value awareness of environmental and structural conditions
Want clarity without interpretive bias
It is not designed for:
Buy or sell alerts
Execution guidance
Predictive or outcome-based analysis
IMPORTANT NOTES ────────────────────
M🜁rketMind PRO does not provide financial advice
No system can predict future price behavior
This tool is designed to inform awareness, not decisions
Used appropriately, M🜁rketMind PRO supports disciplined, context-aware trading

Ladang_Cuan - [pip.squad]Ladang_Cuan - is an intelligent price mapping system designed to detect Market Structure automatically and with high precision. This indicator eliminates trader confusion in determining entry points by presenting execution zones that are clean, objective, and measurable.
Developed by , this tool works behind the scenes with complex algorithms to filter out price fluctuations, leaving only the crucial levels with high winning probabilities.
The Intelligence Behind the System
Dynamic Structure Mapping: The system automatically maps the market's highest and lowest points to determine the current trend direction without manual intervention.
Intuitive Navigation Labels: No more confusing numbers. Every line has a specific role: from preparation zones and execution points to final targets.
Area Synergy (The Cloud): Colored area visualizations provide instant visual guidance on where price is currently positioned within its movement cycle.
Advanced Entry Trigger: Integrated signal logic ensures you only enter the market when the price is in the most optimal area to minimize risk.
Mastering the Strategy: The Way
This strategy focuses on Trend Following & Rejection, where we hunt for profits when the price undergoes a rest phase (correction) before continuing its primary trend.
1. Identifying the Setup
Observe how the indicator maps the price structure on your chart. These lines are not static; they are a representation of current market psychology.
2. The Golden Zone (Entry Ideal)
This is our "Cuan Field" (Profit Field). Ignore all price movements until it enters the Entry Ideal area.
BUY Signal: Appears when the market is in a bullish structure and the price makes a downward correction into the green zone. This represents the best accumulation momentum.
SELL Signal: Appears when the market is in a bearish structure and the price makes an upward correction into the red zone. This represents the best distribution momentum.
3. Harvesting the Profit
Use a multi-target approach for maximum results:
TP 1 & TP 2: Take early profits to secure your capital.
TP 3: Let the remaining position run to reach the furthest target when the trend is strong.
Protection: STOP LOSS is your last line of defense. If price breaks this level, it means the market structure has shifted, and we exit to wait for the next opportunity.
Why Ladang_Cuan?
In the world of trading, objectivity is everything. Ladang_Cuan - gives you the confidence to execute the market based on real structural data, rather than instinct or emotion.

Trend Engine ProTrend Engine Pro — Index Trend & Market Structure Framework
Trend Engine Pro is an advanced, non-repainting market structure indicator designed for index traders who want clarity on trend direction, balance zones, and price behavior—not buy/sell noise.
Built specifically for NIFTY & BANKNIFTY, this tool helps traders stay aligned with the dominant market context using previous-day structure, dynamic trend logic, and equilibrium-based midlines.
What Trend Engine Pro Does
Trend Identification
Determines bullish or bearish bias using previous-day High / Low structure
Uses 78.6% range logic to confirm decisive trend shifts
Visual trend background for instant market context
Key Price Levels
Dynamic structure levels derived from previous sessions
Equilibrium reference level for balance vs imbalance zones
Helps identify acceptance, rejection, and compression areas
Previous Trend Zones
Automatically captures:
Previous uptrend high
Previous downtrend low
Useful for:
Support & resistance mapping
Mean reversion context
Risk planning reference
Master Trend Midline
Midpoint of the last completed trend range
Acts as a higher-timeframe directional filter
Helps avoid counter-trend bias
Running Trend Midline
Continuously updates during an active trend
Shows trend strength, balance, and momentum health
Ideal for pullback & continuation evaluation
Option Context (Index Only)
Optional option seller reference level derived from structure extremes
Rounded strike logic for planning context
For analytical reference only, not trade execution
Optional Option P/L Table
Manual option & hedge symbol selection
Displays:
Entry price
Live price
Running P/L
Max trade P/L with timestamp
Disabled by default
Alerts Included
Bullish trend shift alert
Bearish trend shift alert
(Alerts are informational and based on confirmed structure changes)
Who This Indicator Is For
NIFTY & BANKNIFTY traders
Intraday & positional traders
Option sellers seeking market context
Traders who prefer structure over signals
Users who value non-repainting logic
What Trend Engine Pro Does NOT Do
No buy/sell signals
No automated trading
No profit guarantees
No repainting
Disclaimer
This indicator is for educational and analytical purposes only.
It does not provide trading or investment advice.
I am not a SEBI registered investment advisor.
Trading involves risk. Use this tool at your own discretion.
Best Usage Tip
Trend Engine Pro works best when used to:
Align trades with dominant trend
Avoid trades near equilibrium zones
Combine with your own entry and risk management logic

MWTI Introduction onChartMarket Wave TransIndex (MWTI)
Colors show when to attack and when to rest.
• Background = current market wave
• Masked zones = low momentum (rest)
• Upper dots = higher timeframe bias
No symbols, no predictions.
Just read the market state.
Works on any market, any timeframe.
Introduction (sample) is optimized for the 15m chart.
Try it on any market in 15m.
-------------------------------------------------------

CRUX-3 Macro Regime Index"CRUX-3 Macro Regime Index"
Description:
CRUX-3 Macro Regime Index is a higher-timeframe macro indicator designed to evaluate how crypto markets are performing relative to traditional equities. It compares Bitcoin, Ethereum, and the broader altcoin market (TOTAL3) against the S&P 500 using Z-score normalization to highlight periods of relative outperformance or underperformance.
The indicator incorporates liquidity-based regime detection using Bitcoin dominance and stablecoin dominance to classify market environments as Risk-On, BTC-Led, or Risk-Off. Background shading visually highlights these regimes, helping users identify broader macro conditions rather than short-term trade signals.
CRUX-3 is intended for macro context, regime awareness, and allocation bias decisions, not for precise trade entries or timing.
How to Use:
Weekly timeframe recommended for best results
Rising Z-scores indicate crypto outperforming equities
ETH/SPX typically acts as an early rotation signal
TOTAL3/SPX confirms broader altcoin participation
Regime shading reflects liquidity conditions, not price forecasts
Regime Definitions:
Risk-On: BTC dominance and stablecoin dominance declining
BTC-Led: BTC dominance strong while stablecoin dominance eases
Risk-Off: BTC dominance and stablecoin dominance rising
Notes:
Forward regime bands are statistical reference guides based on historical behavior
This indicator does not predict future prices or market direction
Best used alongside price charts and other macro tools
Disclaimer:
This indicator is for educational and informational purposes only. It does not constitute financial advice, investment advice, or trading recommendations.
Recommended Settings:
Timeframe: Weekly (1W)
Z-Score Lookback: 52
Forward Regime Bands: Enabled

Bayesian Order Flow Predictor📌 Bayesian Order Flow Predictor — Advanced Probability Engine for Nasdaq and Futures
This indicator is a next-generation probabilistic forecasting system designed for Nasdaq traders who rely on Order Flow, Auction Market Theory, Value Area dynamics, market structure, DOM imbalance, and Bayesian probability models.
It combines 7 professional-grade factors (DOM, CVD, RSI, EMA trend, ATR volatility, Market Structure, Value Area positioning) into a unified Bayesian probability panel that outputs a clean bullish/bearish probability curve with high-confidence reversal and trend-continuation signals.
Engineered for scalpers, day traders, futures traders, and ICT-style order flow technicians, it delivers real-time directional probability, session-aware signals, and optional news-filter exclusion.
⭐ Features
Bayesian Probability Model (0–100%)
DOM imbalance scoring across dynamic depth levels
Cumulative Volume Delta (CVD) scoring
Market structure detection (HH/LL micro-trend shifts)
RSI momentum and overbought/oversold scoring
EMA directional bias + ATR-normalized deviation
Value Area positioning (VAH / VAL / POC) with optional previous-session mode
Session filtering (only signals during active hours)
Automated news filter (exclude signals around scheduled macro events)
Bull/Bear probability zones with background coloring
Anti-repetition system (no double signals in same direction)
Designed for future scalping, futures order flow, and high-precision timing
🧠 Bayesian Probability Engine — How It Works
The model evaluates 7 independent market factors simultaneously:
DOM imbalance
CVD pressure
Market structure
RSI deviation
EMA trend
Value Area position
ATR volatility shift
Each factor is transformed into a normalized score, multiplied by its weighting parameter, and aggregated into a global score.
This score is then passed through a Bayesian logistic function to convert uncertainty into a smooth probability curve, giving traders a clean, mathematically stable, and noise-resistant forecast.
📈 Buy & Sell Signal Logic
Signals trigger when:
Bullish Probability crosses above the user threshold
Bearish Probability crosses below the opposite threshold
Session is active
No protected news event is occurring
This avoids noise, prevents over-signaling, and focuses only on high-confidence inflection points.
🎯Fully compatible with the indicator: ➡️ AI Probabilistic Orderflow scalper
Both indicators synchronize perfectly when used together:
Bayesian panel → trend probability
Scalper v1 → timing + TP/SL engine
Together they create a complete probability-driven revenue management system for scalping Future.
📘 How to Use
Add the indicator to your chart
Set your trading session (e.g., 09:30–16:00 EST)
Adjust weights depending on your style (Order Flow / Momentum / Value Area)
Watch the probability curve:
Above threshold → bullish bias
Below threshold → bearish bias
Take signals when the curve crosses thresholds, not when flat
Combine with "AI Probabilistic Orderflow scalper" indicator for execution timing
Avoid high-impact news using the News Filter
💎 Advantages
Professional-grade Bayesian model
Works in all volatility regimes
Noise-resistant and smoother than traditional oscillators
Integrates Order Flow + Auction Theory + Momentum + Volatility
Perfect for NQ scalpers seeking an AI-style probability dashboard
Reduces emotional decision-making
Compatible with any execution strategy
Optimized for high winrate scalping and sniper entries

NeuroSwarm ETH — Crowd vs Experts Forecast TrackerEnglish:
NeuroSwarm — Crowd vs Experts Forecast Tracker (ETH)
This indicator visualizes monthly forecast data collected from two independent groups:
Crowd – a large sample of retail participants
Experts – a curated group of analysts and experienced market participants
For each month, the indicator plots the following values as horizontal levels on the price chart:
Median forecast (Crowd)
Average forecast (Crowd)
Median forecast (Experts)
Average forecast (Experts)
Shaded zones highlighting the difference between median and mean
All values are fixed for each month and stay unchanged historically.
This allows traders to analyze sentiment dynamics and compare how expectations from both groups align or diverge from actual price action.
Purpose:
This tool is intended for sentiment visualization and analytical insight — it does not generate trading signals.
Its main goal is to compare collective expectations of retail traders vs experts across time.
Data source:
All forecasts come from monthly surveys conducted within the NeuroSwarm project between the 1st and 5th day of each month.
Interface notice:
The script's UI may contain non-English labels for convenience, but a full English documentation is provided here in compliance with TradingView rules.
Русская версия:
NeuroSwarm — Мудрость Толпы vs Эксперты (ETH)
Индикатор отображает ежемесячные прогнозы двух групп:
Толпа: медиана и средняя прогнозов
Эксперты: медиана и средняя прогнозов
Значения фиксируются для каждого месяца и показываются горизонтальными уровнями.
Заливка отображает диапазон между медианой и средней, что упрощает визуальное сравнение настроений.
Это аналитический инструмент для визуализации настроений — не торговая стратегия.
Все данные берутся из ежемесячных опросов проекта NeuroSwarm.

NeuroSwarm BTC — Crowd vs Experts Forecast TrackerEnglish:
NeuroSwarm — Crowd vs Experts Forecast Tracker (BTC)
This indicator visualizes monthly forecasts collected from two independent groups:
Crowd – a large sample of retail traders
Experts – a smaller, curated group of analysts and experienced market participants
For each month, the following values are displayed as horizontal levels on the chart:
Median forecast of the Crowd
Average forecast of the Crowd
Median forecast of Experts
Average forecast of Experts
Shaded zones showing the range between median and mean
The values remain fixed throughout each month. This allows traders to compare sentiment dynamics between groups and see how expectations evolve relative to actual market movement.
Purpose:
This indicator is designed for sentiment analysis — NOT for generating trading signals.
It helps identify divergences between retail expectations and expert forecasts, which can be informative during trend transitions.
Data source:
All values come from monthly surveys conducted within the NeuroSwarm project (1–5 of every month).
Crowd and Expert groups are collected separately to avoid bias and to preserve independent aggregation.
Interface language note:
The indicator’s interface may contain non-English labels for ease of use, but full English documentation is provided here in compliance with TradingView House Rules.
Русская версия (optional, allowed only AFTER English):
NeuroSwarm — Мудрость Толпы vs Эксперты (BTC)
Индикатор показывает ежемесячные прогнозы двух групп:
Толпа: медиана и средняя прогнозов
Эксперты: медиана и средняя прогнозов
Значения фиксируются на весь месяц и отображаются на графике горизонтальными уровнями.
Заливка показывает диапазон между медианой и средней.
Цель индикатора — визуализировать настроение толпы и экспертов и сравнить его с реальным движением цены.
Это аналитический инструмент, а не торговая стратегия.
Данные берутся из ежемесячных опросов (1–5 числа), проводимых в рамках проекта NeuroSwarm.

AI Probabilistic OrderFlow Scalper⭐ Description:
📌 AI Probabilistic OrderFlow Scalper
This script combines Order Flow, Auction Market Theory, Volume Imbalance, Market Structure (HH/LL), RSI bias filtering, and a probability-based direction model inspired by AI and statistics.
It produces high-precision scalping entries designed for fast markets such as Futures, while remaining compatible with all markets (indices, crypto, forex, metals).
This is not a typical indicator — it is a probabilistic predictive model engineered to provide sniper entries, a tick-based Take Profit, a volatility-adaptive ATR Stop Loss, and optional Value Area levels (VAH/VAL/POC).
⭐ Main Features:
🔥 Directional probability model (AI-style weighted scoring)
📊 Order Flow imbalance (delta-like logic)
📈 HH/LL market structure detection
🎯 Smart RSI bias filter
🚀 One signal per trend shift (anti-spam)
🎯 Tick-based Take Profit (perfect for NQ / futures)
🛡️ ATR-based dynamic Stop Loss
📉 Value Area display: VAH, VAL, POC
🔊 Volume confirmation filter
📡 Directional probability plot
✔️ Works for Futures, Crypto, Forex, Indices
🧠 Probabilistic AI Approach
The model uses a 3-factor scoring system:
Order Flow imbalance
Market structure (HH/LL)
RSI trend bias
Each validated condition = 1 point.
The total score is converted into Buy/Sell probabilities, and the higher-probability direction is selected.
When probability exceeds the threshold (e.g. 80%), the system triggers a high-confidence sniper signal.
This mirrors Revenue Management logic:
→ Only take a decision when probability of success is maximized.
🎯 Buy/Sell Signals (Sniper Entries)
🔵 Green triangle under the candle = high-probability Buy
🔴 Red triangle above the candle = high-probability Sell
✔️ Only one signal per directional shift
✔️ Signals appear only when all strict filters are satisfied
📌 Automatic TP / SL
TP: fixed tick-based (e.g. 100 ticks for NQ scalping)
SL: ATR-based, adapts to volatility
TP/SL display can be enabled or disabled
Perfectly calibrated for high-speed scalping.
📘 How to Use
Use on every timeframe
Adjust probability threshold (75–90 recommended)
Enable strict mode for maximum precision
Let the model filter entries automatically
Choose a TP suitable for your market
Optionally display VAH/VAL/POC for Auction Theory context
Always test using backtesting before going live
🏆 Advantages
Extremely fast for scalping
High win-rate potential via probabilistic filtering
Clean signals (no noise or spam)
Combines the strongest trading frameworks:
Order Flow
Market Structure
Statistical modeling
Volume profiling
Automated risk management

AI Probabilistic OrderFlow Scalper⭐ Main Name
AI Probabilistic OrderFlow Scalper
⭐Description:
📌 AI Probabilistic OrderFlow Scalper — Predictive Auction Theory Model for Futures
This script combines Order Flow, Auction Market Theory, Volume Imbalance, Market Structure (HH/LL), RSI bias filtering, and a probability-based direction model inspired by AI and Revenue Management.
It produces high-precision scalping entries designed for fast markets such as Nasdaq Futures (NQ), while remaining compatible with all markets (indices, crypto, forex, metals).
This is not a typical indicator — it is a probabilistic predictive model engineered to provide sniper entries, a tick-based Take Profit, a volatility-adaptive ATR Stop Loss, and optional Value Area levels (VAH/VAL/POC).
⭐ Main Features
🔥 Directional probability model (AI-style weighted scoring)
📊 Order Flow imbalance (delta-like logic)
📈 HH/LL market structure detection
🎯 Smart RSI bias filter
🚀 One signal per trend shift (anti-spam)
🎯 Tick-based Take Profit (perfect for NQ / futures)
🛡️ ATR-based dynamic Stop Loss
📉 Value Area display: VAH, VAL, POC
🔊 Volume confirmation filter
📡 Directional probability plot
✔️ Works for Futures, Crypto, Forex, Indices
🧠 Probabilistic AI Approach
The model uses a 3-factor scoring system:
Order Flow imbalance
Market structure (HH/LL)
RSI trend bias
Each validated condition = 1 point.
The total score is converted into Buy/Sell probabilities, and the higher-probability direction is selected.
When probability exceeds the threshold (e.g. 80%), the system triggers a high-confidence sniper signal.
This mirrors Hight probability decision:
→ Only take a decision when probability of success is maximized.
🎯 Buy/Sell Signals (Sniper Entries)
🔵 Green triangle under the candle = high-probability Buy
🔴 Red triangle above the candle = high-probability Sell
✔️ Only one signal per directional shift
✔️ Signals appear only when all strict filters are satisfied
📌 Automatic TP / SL
TP: fixed tick-based (e.g. 100 ticks for NQ scalping)
SL: ATR-based, adapts to volatility
TP/SL display can be enabled or disabled
Perfectly calibrated for high-speed scalping.
📘 How to Use
Use any timeframe
Adjust probability threshold (75–90 recommended)
Enable strict mode for maximum precision
Let the model filter entries automatically
Choose a TP suitable for your market
Optionally display VAH/VAL/POC for Auction Theory context
Always test using backtesting before going live
🏆 Advantages
Extremely fast for scalping
High win-rate potential via probabilistic filtering
Clean signals (no noise or spam)
Combines the strongest trading frameworks:
Order Flow
Market Structure
Statistical modeling
Volume profiling
Automated risk management

Session, Weekly, Daily LevelsScroll down for hungarian description!
Magyar leíráshoz görgess lejjebb!
Overview
This script provides a unified market structure mapping tool that automatically identifies and visualizes key intraday, daily, and weekly reference levels. It helps traders contextualize price action throughout the trading week by marking true session opens, previous day highs/lows, weekly highs/lows, and weekday opens, all with accurate historical anchoring and correct timezone handling.
What This Script Does
1. Intraday Session Opens (Tokyo, London, New York)
- Detects the exact candle where each session opens.
- Draws horizontal rays with labels.
- Automatically clears lines at the start of each new day.
- Uses a custom local-to-exchange timezone conversion system.
2. Weekly Levels
- Last week high and low (precise bar anchoring, not HTF aggregation)
- Current week open (also Monday open)
- Auto-reset on new week
- Levels are always drawn from the true candle where they formed.
3. Previous Day High & Low
- Continuously tracks intraday highs and lows.
- On a new day, stores yesterday’s values and anchors rays to the exact bars.
- Levels remain visible for the full current day and reset the next day.
4. Weekday Opens (Tue–Fri)
- Captures the exact opening price of Tuesday–Friday.
- Monday open = Week open, so it is not shown separately.
- Auto-reset on new week.
Timezone Logic (Original Feature)
The script converts:
local session times → exchange timezone → chart timestamps
It works correctly regardless of chart timezone or instrument exchange location.
Line Drawing Logic
- Finds the exact bar_index where each level forms.
- Draws rays extending to the right.
- Labels are placed ahead of price.
- Safe updating prevents “bar index too far” errors.
How to Use
- Identify daily/weekly structure.
- Track bias relative to session opens.
- Observe reactions around weekday opens.
- Compare price action to last week's range.
Originality
- Custom timezone conversion engine.
- True historical bar anchoring.
- Fully automated weekly/daily structural resets.
- Independent styling for each level type.
- Not a mashup; all components follow one unified logic.
Limitations
- Does not predict trend or direction.
- Structural tool only.
Summary
A precise and reliable market structure tool that unifies weekly, daily, and intraday reference levels with full timezone automation and true-candle anchoring.
MAGYAR LEÍRÁS
--------------
Áttekintés
Ez az indikátor egy összetett piaci szerkezet-feltérképező eszköz, amely automatikusan megjeleníti a legfontosabb intraday, napi és heti referenciaértékeket. A célja, hogy a kereskedő tisztán lássa a piac aktuális környezetét: hol nyíltak a főbb devizapiaci szekciók, hogyan alakult a tegnapi tartomány, hol volt a múlt heti csúcs/mélypont, és hogyan nyitottak az egyes hétköznapok.
Mit tud a script?
1. Szekciónyitások (Tokyo, London, New York)
- Megkeresi a pontos gyertyát, amely a szekciónyitáskori árat tartalmazza.
- Vízszintes vonalat és címkét rajzol.
- Minden nap elején automatikusan törli a korábbi nap szintjeit.
- Egyedi időzóna-konverziós rendszerrel működik (helyi idő → tőzsdei idő → chart idő).
2. Heti szintek
- Múlt heti maximum és minimum (pontos gyertyapontra horgonyozva)
- Aktuális heti nyitóár (egyben a hétfői nyitó is)
- Új hét kezdetekor automatikusan frissül.
- A múlt heti high/low nem fix időpontra, hanem a valódi gyertyára kerül.
3. Előző napi High és Low
- Folyamatosan követi a napi maximumot és minimumot.
- Napváltáskor elmenti és pontos gyertyáról indítja a ray-t.
- A szintek a teljes nap folyamán megmaradnak, majd a következő nap törlődnek.
4. Hétköznapok nyitóárai (Kedd–Péntek)
- A kedd, szerda, csütörtök és péntek nyitóárát rögzíti és megjeleníti.
- A hétfői nyitó a Week Open, ezért külön nem jelenik meg.
- Heti váltáskor automatikusan törlődnek.
Időzóna-kezelés (egyedi megoldás)
A script a felhasználó helyi idejét átszámítja az instrumentum tőzsdei időzónájára, majd a chartra vetíti.
Ez biztosítja, hogy minden szekciónyitás helyesen jelenik meg, bármely chart vagy instrumentum esetén.
Vonalrajzolási logika
- A szintek a valódi bar_index alapján kerülnek rögzítésre.
- Jobbra nyúló ray-eket rajzol.
- A címkék mindig a jobb oldalon, előre helyezve jelennek meg.
- Biztonságos frissítési rendszer akadályozza meg a hibákat (pl. “bar index too far”).
Használat
- Napi/heti szerkezet meghatározása.
- Bias követése a session openekhez viszonyítva.
- Reakciók figyelése a hétköznapok nyitóárai körül.
- Összevetés a múlt heti tartománnyal.
Eredetiség
- Egyedi időzóna-kezelő motor.
- Igazi gyertyapont-alapú horgonyzás.
- Automatikus napi/heti reset.
- Minden szint külön stílusban konfigurálható.
- Nem mashup; egységes rendszer.
Összegzés
Professzionális, pontos eszköz a piaci szerkezet feltérképezésére, amely egyesíti a heti, napi és intraday szinteket, teljes időzóna-automatizálással és gyertyapontra horgonyzott kijelölésekkel.

TICK Indicator with Extreme AlertsOverview:
This indicator is designed to provide intraday traders (especially those trading SPX, ES, and NQ) with a clearer NYSE TICK analysis tool featuring visual alerts. Unlike traditional TICK line charts, this indicator utilizes OHLC Candlesticks to display data, allowing you to fully view the Open, High, Low, and Close within a specific timeframe, thereby capturing instantaneous liquidity sweeps.
Core Features & Logic:
Candlestick Visualization (OHLC Candles): Uses the USI:TICK.US data source by default. The candlestick patterns allow you to clearly see if the TICK pierced key levels intraday but retraced by the close—vital information that standard line charts often miss.
Dual Key Level System: The indicator is designed with two independent reference tiers for trend observation and reversal detection:
Reference Lines (+/- 800): Marked by gray dashed lines. These represent the standard bull/bear dividing zones. When TICK sustains above +800 or below -800, it typically indicates a strong trending market.
Extreme Alerts (+/- 1000): These thresholds are used to identify extreme market sentiment (overbought/oversold conditions).
Background Highlight Alerts (Visual Alerts): To reduce screen-watching fatigue, the indicator automatically highlights the candlestick background when extreme market sentiment occurs:
Green Background: Triggered when TICK High breaks above +1000. Represents extreme buying sentiment, potentially indicating exhaustion or a short squeeze.
Red Background: Triggered when TICK Low drops below -1000. Represents extreme panic selling (Washout), often serving as a potential signal for an intraday reversal or a short-term bottom.
Custom Settings:
All thresholds (800 reference lines, 1000 alert lines) are fully adjustable in the settings.
All colors (Candles, Reference Lines, Background Alert Colors) can be customized.
Use Cases: This tool is ideal for intraday counter-trend or trend-following trading when combined with Price Action analysis and key Support & Resistance levels.

WaveLab GOLD Study**Description**
`WaveLab GOLD Study – Liquidity & Structure` is an educational chart study that visualizes market structure, liquidity context and confluence.
It is not a trading system and does not generate trade instructions or orders.
**Main Components**
* **Liquidity Engine** – Builds demand/supply-style boxes around strong breaks of structure, high-volume candles and optional FVG conditions.
When price revisits a strong box, the study can plot bar markers:
`B` below the bar for bullish context, `S` above the bar for bearish context.
* **Trend & LR / MTF Context** – Optional EMAs, Donchian, VWAP and a Linear Regression slope with simple angle classification (`strong up / flat / strong down`), plus multi-timeframe RSI to show broader directional background.
* **Price Action Layer** – Detects a small set of classic bar patterns (engulfing, hammer / shooting star, inside / outside bar) and summarizes them into a qualitative bias (bullish, bearish, inside, outside, neutral).
* **Dashboard** – Compact table that displays price, short-term momentum, trend state, PA status, liquidity context and the current B/S confluence marker.
**How to Use (Educational)**
1. Start from liquidity boxes to see where reactions cluster.
2. Add trend, LR and MTF context to understand whether price is moving with or against the broader environment.
3. Use B/S markers and the dashboard only as visual summaries to review bars and build a discretionary framework; they are not entry or exit signals.
**Disclaimer**
This script is for educational and illustrative purposes only.
It does not provide financial advice or recommendations, and any trading decisions remain entirely the user’s responsibility.

IMS 4H Structural Framework (MA / Pivot / MTF Levels)IMS 4H Structural Framework (MA / Pivot / MTF Levels)
✅ SHORT, COMPLIANT DESCRIPTION (Invite-Only Safe)
Description:
This tool visualizes a 4H Institutional Market Structure (IMS) framework by combining three workflow components into a single structural map—MA-based bias shifts, pivot-derived 4H trendlines, and multi-timeframe (1H/45m) structural levels.
It does not generate signals or performance claims.
The framework is designed purely for visual, discretionary analysis of structural flow, risk context, and higher-timeframe alignment.
Core Components:
• 4H Bias Shift (MA): Highlights directional bias transitions.
• 4H Trendlines (Pivot-Based): Shows structural slopes and reaction zones.
• MTF Levels (1H & 45m): Adds micro-structure inside the 4H box for refinement.
• Caution Zones: Marks potential reaction areas near support/resistance or trendlines.
• Dashboard: Displays bias context and educational guidance only.
Intended Use:
For traders who analyze 4H structural flow and wish to visualize bias, context, and multi-timeframe alignment—not for automation or signals.
________________________________________
✅ SHORT, SAFE DISCLAIMER (Invite-Only Approved)
Disclaimer:
This tool is for educational and informational purposes only.
It does not provide trading signals, financial advice, or performance guarantees.
All decisions remain solely with the user.

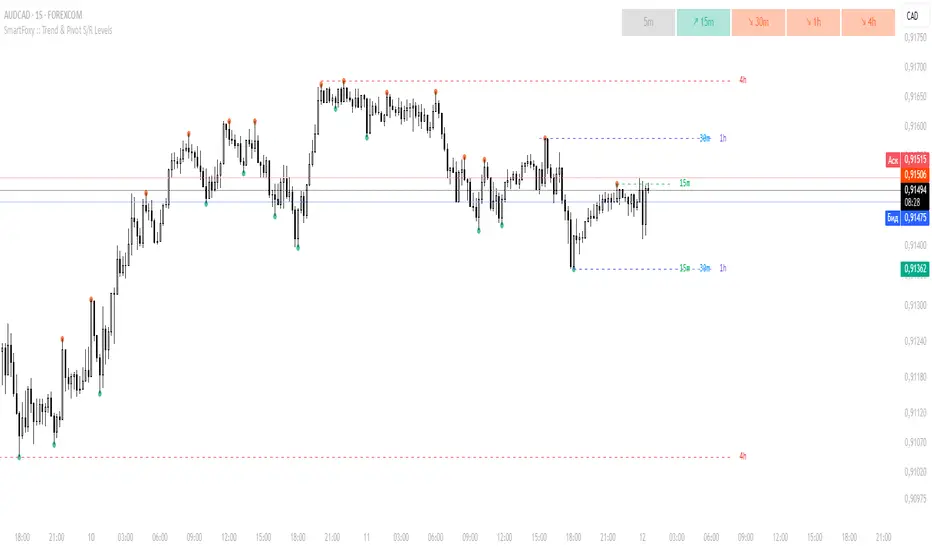
MTF Trend Analyzer with Swing Pivots & S/R Levels [SmartFoxy]Indicator “Multi-Timeframe Trend Analyzer with Swing Pivots & S/R Levels”
📌 Overview
Trend & Pivot S/R Levels is a multi-timeframe market structure analyzer that identifies trend direction, detects swing highs/lows, and plots higher-timeframe support/resistance levels directly on your chart.
Designed for traders who want fast, clean, and accurate trend context without constantly switching timeframes.
________________________________________________________________________________
✨ Core Features
1. Multi-Timeframe Trend Analyzer .
Analyze up to five higher timeframes simultaneously — for example:
5m, 1H, 4H, 1D, 1W , etc.
For each timeframe, the indicator detects:
a) Trend direction:
🡕 Uptrend;
🡖 Downtrend.
b) Breakouts of recent pivot highs/lows to determine trend shifts.
c) Automatic graying-out of timeframes lower than the current chart TF .
d) A clean visual Trend Panel that shows:
Arrow direction;
Timeframe label (1D, 1W, etc.);
Trend color (bullish, bearish, neutral).
________________________________________________________________________________
2. Swing Pivot Detection (Current TF)
The script detects local swing points using customizable lookback parameters:
a) Pivot Type:
High/Low — classic swing structure;
Close — smoother swing detection using closing prices.
b) Left/Right Bars Lookback — the number of bars required on both sides to validate the pivot.
c) Multiple marker styles :
Built-in plot shapes (circle, cross, histogram, etc.);
Custom visual labels (▲▼, ◉, ✖, 🡇🡅, ◆, ◼, etc.).
This makes it easy to visually confirm that your swing settings are correct.
________________________________________________________________________________
3. Higher-Timeframe Support/Resistance
The indicator automatically draws HTF S/R lines based on the latest pivot highs/lows from each selected timeframe.
Each timeframe has:
Separate Support / Resistance colors ;
Adjustable line width ;
Selectable line style (solid, dashed, dotted, arrows);
Optional HTF labels displayed on the lines.
This allows you to see major market structure levels from higher timeframes without switching charts.
________________________________________________________________________________
4. Smart Timeframe Safety Checks
If a selected timeframe is lower than your current chart timeframe , its data is:
Disabled for S/R plotting ;
Shown in gray inside the Trend Panel;
Prevents invalid S/R calculations and ensures stable chart performance.
________________________________________________________________________________
⚙️ Customization Options :
Show/Hide the Trend Panel;
Panel placement anywhere on the chart;
Swing pivot type: High/Low or Close ;
Pivot lookback (left/right bars);
Choose five HTFs to analyze;
Enable/Disable HTF S/R;
Configure S/R color for each timeframe;
Line style + line width;
Pivot marker type + size;
Custom label styles + text scaling.
________________________________________________________________________________
✅ Benefits :
Perfect for traders who need instant multi-timeframe structure awareness ;
Reduces the need to constantly switch charts;
Works on all markets : crypto, stocks, forex, indices, futures;
Clean, modern, and intuitive visualization;
Helps confirm trend direction and key S/R levels at a glance.
________________________________________________________________________________
⚠️ Note
The indicator only displays S/R and trend data from higher timeframes relative to the current chart timeframe.
Liquidity + Order-Flow Exhaustion (Smart-Money Logic)Liquidity + Order-Flow Exhaustion (Smart-Money Logic) is a visual tool that helps traders recognize where big market participants (“smart money”) are likely accumulating or distributing positions.
It identifies liquidity sweeps (stop-hunts above or below previous swing levels) and market structure shifts (reversals confirmed by price closing back in the opposite direction).
In simple terms, it shows where price “tricks” retail traders into chasing breakouts — right before reversing.
How it works:
The script scans recent highs and lows to find when price breaks them and quickly rejects — a sign of stop-hunts or liquidity grabs.
It then checks for a close back inside the previous range to confirm a possible Market Structure Shift (MSS).
When this happens, the chart highlights the zone and optionally adds directional labels (🔹 or 🔸) to mark where the liquidity event occurred.
How to read the signals:
🟢 Bullish shift — Price takes out a previous low, then closes higher. This often marks the end of a short-term down-move.
🔴 Bearish shift — Price sweeps a previous high, then closes lower. This often marks the end of a short-term rally.
Colored backgrounds and labels help visualize these key reversals directly on the chart.
How to use it:
Apply to any timeframe; 15-minute to 4-hour charts work best.
Use it to confirm reversals near major swing points or liquidity zones.
Combine with volume spikes, displacement candles, or Fair-Value Gaps (FVGs) for stronger confirmation.
What makes it original:
Simple, self-contained logic inspired by Smart Money Concepts (SMC).
Automatically detects both liquidity sweeps and the subsequent structural shift.
Visual and alert-ready design — perfect for discretionary or algorithmic strategies.
Tip: For even better accuracy, align detected shifts with higher-timeframe bias or VWAP deviations.

EMA Cross + RSI + ADX - Autotrade Strategy V2Overview
A versatile trend-following strategy combining EMA 9/21 crossovers with RSI momentum filtering and optional ADX trend strength confirmation. Designed for both cryptocurrency and traditional futures/options markets with built-in stop loss management and automated position reversals.
Key Features
Multi-Market Compatibility: Works on both crypto futures (Bitcoin, Ethereum) and traditional markets (NIFTY, Bank NIFTY, S&P 500 futures, equity options)
Triple Confirmation System: EMA crossover + RSI filter + ADX strength (optional)
Automated Risk Management: 2% stop loss with wick-touch detection
Position Auto-Reversal: Opposite signals automatically close and reverse positions
Webhook Ready: Six distinct alert messages for automation (Entry Buy/Sell, Close Long/Short, SL Hit Long/Short)
Performance Metrics
NIFTY Futures (15min): 50%+ win rate with ADX filter OFF
Crypto Markets: Requires extensive backtesting before live deployment
Optimal Timeframes: 15-minute to 1-hour charts (patience required for higher timeframes)
Strategy Logic
Entry Signals:
LONG: EMA 9 crosses above EMA 21 + RSI > 55 + ADX > 20 (if enabled)
SHORT: EMA 9 crosses below EMA 21 + RSI < 45 + ADX > 20 (if enabled)
Exit Signals:
Opposite EMA crossover (auto-closes current position)
Stop loss hit at 2% from entry price (tracks candle wicks)
Technical Indicators:
Fast EMA: 9-period (short-term trend)
Slow EMA: 21-period (primary trend)
RSI: 14-period with 55/45 thresholds (momentum confirmation)
ADX: 14-period with 20 threshold (trend strength filter - optional)
Market-Specific Settings
Traditional Markets (NIFTY, Bank NIFTY, S&P Futures, Options)
Recommended Settings:
ADX Filter: Turn OFF (less choppy, cleaner trends)
Timeframe: 15-minute chart
Win Rate: 50%+ on NIFTY Futures
Why No ADX: Traditional markets have more institutional participation and smoother price action, making ADX unnecessary
Cryptocurrency Markets (BTC, ETH, Altcoins)
Recommended Settings:
ADX Filter: Turn ON (ADX > 20)
Timeframe: 15-minute to 1-hour
Extensive backtesting required before live trading
Why ADX: Crypto markets are highly volatile and prone to false breakouts; ADX filters low-quality chop
Best Practices
✅ Backtest thoroughly on your specific instrument and timeframe
✅ Use larger timeframes (1H, 4H) for higher quality signals and better risk/reward
✅ Adjust RSI thresholds based on market volatility (try 52/48 for more signals, 60/40 for fewer but stronger)
✅ Monitor ADX effectiveness - disable for traditional markets, enable for crypto
✅ Proper position sizing - adjust default_qty_value based on your capital and instrument price
✅ Paper trade first - test for 2-4 weeks before risking real capital
Risk Management
Fixed 2% stop loss per trade (adjustable)
Stop loss tracks candle wicks for accurate execution
Positions auto-reverse on opposite signals (no manual intervention needed)
0.075% commission built into backtest (adjust for your broker)
Customization Options
All parameters are adjustable via inputs:
EMA periods (default: 9/21)
RSI length and thresholds (default: 14-period, 55/45 levels)
ADX length and threshold (default: 14-period, 20 threshold)
Stop loss percentage (default: 2%)
Webhook Automation
This strategy includes six distinct alert messages for automated trading:
"Entry Buy" - Long position opened
"Entry Sell" - Short position opened
"Close Long" - Long position closed on opposite crossover
"Close Short" - Short position closed on opposite crossover
"SL Hit Long" - Long stop loss triggered
"SL Hit Short" - Short stop loss triggered
Compatible with Delta Exchange, Binance Futures, 3Commas, Alertatron, and other webhook platforms.
Important Notes
⚠️ Crypto markets require extensive backtesting - volatility patterns differ significantly from traditional markets
⚠️ Higher timeframes = better results - 15min works but 1H/4H provide cleaner signals
⚠️ ADX toggle is critical - OFF for traditional markets, ON for crypto
⚠️ Not financial advice - always conduct your own research and use proper risk management
⚠️ Past performance ≠ future results - backtest results may not reflect live trading conditions
Disclaimer
This strategy is for educational and informational purposes only. Trading futures and options involves substantial risk of loss. Always backtest thoroughly, start with paper trading, and never risk more than you can afford to lose. The author assumes no responsibility for any trading losses incurred using this strategy.

Reversals & Pullbacks PRO🚀 Reversals & Pullbacks Pro — Predict Market Turning Points with Precision
Stop chasing trends — start anticipating them.
The Reversals & Pullbacks Pro indicator identifies high-probability reversal and pullback zones before they happen, using advanced mean reversion logic and momentum change signals.
What it does:
✅ Detects major reversals and minor pullbacks in real time
✅ Uses dynamic mean reversion algorithms to spot over-extended price moves
✅ Highlights premium entry zones for counter-trend and trend-reversal setups
✅ Works across many markets — Designed for Forex and Indices but can be used on Crypto
✅ Clean visuals with smart alerts (no repainting after candle close)
💡 Perfect for:
Swing traders, scalpers, and day traders who want to catch price turning points before everyone else.
⏱️ Don’t react — predict.
Upgrade your trading with Reversals & Pullback Pro and trade market reversals like a PRO!

Market SessionsMarket Sessions (Asian, London, NY, Pacific)
Summary
This indicator plots the main global market sessions (Asian, European, American, Pacific) as boxes on your chart, complete with dynamic high/low tracking.
It's an essential tool for intraday traders to track session-based volatility patterns and visualize key support/resistance levels (like the Asian Range) that often define price action for the rest of the day.
Who it’s for
Intraday traders, scalpers, and day traders who need to visualize market hours and session-based ranges. If your strategy depends on the London open, the New York close, or the Asian range, this script will map it out for you.
What it shows
Customizable Session Boxes: Four fully configurable boxes for the Asian, European (London), American (New York), and Pacific (Sydney) sessions.
Session High & Low: The script tracks and boxes the highest high and lowest low of each session, dynamically updating as the session progresses.
Session Labels: Clear labels (e.g., "AS", "EU") mark each session, anchored to the start time.
Key Features
Powerful Timezone Control: This is the core feature.
Use Exchange Timezone (Default): Simply enter session times (e.g., 8:00 for London) relative to the exchange's timezone (e.g., "NASDAQ" or "BINANCE").
Use UTC Offset: Uncheck the box and enter a UTC offset (e.g., +3 or -5). Now, all session times you enter are relative to that specific UTC offset. This gives you full control regardless of the chart you're on.
Fully Customizable: Toggle any session on/off.
Style Control: Change the fill color, border color, transparency, border width, and line style (Solid, Dashed, Dotted) for each session individually.
Smart Labels: Labels stay anchored to the start of the session (no "sliding") and float just above the session high.
Why this helps
Track Volatility & Market Behavior: Visually identify the "personality" of each session. Some sessions might consistently produce powerful pumps or dumps, while others are prone to sideways "chop" or accumulation. This indicator helps you see these repeating patterns.
Find Key Support/Resistance Levels: The High and Low of a session (e.g., the Asian Range) often become critical support and resistance levels for the next session (e.g., London). This script makes it easy to spot these "session-to-session" S/R flips and reactions.
Aid Statistical Analysis: The script provides the core visual data for your statistical research. You can easily track how often the London session breaks the Asian high, or which session is most likely to reverse the trend, helping you build a robust trading plan.
Context is King: Instantly see which market is active, which are overlapping (like the high-volume London-NY overlap), and which have closed.
Quick setup
Go to Timezone Settings.
Decide how you want to enter times:
Easy (Default): Leave Use Exchange Timezone checked. Enter session times based on the chart's native exchange (e.g., for BTC/USDT on Binance, use UTC+0 times).
Manual (Pro): Uncheck Use Exchange Timezone. Enter your UTC Offset (e.g., +2 for Berlin). Now, enter all session times as they appear on the clock in Berlin.
Go to each session tab (Asian, European...) to enable/disable it and set the correct start/end hours and minutes.
Style the colors to match your chart theme.
Disclaimer
For educational/informational purposes only; not financial advice. Trading involves risk—manage it responsibly.
