Kijun Equilibria [by Oberlunar]The “story” starts with Ichimoku Kinkō Hyō, created by the Japanese journalist Goichi Hosoda in the 1930s and published in the 1960s; its literal meaning is often rendered as a “one-glance equilibrium chart” because it aims to show balance, trend direction, and dynamic support/resistance at a glance.
In that tradition, the Kijun-sen (“base line”) is not just a moving average: it is a reference equilibrium level, classically computed as the midpoint of the high–low range over 26 periods.
Kijun Equilibria keeps that Japanese “equilibrium” idea, but modernises it in two ways. First, it turns the Kijun concept into an adaptive equilibrium line: instead of assuming a fixed market tempo (like the classic 26), it estimates a dominant cycle length using an Ehlers-style Hilbert/cycle approach, then scales internal lengths and smoothers so the equilibrium line responds differently in trending vs choppy regimes.
Second, it makes equilibrium explicitly multi-timeframe: you compute the adaptive Kijun on the chart TF (in this example 30 m) plus three lower TFs (in this example 1, 3, 5 m), then build a “cloud” between the highest and lowest of those equilibria, which becomes a practical map of where timeframes disagree and where price is most likely to “snap back” toward balance.
Bearish bias
This is a signal that the trend may shift into a bearish bias.
Due to this graphical setup, “cloud fog” is a meaningful meta-word here. In classic Ichimoku, the thickness and shape of the cloud provide a visual way to reason about strength and uncertainty.
In my indicator, the “cloud fog fills” reinterpret that same visual principle, but instead of Senkou spans, they shade the space between equilibria across timeframes, making dispersion (and compression) immediately visible.
The Ornstein–Uhlenbeck part then adds a quantitative “pullback detector” that fits the Ichimoku philosophy rather than replacing it. OU was introduced by Ornstein and Uhlenbeck as a mean-reverting stochastic process; in modern terms, it is a canonical model for a variable that is continuously pulled back toward a mean.
Bullish bias
In this case, we have a bullish bias, and the pullback detector based on Ornstein–Uhlenbeck mean-reversion calculations has signalled that the price is re-entering the green cloud, suggesting a potential bullish continuation after the bounce.
In my indicator, the mean is not an arbitrary moving average: it is the Kijun equilibrium itself. I apply OU to the deviation x = price − kijun, estimate a reversion strength (κ/kappa), and convert the deviation into a z-like score.
The result is very “Japanese” in spirit: the model isn’t saying “price is random”; it’s saying “price departs from balance, but balance pulls back”, and you only trust that pullback when κ is strong enough and the deviation is meaningfully stretched.
Bearish bias and Pull-Back idea
In this case, there are multiple pullbacks that may offer short opportunities, but eventually price breaks strongly through the TF baseline—at that point, it’s time to stop treating the trend as bearish-biased.
Finally, ATR is the glue that makes the bias logic practical and comparable across regimes. ATR (popularised by J. Welles Wilder in 1978) is fundamentally a volatility yardstick. Here it becomes, coupled with biased signals, the unit of measure for everything that should scale with volatility: how far price must be outside the cloud to count as “stretched”, how much spacing you require between stacked Kijuns to accept a true long/short bias, and even how far above/below price you place bias labels. In other words, the “Long Bias / Short Bias” is not just alignment across timeframes; it is alignment with enough ATR-separated structure to reduce false signals when all lines are compressed.
This isn’t one of the most advanced tools in my collection, but it can help newcomers. Be careful: despite the safeguards added, it may or may not produce consistently reliable signals. Risk management is central.
However, given its history, I wanted it to be part of my own collection of scripts with my personal mods, and I’m releasing it for free to the community.
by Oberlunar 👁★
Kijun

Kijun Sen Standard Deviation | QuantLapse SystemsOverview
The Kijun Sen Standard Deviation indicator by QuantLapse Systems is a volatility-aware trend-following framework that combines the structural equilibrium of the Kijun Sen (基準線) with statistically adaptive standard deviation bands.
By anchoring trend detection to market structure and confirming direction through volatility expansion, the indicator delivers a cleaner, more reliable regime classification across varying market conditions.
Rather than reacting to short-term noise, the system focuses on identifying statistically justified trend phases , making it well-suited for disciplined, rule-based trading.
Technical Composition, Calculation, Key Components & Features
📌 Kijun Sen (基準線) – Structural Trend Baseline
Calculated as the midpoint between the highest high and lowest low over a user-defined period.
Represents market equilibrium and structural balance rather than short-term momentum.
Naturally adapts to expanding and contracting price ranges.
Provides a stable baseline for regime detection and volatility validation.
Acts as the anchor for deviation bands and persistent trend-state logic.
Unlike fast or reactive moving averages, the Kijun Sen emphasizes price structure and equilibrium , making it especially effective for higher-quality trend confirmation.
📌 Volatility Adjustment – Standard Deviation Bands
Standard deviation is calculated over a configurable lookback to measure current price dispersion.
Upper and lower envelopes are formed by applying a deviation multiplier to the Kijun Sen.
Band width expands during volatility surges and contracts during consolidation.
Creates proportional, volatility-aware thresholds instead of static offsets.
Visually represents market energy through expanding and compressing channels.
These adaptive bands ensure that trend signals only occur when volatility supports directional movement.
📌 Trend Signal & Regime Calculation
Bullish Trend is confirmed when price closes above the upper deviation band.
Bearish Trend is confirmed when price closes below the lower deviation band.
Once established, the trend state persists until an opposing volatility break occurs.
This persistence reduces whipsaws and improves regime stability.
Trend state is reinforced with color-coded lines, envelopes, and background shading.
This volatility-confirmed persistence model is visible in the chart, where trends remain intact through minor pullbacks and only flip on decisive expansion.
How It Works in Trading
✅ Volatility-Confirmed Trend Detection – Requires expansion beyond deviation bands.
✅ Noise Suppression – Filters low-energy price movement within volatility envelopes.
✅ Regime Persistence – Maintains trend state until statistical invalidation.
✅ Immediate Visual Context – Direction, strength, and transitions are clear at a glance.
Visual Representation
Trend signals are displayed directly on price using both line and background context:
🟢 Green / Teal Kijun & Envelope → Confirmed bullish regime.
🔴 Red / Pink Kijun & Envelope → Confirmed bearish regime.
Semi-transparent band fill visualizes volatility expansion and compression.
Buy and Sell labels appear only on confirmed regime transitions.
The lower panel includes:
Strategy equity curve based on trend exposure.
Buy & Hold equity for performance comparison.
Background regime shading synchronized with trend state.
Features and User Inputs
The Kijun Sen Standard Deviation framework offers a focused yet powerful set of configurable inputs:
Kijun Sen Length – Controls structural trend sensitivity.
Standard Deviation Controls – Adjust lookback length and multiplier for regime strictness.
Backtesting & Date Filters – Define evaluation periods and starting conditions.
Display Options – Toggle labels, equity curves, and background shading.
Color Customization – Fully configurable buy/sell colors for trends and equity curves.
These controls allow users to balance responsiveness, stability, and clarity without overfitting.
Practical Applications
The Kijun Sen Standard Deviation indicator is designed for traders who prioritize structure, volatility confirmation, and regime awareness.
Primary Trend Filtering – Identify and stay aligned with dominant market direction.
Volatility-Aware Trend Following – Participate only when price expansion confirms intent.
Risk-Managed Exposure – Avoid chop during compression and transitional phases.
Systematic Strategy Development – Use as a regime engine or higher-timeframe filter.
Performance Evaluation – Compare trend-following equity against buy-and-hold benchmarks.
This framework bridges classical Ichimoku structure with modern statistical validation.
Conclusion
The Kijun Sen Standard Deviation indicator by QuantLapse Systems represents a refined evolution of Ichimoku-based trend analysis.
By integrating the structural equilibrium of the Kijun Sen with adaptive standard deviation confirmation, the system delivers clearer regime classification, reduced noise, and more reliable trend participation.
Rather than attempting to predict price, it focuses on confirming when trends are statistically justified .
Who should use Kijun Sen Standard Deviation:
📊 Trend-Following Traders – Stay aligned with dominant market structure.
⚡ Momentum & Swing Traders – Enter only on volatility-backed expansions.
🤖 Systematic & Algorithmic Traders – Ideal as a regime filter or trend-state engine.
Past performance is not indicative of future results.
Disclaimer: All trading involves risk, and no indicator can guarantee profitability.
Strategic Advice: Always backtest thoroughly, optimize parameters responsibly, and align settings with your timeframe, asset class, and risk tolerance before live deployment.

QuantMotions - TPR SentinelQuantMotions – TPR Sentinel
The TPR Sentinel Band is a full trade-assistant for discretionary traders.
It combines an adaptive trend engine, directional TPR logic, volume intelligence, ATR-based risk management, a brute-force parameter optimizer, and a modern on-chart UI (entries/TP/SL panel + stats). The goal: fewer fake flips, clearer trend shifts, and visually guided trade management.
1. Core Concept
The Sentinel Line is built from a blend of:
- SMA + EMA
- Midline of highest/lowest high/low (Kijun-style)
- Donchian-style mid close
On top of that, the script calculates a Directional TPR (Time-Price-Ratio):
- Short / medium / long slopes of price
- Normalized by ATR
- Converted into a trend state:
+1 = Uptrend
-1 = Downtrend
0 = Neutral / transition
Hysteresis (Flux) controls how easily the trend flips:
- Higher hysteresis → harder to reverse → fewer fake-outs in chop.
2. Signals, Filters & Volume Intelligence
Signals
- Trend Flip Long: TrendState changes from −1/0 → +1.
- Trend Flip Short: TrendState changes from +1/0 → −1.
Filters
- ADX Filter (optional):
- Only allows trades if ADX is above a chosen threshold.
- Avoids trading in flat, low-energy markets.
R:R Filter:
- Before any signal is accepted, the script checks whether the distance to TP1 is at least the configured Risk:Reward ratio relative to the distance to SL.
- Only if that minimum R:R is reached, a signal becomes valid.
Volume Intelligence & Clouds
- Aggregates up/down volume (optionally across multiple tickers you define).
- Builds Volume Clouds around the Sentinel Line:
a) Positive intensity → buying pressure (bullish cloud).
b) Negative intensity → selling pressure (bearish cloud).
Optional Volume Direction Filter:
- Long only when volume intensity ≥ 0.
- Short only when volume intensity ≤ 0.
3. Risk, Exits & Trailing Stop
The indicator includes a complete exit framework (for visual/manual trading):
Stop Loss Modes
- ATR Fixed: SL placed at a fixed ATR multiple from the entry.
- Trend Line (Dynamic): SL placed directly on the Sentinel Band (structural stop).
Take Profits
- TP1 – “safe target”:
a) Based on ATR distance.
b) Closes a configurable percentage of the position (e.g., 50%).
- TP2 (optional):
Second fixed target used only when Trailing Stop is OFF.
- Trend Runner Mode (Use TP = OFF):
Ignores fixed TP levels and rides the trend until the trend state flips.
Trailing Stop
- Activates after TP1 is hit (if enabled).
- Moves with price at a configurable ATR distance:
a) Long: trail creeps up under price.
b) Short: trail creeps down above price.
- Visually plotted as a purple trail line, dynamically replacing the original SL as the effective exit point.
Each trade is tracked internally and drawn as a green/red box with PnL labels between entry and exit.
4. UI & Stats
Candle Coloring (TRON Theme)
- Cyan = active uptrend & valid environment.
- Orange = active downtrend & valid environment.
Modern Trade Panel (on last bar)
- Live overlay of:
a) Entry
b) TP1
c) TP2
d) SL or active Trail (with dynamic label text: “SL (ATR)”, “SL (Struct)”, “TRAIL”)
Info label shows:
- Historical win rate in the current direction (Long/Short).
- Distance to SL, TP1, TP2 from current price.
- Box color blends from red → green depending on whether price is closer to SL or TP.
Stats Table (Bottom Right)
- Separate stats for Long and Short trades:
a) Win rate (%)
b) Cumulative PnL
Alerts
- Generates JSON alerts on signals, for example: {"side":"buy","ticker":"XYZ","price":123.45}
Perfect for webhooks, bots, or external automation.
5. Brute Force Optimizer (TPR Lab) – Important Limitations
The built-in Optimizer is a numerical helper, not a full strategy optimizer.
What it does:
- Runs brute-force simulations over a sliding window of historical data.
- Scans user-defined ranges for:
- Best Period (“Best Cycle”)
- Best Hysteresis (“Best Flux”)
Uses an efficiency score (average profit per trade) to rank combinations.
Displays results in the bottom-left TRON panel:
- Best Cycle
- Best Hysteresis
- Efficiency Score
What it does NOT optimize or take into account:
- It does not include your actual minimum R:R filter.
- It does not simulate or optimize your Stop Loss modes.
- It does not simulate Trailing Stops.
- It does not use the ADX filter.
- It does not use the Volume filters or Volume Clouds.
Because of this, the suggested “best” Period and Hysteresis are purely computational recommendations based on a simplified internal model.
In real trading, with your full setup (R:R filter, SL mode, Trailing, ADX, Volume confirmation, personal style), other parameter combinations can be superior to what the Optimizer suggests.
You should treat the Optimizer as:
A starting point or a research tool, not the final truth.
Always validate its suggestions visually, in the context of your full system and risk management.
6. Practical Usage
- Works on FX, indices, crypto, commodities – anything with decent liquidity.
- Scalping → use lower Period values, higher responsiveness.
- Swing → use higher Period values, more stability.
Recommended:
- Keep ADX filter ON to avoid dead markets.
- Use Volume Clouds as directional bias.
- Use the Info Panel and Stats to align with your own R:R and risk rules.
Disclaimer
This script is for educational/analytical purposes only and does not constitute financial advice. It does not execute trades or manage your risk automatically. Always combine it with your own strategy, money management, and independent decision-making.
Use the Info Panel and Stats to align with your own R:R and risk rules.

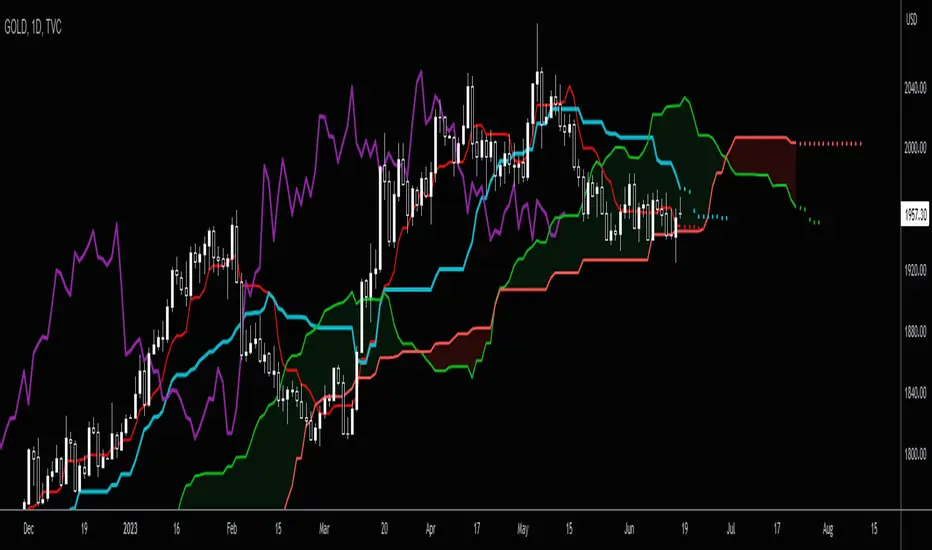
Ichimoku Horizon MTFIchimoku Horizon MTF — Multi-TimeFrame Ichimoku with auto-map
Overview
Ichimoku Horizon MTF plots classic Ichimoku on your current chart timeframe and projects up to three higher timeframes (TF1 / TF2 / TF3) onto the same chart. The goal is to keep one clean chart while still seeing higher-timeframe Ichimoku context (for example Daily / Weekly / Monthly).
On the screen, you typically see:
– the full Ichimoku set for your chart timeframe (Tenkan, Kijun, Kumo, Chikou),
– the same structure projected from TF1–TF3, each with its own colour family,
– an optional Kumo Midline (extra line, not part of original Ichimoku, used as a visual helper),
– and an optional TF banner showing which higher timeframes are currently mapped.
And optionally: A Kumo Midline (midpoint between SSA and SSB)
Kumo Midline (non-original Ichimoku addition)
The Kumo Midline is a personal addition.
It is not part of the original Ichimoku.
It is provided for informational and visual purposes only, as a helper to read the centre of the cloud.
It is calculated as the simple average of the two cloud boundaries:
Midline= SSA + SSB / 2
You can turn it ON/OFF globally, and also separately for each timeframe (Chart / TF1 / TF2 / TF3). The same logic (including the optional Midline) is applied to TF1 / TF2 / TF3 and projected onto your main chart.
Auto-map & timeframe presets
You control how TF1 / TF2 / TF3 are selected using two mechanisms:
Auto-map TF from chart (ON/OFF)
When ON, the script automatically chooses a profile based on your chart timeframe
(Scalp / Intraday / Swing / Long Term / Investment / Macro).
TF1 / TF2 / TF3 are always higher than the chart timeframe, with a consistent progression.
Preset Time Frame (when Auto-map = OFF)
When OFF, you choose a fixed preset, for example:
Scalp S — 1m / 5m / 15m
Intraday L — 1H / 4H / 1D
Swing — 1D / 1W / 1M
Investment — 1M / 3M / 6M
Macro — 3M / 6M / 12M
If you choose Custom, you manually set TF1 / TF2 / TF3 using the three “Timeframe selection” inputs in the TF1 / TF2 / TF3 sections.
This allows you to switch quickly between scalp / intraday / swing / macro profiles without editing any code.
TF banner (legend) & display options
The indicator includes an optional TF banner (a small panel) that acts as a timeframe legend:
Shows the active profile name (Scalp, Intraday M, Intraday XL, Swing, Long Term, Macro, Custom). Displays the three mapped timeframes (TF1 / TF2 / TF3) in short form (5m, 1H, 4H, 1D, 1W, 1M, etc.). Shows “TK / KJ” with small coloured squares for Tenkan and Kijun for each TF, matching the line colours on the chart.
You can control:
Show / hide the banner.
Position: Top / Bottom, Left / Center / Right.
Text colour, background, text size.
Each block (Chart, TF1, TF2, TF3) also has its own toggles for:
Tenkan
Kijun
Chikō
SSA
SSB
Kumo fill
Kumo Midline
This lets you keep only what you really need (for example: just HTF Kijun + HTF Kumo).
Colour design
Special care has been taken with the colour design:
Each timeframe uses its own colour family
(for example: warm colours for the chart timeframe, green for TF1, blue for TF2, neutral/grey for TF3), so the chart stays readable even when all TFs are displayed at once.Kumo fills are semi-transparent to provide context without hiding price action. Defaults are tuned for light charts, and every colour can be customised if you prefer another palette.
Built-in alerts
The script includes a small set of ready-to-use alerts, controlled by:
A global “Enable alerts” switch
A built-in cooldown to avoid alert spam
Available conditions (on the chart timeframe):
TK > KJ (UP) – Tenkan crosses above Kijun (filtered by a bullish HTF bias).
TK < KJ (DOWN) – Tenkan crosses below Kijun (filtered by a bearish HTF bias).
Kumo Breakout (UP) – Close breaks above the cloud (with bullish HTF filter).
Kumo Breakout (DOWN) – Close breaks below the cloud (with bearish HTF filter).
All TF Bullish – Chart + TF1 + TF2 + TF3 all have Tenkan > Kijun (full bullish alignment).
All TF Bearish – Chart + TF1 + TF2 + TF3 all have Tenkan < Kijun (full bearish alignment).
HTF Confirms (BULL) – Bullish TK cross on the chart timeframe, with HTF support and price above the cloud.
HTF Confirms (BEAR) – Bearish TK cross on the chart timeframe, with HTF confirmation and price below the cloud.
To use them:
Add an alert on the indicator,
Choose one of these conditions,
Use “Once per bar close” for cleaner signals.
No-repaint logic
Higher-timeframe data is fetched using request.security() with:
barmerge.gaps_off
barmerge.lookahead_off
This means:
No artificial lookahead,
No repainting,
Apart from the normal forward shift of the Ichimoku cloud, which is how standard Ichimoku works by design.
If the chart get “stuck on the left”
stuck on the left side, or misaligned. If you see the TF banner or right-side labels not updating correctly: Clear the TradingView app cache (or restart the app / browser)
Reload the chart. This usually forces TradingView to redraw all tables and labels correctly and fixes the display issue.
Disclaimer
This script is provided for educational and informational purposes only.
It does not constitute financial or investment advice and should not be used as a standalone signal provider.
Always do your own analysis and use proper risk management before taking any trade.
Thanks for using Ichimoku Horizon MTF.

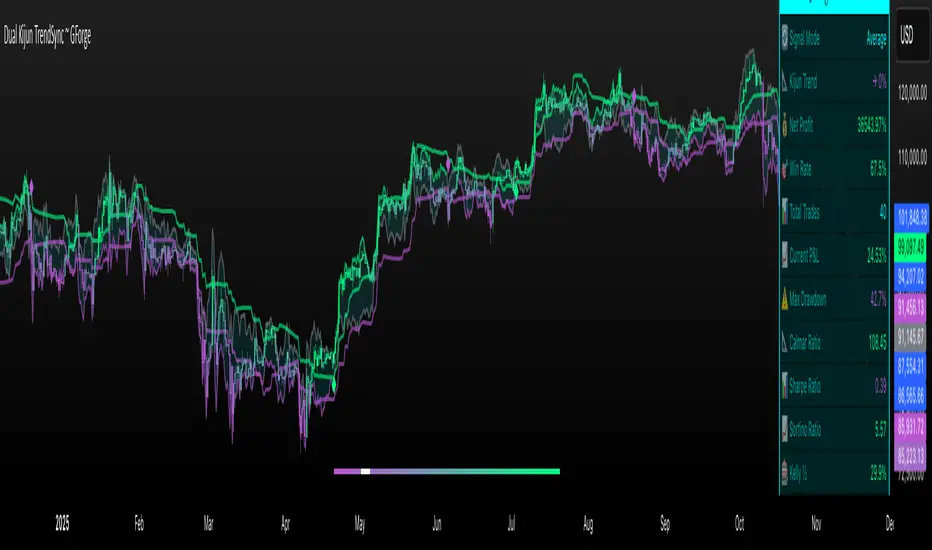
Dual Kijun TrendSyncDual Kijun TrendSync ~ GForge
What It Is:
The Dual Kijun TrendSync is an advanced trend-following indicator that combines Ichimoku's Kijun-sen (baseline) concept with modern oscillator mechanics and momentum deviation bands. It uses two parallel Kijun systems running at different speeds to capture both short-term momentum and longer-term trend direction.
The Kijun Calculation:
Unlike moving averages that use closing prices, Kijun-sen uses a unique approach:
Kijun = (Highest High + Lowest Low) / 2
Over a specified period (e.g., 26 bars), it finds:
The highest price reached
The lowest price reached
Then plots the midpoint between them
This creates a "equilibrium line" that represents the center of price action over that period. When price breaks above/below this equilibrium, it signals a potential trend shift. The indicator then adds volatility bands around this Kijun line and measures where price sits within those bands as a 0-100 oscillator.
Core Components:
1. Dual Kijun Systems:
Kijun 1 (Fast): Shorter period for responsive signals
Kijun 2 (Slow): Longer period for trend confirmation
Each uses the (High+Low)/2 midpoint calculation
2. Oscillator Conversion:
Transforms price position relative to volatility bands into a 0-100 oscillator
Formula: 100 * (Price - LowerBand) / (UpperBand - LowerBand)
Similar to Stochastic but using Kijun as the baseline
3. Momentum Deviation Bands (MD):
Applies Bollinger Band concept to the oscillator itself
Creates dynamic overbought/oversold zones that adapt to volatility
Refines entry/exit signals when in "Average" mode
How It Works:
Signal Generation:
Long signals: Oscillator crosses above the long threshold (default 82)
Short/Cash signals: Oscillator crosses below the short threshold (default 32)
In "Average" mode, uses MD band crossovers for more refined entries
Three Operating Modes:
Kijun1 Only: Fast signals, more trades, quicker reactions
Kijun2 Only: Slower signals, fewer trades, stronger trends
Average: Combines both systems with MD refinement for balanced approach
Visual Feedback:
Gradient bar coloring shows current oscillator state
Threshold lines mark entry/exit zones on price chart
MD bands show momentum extremes
Comprehensive metrics table tracks performance
Key Advantages:
Ichimoku Foundation: Leverages time-tested equilibrium concepts
Dual Timeframe Analysis: Captures both momentum and trend
Adaptive Volatility: MD bands adjust to market conditions
Clear Visual Signals: Easy to interpret with color-coded zones
Built-in Risk Metrics: Real-time performance tracking
Best Use Cases:
Trending markets where Kijun equilibrium shifts are meaningful
Instruments with clear directional moves
Timeframes from 1H to Daily (higher timeframes typically better)
Can be used standalone or combined with other Ichimoku elements
The indicator essentially answers: "Where is price relative to its equilibrium, and is momentum strong enough to warrant a position change?"
⚠️ DISCLAIMER
This indicator is a technical analysis tool designed to assist in trading decisions. Past performance does not guarantee future results. Always conduct your own research and use proper risk management. This tool should be used as part of a comprehensive trading strategy, not as a standalone solution.
Developed by GForge Trading Systems
Kijun_ATROVERVIEW
Kijun + ATR is an indicator that combines Lagging Kijun Base Line From Ichimoku Cloud (direction indicator) and Volatility Indicator ATR.
By combining ATR with kijun we can filter out noise from Base Line.
CALCULATIONS
Kijun is calculated by taking average of lowest and highest point of price over set lenght.
ATR is just default Tradingview Indicator that calculates average true range of price over set period of time.
WORKING
When both close > lower and not close < upper are true indicator indicate long by color limeand indicates short when close < upper by color fuchsia (Color can be changed in settings)
Indicator works best in Trending Market Regimes can have problems by signaling tops in Consolidating Market Regimes during bear markets and by sygnaling bottom in short consolidating market regimes during bull market.

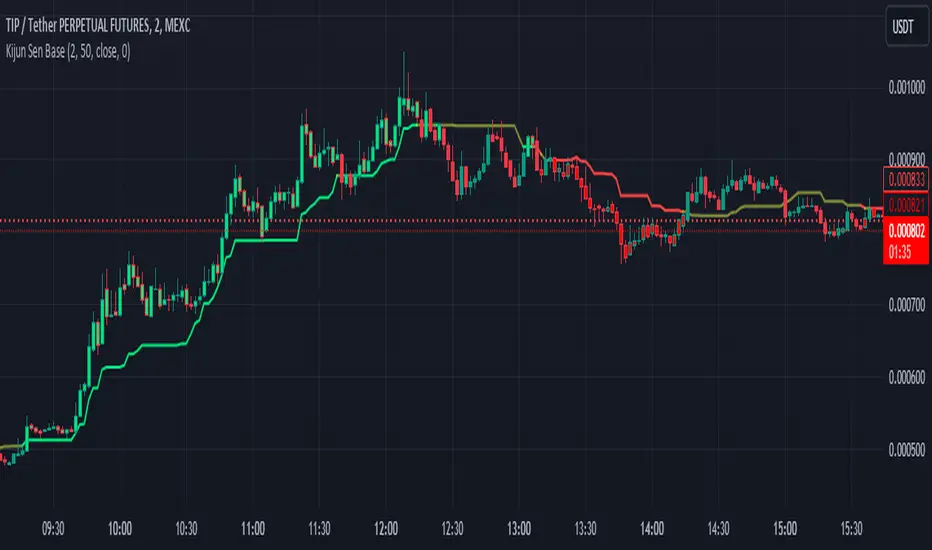
Kijun Sen BaseWhat is Kijun Sen?
Kijun-sen also means "base line" and is the mid-point of the 26-period high and low. Kijun-sen is typically used in conjunction with Tenkan-sen (conversion line) or (the 9-period midpoint price) to generate trade signals when they cross. Kijun-sen is typically used in conjunction with the other Ichimoku indicators.
What is the Kijun Sen Base?
The Kijun Sen Base is the center line in the Ichimoku Cloud Indicator. We have taken that line out and made it an indicator on its own , color-coded it, and allowed traders to track the price for a clean and simple base filter.
Is this a Moving Average?
NO
The Difference Between Kijun-sen (Base Line) and a Simple Moving Average (SMA)
The Kijun-sen is a midpoint of the high and low prices over the last 26 periods. This is not an average.
How do I trade with this Indicator?
Unless there's a lot of recent price movement, enough to pull the price away from the 26-period midpoint, the Kijun-sen will often trade near and intersect with the current price. At times like these, it is not an ideal tool for helping with trend direction. If, however, there is a strong price move away from Kijun Sen and the gap between Kijun Sen and the price is "increasing" or "widening", this is an indication that a trend is forming.
Kijun Sen Base can be used to confirm a trend and is a clean addition to other indicators the trader may use on their charts while at the same time keeping the chart less cluttered.
Happy Trading and Good Luck!
Simple Ichimoku Kinko Hyo Cloud█ OVERVIEW
This indicator as an educational and showcase the usage of user-defined types or objects (UDT) for Ichimoku Kinko Hyo or Ichimoku Cloud.
█ CREDITS
TradingView

FOREX Master Pattern Trend Finder by nnamdertWhat does this Indicator do?
This indicator works by identifying Trends and "potential" shifts in trends before they happen. It is technically a momentum indicator that watches for specific Bullish or Bearish momentum (i.e. Bull Runs, and Crashes).
How does it do this?
It uses a custom script that takes into account extremes in price and certain moving averages and other accurate forward looking indicators. Once it finds a Bull run, signals are triggered in the form of PLUS signs. It does the same for strong Bearish trends. Based on how the script is configured, the Indicator is able to spot (in advance) unique movement in the trend that can predict a change in momentum prior to the change occurring.
These momentum changes can be configured as alerts.
As seen in the screenshot below the indicator triggers "early warning" signals when it detects a specific movement that is indicative of a potential change in momentum or trend. It does this IN ADVANCE of any change - it is ONLY A PREDICTION but allows the trader to look at the asset to determine if the potential change in trend is valid and gives the trader enough time to set up a trade and stop-loss.
As seen in the screenshot below color-coded candles allow the trader to visually SEE the change on the chart making it easier to get a quick glance at the current trend. In addition, Green and Red Crosses were added to the oscillator to help easily identify trends if the color coded candle feature is turned OFF. These Red and Green Crosses are not located at every highlighted bar location, rather, at the first bar that the alert was triggered on. If there was a gap in the trend, the alert triggers, and plots again when a new trend starts.
As seen in the screenshot below, when a strong trend is present in either direction, small red or green dots are plotted on the oscillator. This makes spotting past and current trends much easier. Even if the price is not moving up or down, this indicates strong underlying buying or selling pressure.
Some traders like using indicators as a reversal finder. Although this indicator is NOT A REVERSAL INDICATOR, I added a signal that can be used as a "potential" reversal finder. You can see this in the screenshot below.
These "reversal" signals typically appear prior to a move in the opposite direction (but not always). A stop-loss can be set at the high or low of the previous bar depending on direction.
At times, multiple "conflicting" warning signals appear back-to-back. This is indicative of a "crab" in the market. Basically, indecision is present in the market. These "early warning" signals are smaller and either BLUE or ORANGE . Once a trend is recognized, the signal will be either RED or GREEN and a bit larger.
Viewing a higher timeframe will allow Forex Master Pattern traders to easily spot contraction zones. I manually draw the lines in at these zones. These "Value Lines" are typically respected in the future. As shown in the screenshot below, the level acted as support in the future and a newer value line was created at a "higher level" - this indicates a Bullish momentum in price as buyers and sellers have agreed upon the higher price as a true value area.
As seen in the screenshot below, multiple potential reversal signals plotted on the chart indicate a "weakening' in the strength of the current trend. This allows the trader to strategically move their stop-loss or simply take some profits off the table at this level.
This Indicator does NOT overlay on the current chart but allows the trader to see color coded bars. Simply double clicking within the indicator will expand the indicator to full screen, and double clicking within the chart itself will hide the secondary pane but keep the candles visible on the chart.
Happy Trading and GOOD LUCK!
Ichimoku Buy/Sell Signals of manual MTF Tenkan crossing KijunIchimoku Buy/Sell Signals based on fast, small time frame Tenkans crossing longer timeframes Kijuns - Manual MTF Analysis
This code marks the potential change of direction based on the input of one timeframe's Ichimoku Tenkan (conversion) line crossing over a higher, longer timeframe's Ichimoku Kijun (base) line.
Feel free to change the inputs if need be and to hide the yellow box. Use Ichimoku rules of Tenkan, Kijun, Lagging Span, and Cloud for Take profit/Stop Losses. It is best to wait 3-5 minutes after the signal to enter to confirm the trend and to confirm if the Lagging Span has broken key levels. I refer to the book Trading with Ichimoku - A Practical Guide to Low-Risk Ichimoku Strategies by Karen Peloille as the Ichimoku rulebook. Good luck.
For day trading/scalping/intraday - 1min/3min/5min
Tenkan Line Timeframe = 1min
Kijun Line Timeframe = 5min
For swing trading - multiple days/weeks - 4HR/Daily/Weekly Charts
Tenkan Line Timeframe = day
Kijun Line Timeframe = week

SuperIchi [LuxAlgo]Using one indicator as the core for another one to improve certain aspects while offering an alternative user interaction can be very interesting in technical analysis.
This indicator is a modification of the popular Ichimoku indicator using the equally popular Supertrend indicator as its core, thus no longer entirely relying on calculations done over a fixed window size but instead relying on the average true range and the trend detection method offered by the Supertrend.
Settings
Tenkan: Atr length (left) and factor (right) used for the Supertrend involved in the calculations of the Tenkan Ichimoku component
Kijun: Atr length (left) and factor (right) used for the Supertrend involved in the calculations of the Kijun Ichimoku component
Senkou Span B: Atr length (left) and factor (right) used for the Supertrend involved in the calculations of the second Senkou Span Ichimoku component
Displacement: Bar offset of the cloud (positive offset) and Chikou (negative offset)
Usage
The SuperIchi indicator can be interpreted similarly to a regular Ichimoku as it retains the components and aspects from this one. Users can make use of the Supertrend Factor to detect shorter or longer-term trends.
Unlike the regular components of the Ichimoku based on rolling maximums/minimums, using the Supertrend here allows smoother components and makes it less prone to whipsaw signals.
Note that the Chikou is disabled by default in the style settings
Details
The original Ichimoku indicator is constructed from the average between the rolling maximum high and minimum low values. The Supertrend indicator also relies on one upper/lower extremity but using the average of these extremities for the modification of the Ichimoku indicator might not provide easy to use results due to the nature of these extremities.
Instead, we compute the average between the Supertrend and trailing maximums/minimums with a value reset when a new trend is detected by the Supertrend. This allows obtaining a result that is closer to the original average used by Ichimoku.

T/K CROSSSimple crossing of the Tenkan & Kijun Sen indicated by a "Cross". Surfed Tradingview for it, but did not find it, so decided to make one. Does NOT include the Ichimoku Cloud & the Chikou

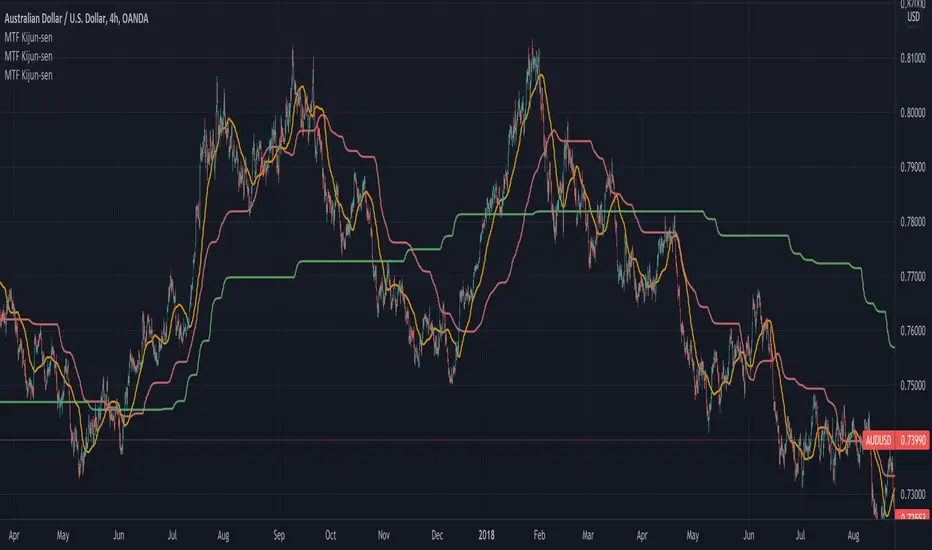
Kijun Trend IndicatorName: Kijun Trend Indicator
Category: Trend Analysis
Timeframe: All timeframes
Suggested usage: In a trending market, to understand when it is good to enter short (red line) and when to enter long (blue line).
Technical Analysis: The original idea was taken from Larry Williams: an uptrend is identified when the price is above an 18-period simple moving average (SMA) and when at least two candles do not touch the simple moving average with their lows. The opposite is true for a downtrend.
Corrado Rondelli has therefore reinterpreted with Ichimoku aka "ichimokized" replacing the 18-period Simple Moving Average with the 26-period Kijun - as per the original Ichimoku settings.
In order to make the indicator more flexible an Exponential Moving Average (EMA) has also been added.
The indicator plots the chosen line that becomes red when it is good to enter short and blue when it is good to enter long.
Configuration:
- Length: period to be used to calculate the line.
- Type: the line type that can be the Kijun (26-period) or SMA/EMA (18-period)

niceLINES (Kijun-Sen & SMMA 5, 50)Welcome to niceLINES - a combination of key lines to help find entries/exits and also determine the trend. The indicators used are the Kijun-Sen and SMMA 5, 50.
A great tool for finding entries and exits is when the 5SMMA (green line) and the Kijun-Sen (purple line) cross. Best used on longer time frames such as 1hr and above.
The 50 SMMA (blue line) is a quick and simple look at what's happening over a longer period of time. Not necessarily used for entries or exits but great for determining if an asset is going to bounce or not. You can see from the chart that the bounces off the 50 SMMA would have been a nice zone to add to a long position. Helps let you know if your trade is still on course long term or possibly failing.

Ichimoku+Based on the ichimoku cloud system, this indicator gives two presets: Standard (9/26/52/26) and Crypto (20/60/120/30).
This also shows on a chart where Tenkan-Kijun cross happens and when a Kumo Twist happens.

TK Cross and Kumo Twist AlertBased on the ichimoku cloud system, this shows on a chart where Tenkan-Kijun cross happens and when a Kumo Twist happens.

Multi Timeframe Kijun-sen [Takazudo]Multi Timeframe Kijun-sen implementation. Kijun-sen is a part of Ichimoku Kinko-hyo. This study is intented to be used as a part of buy/sell strategies.
This may be useful for lower timeframe entries.
This Kijun-sen script can be smooth using MA.
Ichimoku by HosodaWritten from scratch Ichimoku indicator, based on original calculations from Hosoda books. All formulas are exactly the same as Hosoda put them in his books, it contains additionally analysis from Higher Timeframe allowing to display Chikou trend, Kijun and Senkou-span B which are crucial in determining trend. It also contains overlay of Kyushu Legs. This is initial version of script and will be contanstly improved.
Some Ichimoku scripts have basic bugs in calculations and I ensure that formulas in this indicator are fully correct in relation to formulas provided by Hosoda.

Future Ichimoku LinesFuture Ichimoku Lines Plot: Tenkan-sen next 5 days, Kijun-sen next 10 days, Kumo A next 5 days and Kumo B next 14 days will be display
This will help you forecast the future of price and increase winning probability!
Always remember, risk management is the key of a successful trader
Have a nice trade! :D
Ichimoku Line CounterThis simple script will help you seen the range of Kijun-sen, Tenkan-sen and Senkou span B. You can use it to analyze the direction of Ichimoku components. Very useful for Ichimoku trader!
Example: how many days Kijun, Kumo, ... still flat or become flat?
We use the default number: 9, 26 and 52. You absolutely can modify it if your system use different numbers :P
Have a nice trade! :D
ICHIMOKU forecast öngörü Hi every Ichimoku Users,
ichimoku is a very useful indicator. It works very well in short periods.İ t helps me define market trends, find entry and follow.
However, it may take a lot of time to calculate which direction the lines will go.( kijun. tenkan and clouds). In the short-term charts, this is not what we want.
I'm sure you said yes.
ichimoku forecast will do this now.
will show us the next 3 candles.
ICHIMOKU FORECAST (öngörü) strengths:
- Forecast future +3 candles will make clouds, tenkan, kijun go!
- Help you indentify easy trend when clouds change, kijun go up or down!
- you can change colors, displacement, hide/show lines in its.
- Flexible and good for every timeframe: W, D, 4H, 1H and shorter.
- Flexible and good for every currencies, gold , future and more.
Test it, watch it, you'll see it works.

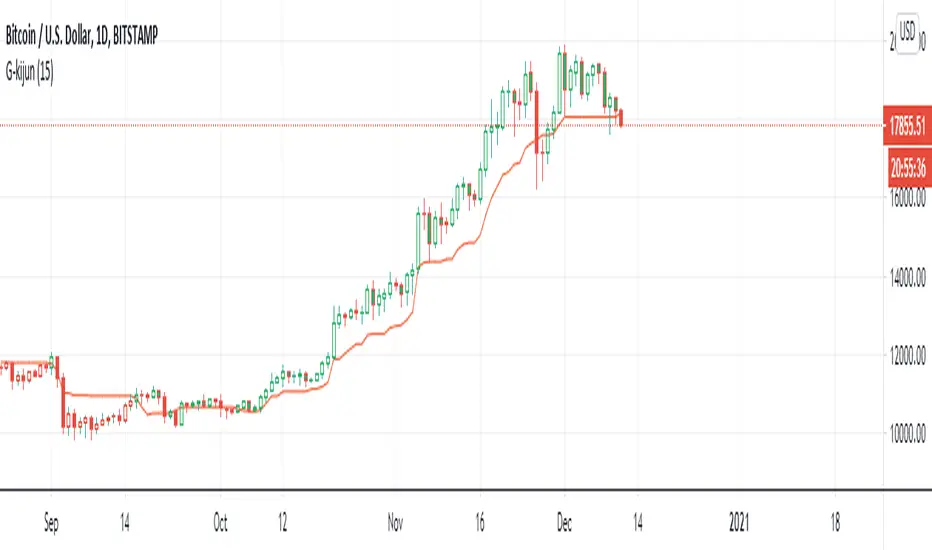
G-Kijun trailing stopThis indicator is the part of ichimoku kyo hyo.
I luv kijun-sen very much
kijun-sen is develop form (Highest - Lowest)/2
It's mean 50% of fibonacci
and I create color Green for price over the kijun-sen when the price cross down the kijun-sen it'sll be Red
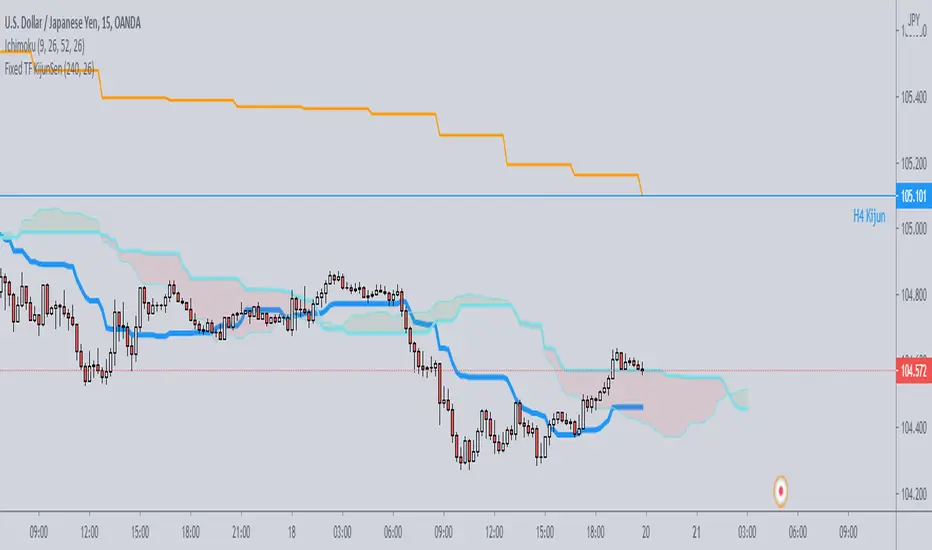
Fixed TF KijunSenJust a simple script which plots on any timeframe the kijunsen of a single specific timeframe, selectable by the user.
Useful for strategies which need to work on various timeframes, but need the kijun of that specific timeframe to be always visible for the analysis.