Kripto Index (KRIN) [WOZDUX]Created cryptocurrency index in the image and likeness of the Dow Jones. for this we have created a virtual cryptoperthite. This portfolio was formed on 7-08-2014, when allegedly purchased for 1 thousand dollars of each cryptocurrency. On that date, make a certain quantity amount of cryptocoins depending on the value. If bought 5 coins, then spent 5 thousand dollars. In the future, we calculate the current value of this portfolio and divide by 5000 to get a parameter showing how much the value of this crypto-portfolio has dared.
I used two dates. The first date is August 7, 2014 and 5 coins were used, the second date is January 1, 2015 and 6 coins were used.
The green line corresponds to the first date and the blue line corresponds to the second date. Thus, we obtain two variants of the crypto index.
With this crypto index ( abbreviated name-KRIN), you can observe the aggregate price movement of the crypto community.
Index

Volume/Rsi Overbought/oversoldI present you my last indicator. A volume indicator that indicates overbought and oversold based on the rsi, I chose the rsi because the most used surment, this indicator allows you to identify the overbought and oversold areas of the rsi with the colors blue (oversold) and orange (overbought ) on the volume indicator! Hoping that you are useful
Trend Detection IndexTrend Detection Index indicator script.
This indicator was originally developed by M.H. Pee (Stocks & Commodities V. 19:10 (54-61): Trend Detection Index).
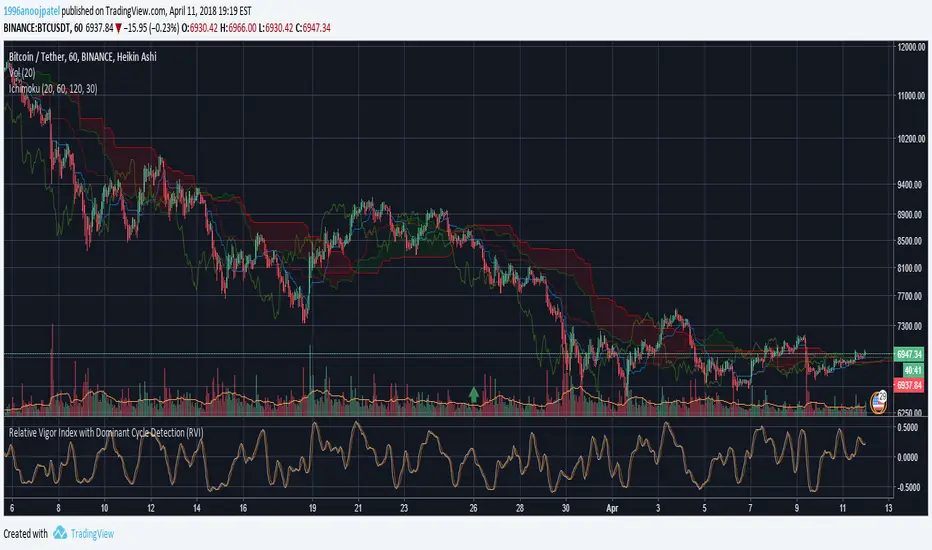
Relative Vigor Index with Dominant Cycle Detection (RVI)Relative Vigor Index with Dominant Cycle Detection. As Ehler's mentioned, fixed length look back is inherently flawed when it is possible to extract a length from a dominant price cycle. may be less effective if signal to noise ratio is greater than 2, but that usually would not happen at >5m candles, and honestly shouldn't be looking at RV(igor)I when price is moving sideways.
Read just like an RVGI, but adjusted to the current time frame. To reduce noise, changing to heiken ashi will help with signals as well. Let me know if there are improvements!
Made for JD, the OG.
Rapid RSIRapid RSI indicator script. This indicator was originally developed by Ian Copsey (Stocks & Commodities V. 24:10 (16-23): Forex Focus).
Relative Momentum IndexRelative Momentum Index indicator script. This indicator was originally developed by Roger Altman (Stocks & Commodities V. 11:2 (57-60)).
RMI with momentum period of 1 will be equal to an RSI when they have the same period and source price.

Intraday Momentum IndexIntraday Momentum Index indicator script. This indicator was originally developed by Tushar Chande.

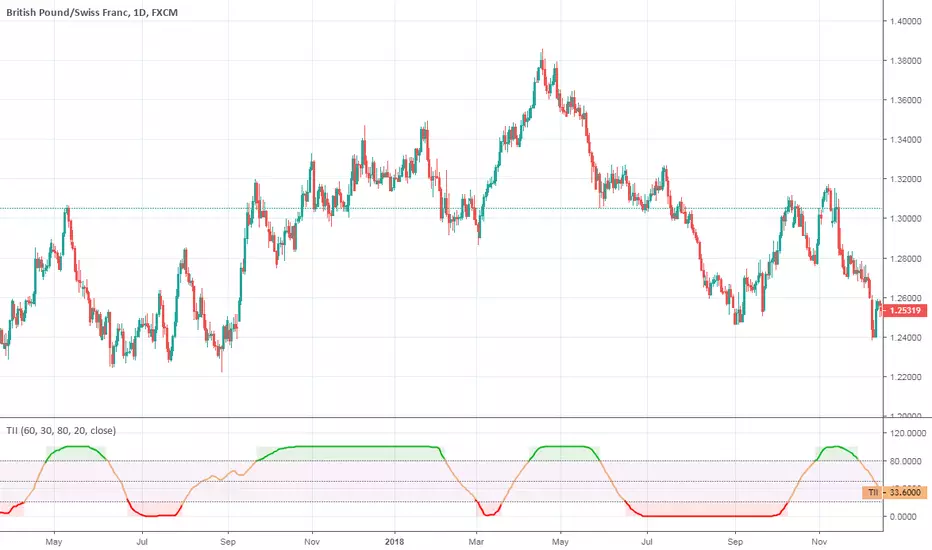
Trend Intensity IndexTrend Intensity Index indicator script. This indicator was originally developed by M. H. Pee (06/2002 issue of Stocks and Commodities Magazine)
Normalized Relative Vigor IndexThis is the Relative Vigor Index indicator just multiplied by 100 to have non-zero integer part

Perfomance index The Performance indicator or a more familiar term, KPI (key performance indicator),
is an industry term that measures the performance. Generally used by organizations,
they determine whether the company is successful or not, and the degree of success.
It is used on a business’ different levels, to quantify the progress or regress of a
department, of an employee or even of a certain program or activity. For a manager
it’s extremely important to determine which KPIs are relevant for his activity, and
what is important almost always depends on which department he wants to measure the
performance for. So the indicators set for the financial team will be different than
the ones for the marketing department and so on.
Similar to the KPIs companies use to measure their performance on a monthly, quarterly
and yearly basis, the stock market makes use of a performance indicator as well, although
on the market, the performance index is calculated on a daily basis. The stock market
performance indicates the direction of the stock market as a whole, or of a specific stock
and gives traders an overall impression over the future security prices, helping them decide
the best move. A change in the indicator gives information about future trends a stock could
adopt, information about a sector or even on the whole economy. The financial sector is the
most relevant department of the economy and the indicators provide information on its overall
health, so when a stock price moves upwards, the indicators are a signal of good news. On the
other hand, if the price of a particular stock decreases, that is because bad news about its
performance are out and they generate negative signals to the market, causing the price to go
downwards. One could state that the movement of the security prices and consequently, the movement
of the indicators are an overall evaluation of a country’s economic trend.

AJCrows RSIRelative Strength Index with indicator lines at 20, 30, 50, 70 and 80 marks. Use settings to show/hide these lines, and to choose appropriate colors.

Trend Intensity Index [DW]This study is a simple variation of M. H. Pee's Trend Intensity Index that includes two signal lines rather than one for additional trend confirmation.

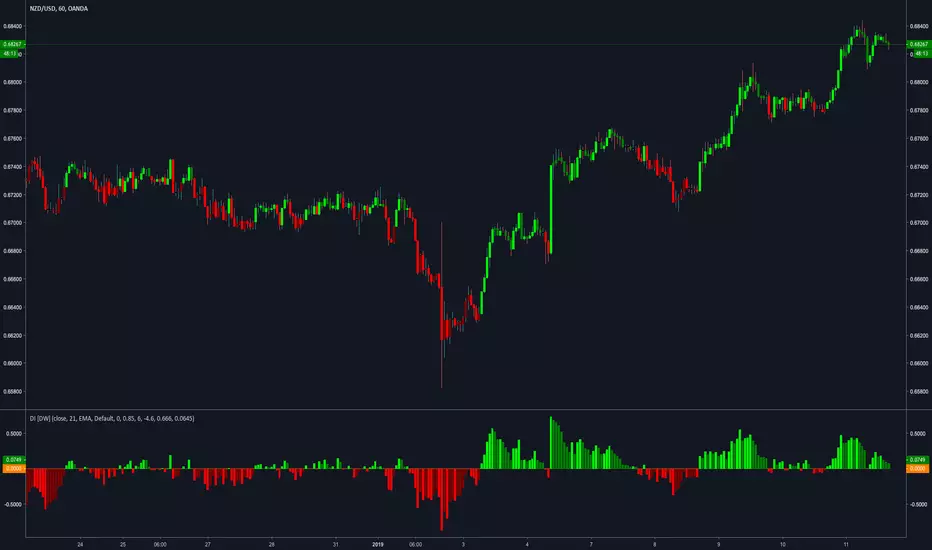
Disparity Index [DW]This is an iteration of Steve Nison's Disparity Index that includes 5 different moving average types to choose from.
Net Force Index [DW]This study is an experimental force index variation calculated by separating upward force and downward force, then taking the sum of their averages.

Index Vs Futures for OKEX Quarterly Contracts 5.0*****Please note that all old versions of this script are depreciated and will report incorrect data!*****
This "indicator" is made to display the history of the price difference between OKEX's quarterly contracts and the market that it is supposed to be tracking. Contango differences are natural, but it's nice to visualize how they change over time.
This update to this script brings in further functionality when OKEX changed the index that the futures contracts are based off of to remove chinese exchanges from the mix. This script reflects that change and crosses-over when that change was made.
The new index removed chinese exchanges which are (currently) trading at a significant discount which will give bad data when using my old code.

Altcoin PortfolioTrack your altcoin portfolio balance in Fiat currency.
Make sure to open the data window to the right of your charts, it makes everything alot easier to read at a glance.
To learn more about customizing this script to fit your portfolio, watch the video here: youtu.be
To get more cool scripts and up-to-date information about Autoview, join us in slack slack.with.pink
As per the usual, we hope this script helps with your trading venture.
Good luck, and happy trading.


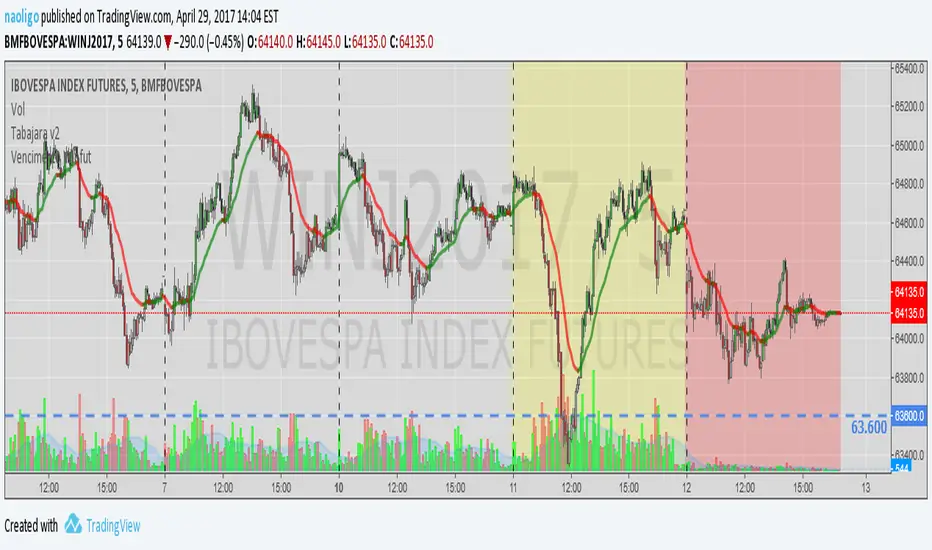
[naoligo] Vencimento MiniIndicador para marcar o background da data de vencimento da série do Bovespa Mini (winfut) e da data anterior ao vencimento. Considero importante para Swing Trade e para lembrar iniciar operações na próxima série.
Indicator to mark the background on the maturity date of the Bovespa Mini series (winfut minicontracts) and on the date before maturity. I consider it important to Swing Trade and to remember to start trading the next code.
Kraken Altcoin IndexIndex based upon the valuation of LTC, ETH, ETC, XMR and ZEC in XBT, USD and EUR
Options:
- choose which of the above alt coins are part of the index
- choose whether you want to see the valuation in XBT, USD or EUR
Note that because of the high valuation of ZEC during the launch period and the months thereafter it has a significant effect on the index. This is true as well for XMR, though to lesser extend.
Because of these effect, ZEC and XMR are not taken part of the index by default.
Please like it, if you find it useful.
If you'd like me to improve the indicator, the by all means leave a comment or PM me.
Cheers!

UCS_Ready Set Go2017 - First Code
This is a another way of looking at DMI indicator. Almost similar to any oscillator. You still need to understand the indicator and chart before you can trade with these.
---------------------------------------------------------------------------

Twiggs-ss
The modified indicator money flow Chaikin -LasyBear. Drastically accumulation and a sharp distribution of the painted color
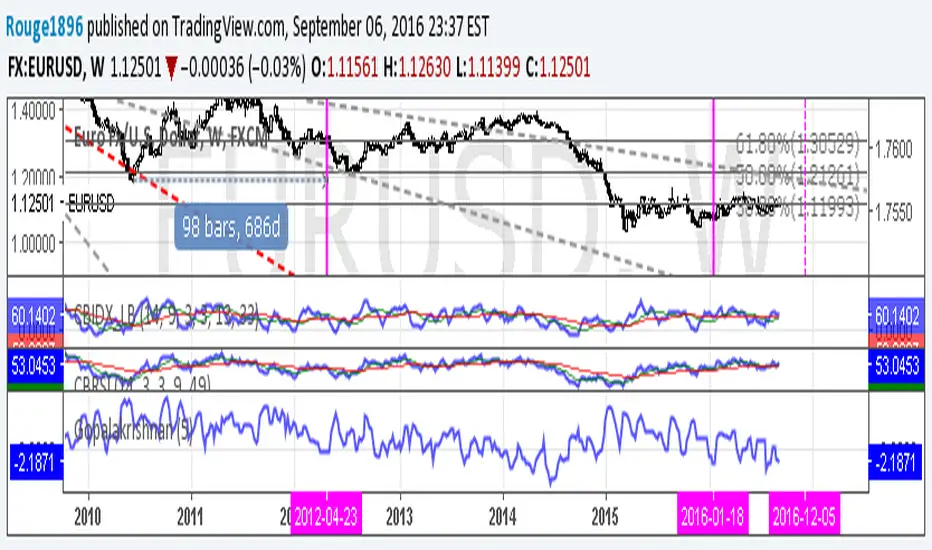
Gopalakrishnan Range Index [Rouge1896]Gopalakrishnan indicator or GAPO for short, is a measurement of market volatility.
The indicator is calculated over a set time period (default 5 days) using only price action.
Developed by Jayanthi Gopalakrishnan which is based on Mandelbrot's work, to measure the dynamic character of the financial markets.
Stochastic Momentum Index (SMI)Stochastic Momentum Index (SMI) or Stoch MTM is used to find oversold and overbought zones. It also helps to figureout whether to enter short trade or long trade.
Red Shade in the Top indicates that the stock is oversold and the Green shade in the bottom indicates overbought.
Strategy:
Enter Long once the Overbought Zone ended and there's a crossover below -35.
Exit Long once the oversold zone is ended and there's a crossover.
Enter Short once the oversold zone is ended and there's a crossover above 35.
Exit Short once the Overbought Zone ended and there's a crossover.
Backup: Always use with another indicator because there will be multiple up and down movement in one Trend.
