Ichimoku Kinko Hyo (colorblind friendly)This is the Ichimoku Kinko Hyo indicator, using colorblind friendly colors as much as possible so that every line or cloud trend can be identified more easily. It is correctly visible both in bright and dark mode.
Note: I have only tested the visibility on myself (I'm deuter), if anyone with another kind of colorblindness has issues distinguishing lines, I'll happily take any suggestion to improve this script.
Ichimokukinkohyo

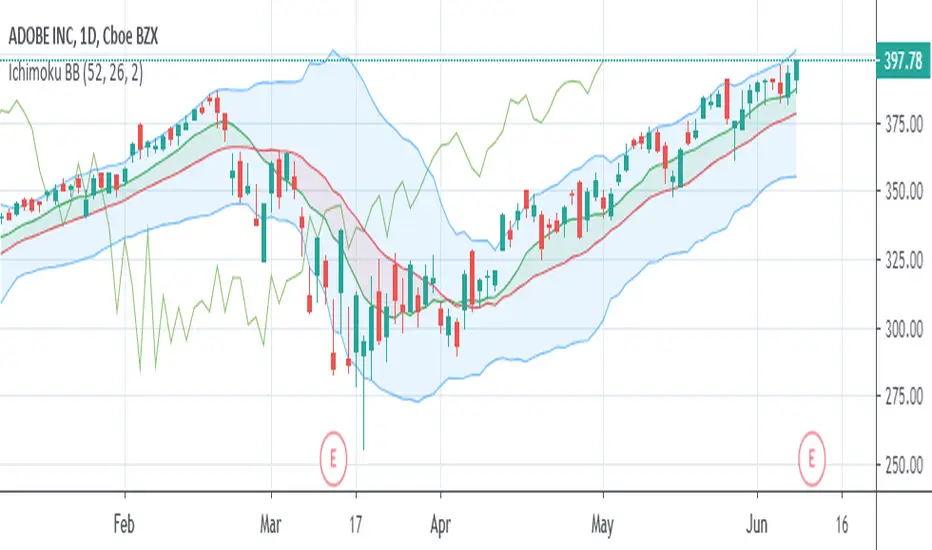
Ichimoku Bollinger BandsThis indicator is a standard set of Bollinger Bands with some functionality borrowed from Ichimoku Kinko Hyo. There's an added SMA (9) that gets shaded green when it's above the basis line of the Bollinger Bands (SMA 20) and turns red when it falls below. No, it's not remotely where the Ichimoku Cloud would appear, but it's a decent trend indicator regardless.
You also get Ichimoku's Lagging Span to help verify the strength of the trend. When the Lagging Span rises above the price history, the trend is up. When the Lagging Span rises above the Bollinger Bands, the uptrend is super strong. And the opposite conditions signal downtrends.
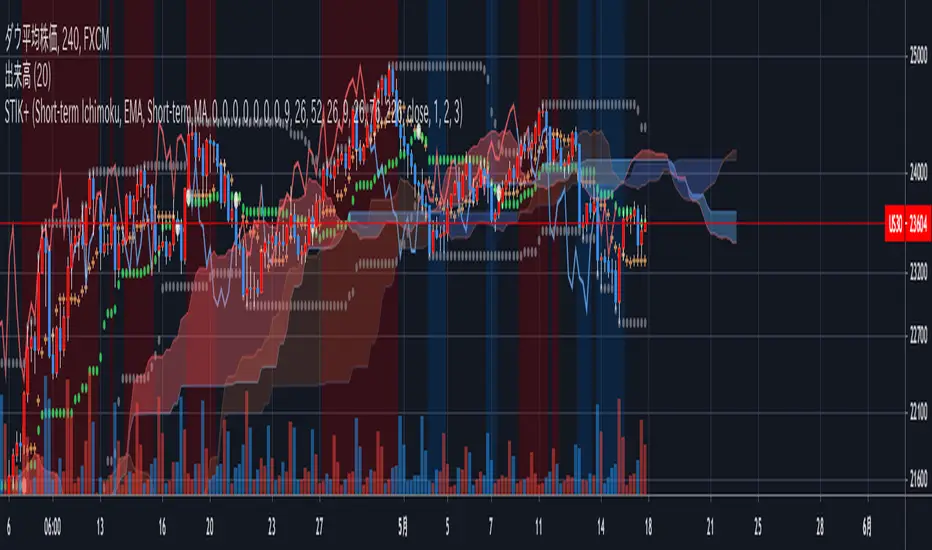
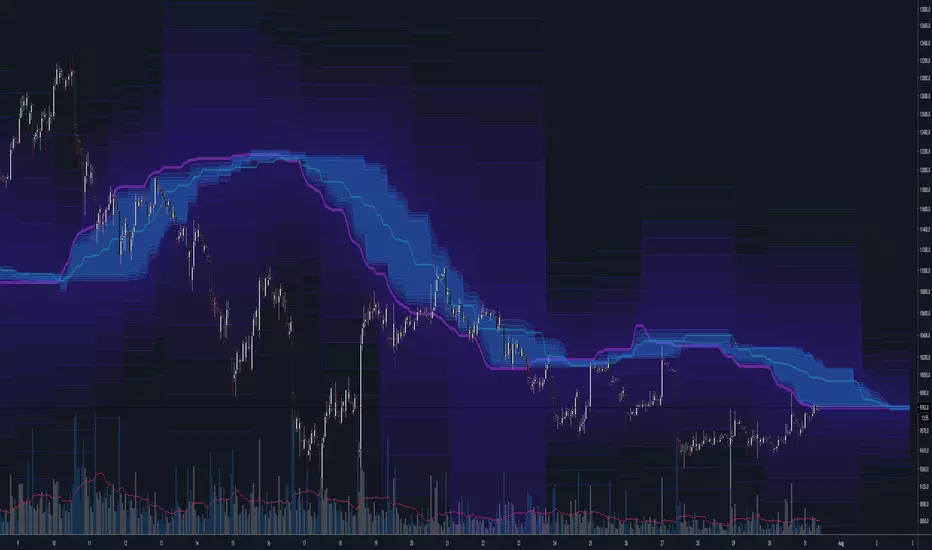
Short-Term Ichimoku Kinko-hyo+This Ichimoku Kinko-Hyo is an indicator which has been changed for short-term trading and, It has a “target price theory(one of three theory of Ichimoku Kinko-Hyo) function.”
Also, In this indicator, It can be plotting the “Span model”, “Super Bollinger Bands” which has Invented by a Japanese currency dealer Toshihiko Masaki, And Moving Average.
In addition, you can select setting only “clouds” and “Lagging span” or displaying Default Ichimoku Kinko-Hyo.
This indicator is modified original Ichimoku Kinko-Hyo, but It made based on the true usage of Ichimoku Kinko-Hyo.
For the evidence, I referred to the book supervised by Ichimoku-Sanjin the third generation.
Describe below about features↓↓↓.
- 2nd Cloud to check relation two Lead Lines and Lagging span.
- Background-color for discovering “Three Roles Improvement (In Japanese: 三役好転)” and “Three Roles Reversal (In Japanese: 三役逆転)”.
- Signal of Crossing Base Line and Conversion Line.
- mode selection of Ichimoku Kinko Hyo.
- Calculation feature for Target Price theory.
- A switch to replace Base Line and Conversion Line with 3 Moving Average lines.
- And others...
Ichimoku with Correct DisplacementThe default Ichimoku Cloud by TradingView is strange. The kumo is only displaced 25 periods forward, and the chikou is displaced 25 periods back. This is because TradingView had the correct value for displacement (26), but they decided to subtract this displacement by 1 when actually drawing the kumo and add 1 when drawing the chikou. This script fixes this and allows for easier customization of each line in the Ichimoku.

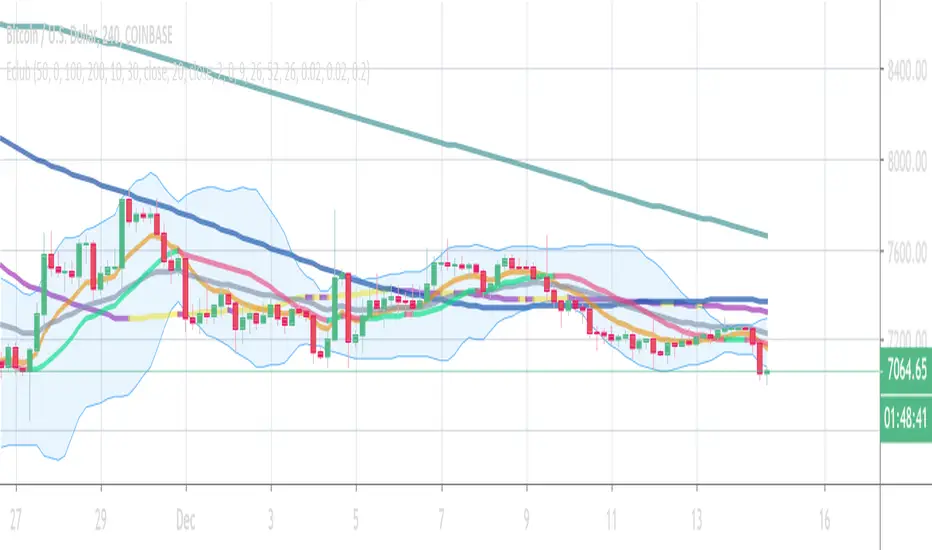
Eclub Multi IndicatorThis multi Indicator includes:
3 Moving Averages
2 Exponential Moving Averages
Bollinger Band
Ichimoku
Parabolic SAR
You can change the colors if you want. Go to setting to enable Ichimoku or SAR or disable others.
The color tolerance is by default zero which results in a very sensitive color change. You can change it to decrease the sensitivity. The value should be the last decimal of the price or the last two decimals of price etc.
If you like this indicator donate some BTC to the following address:
BTC address:
18NSD2xdJyYWoC4CSr4xg1hMk2q5cBbr8T
Ichimoku [Gu5]Original Ichimoku Kinko Hyo created by Goichi Hosoda 1930
Knowing how to interpret the Ichimoku indicator can be complicated. I hope this version is more intuitive
Use Ichimoku to determine the trend of the day
When the market is above the cloud, and Tenkan (green line) crosses over Kijun (red Line), there is a Bullish Trend . When Tenkan crosses under Kijun, the trend ends.
When the market is under the cloud, and Tenkan crosses under Kijun; There is a Bearish Trend . When Tenkan crosses over Kijun, the trend ends.
When the market crosses the cloud (orange bars), there is no trend
The default setting is 9, 26 and 52. For cryptocurrencies (24/7 market), you can change it to 10, 30 and 60 periods.
///
Ichimoku Kinko Hyo fue creado por Goichi Hosoda en 1930
Saber interpretar al indicador Ichimoku puede ser complicado. Espero esta version sea mas intuitiva
Use Ichimoku para determinar la tendencia del día, y operar solo a favor de la misma
Cuando el mercado esta sobre la nube y Tenkan (linea verde) cruza sobre Kijun (linea roja), la tendencia es alcista. Cuando Tenkan cruza bajo Kijun, termina la tendencia.
Cuando el mercado esta bajo la nube y Tenkan cruza bajo Kijun, la tendencia es bajista. Cuando Tenkan cruza sobre Kijun, termina la tendencia.
Cuando el mercado atraviesa la nube (barras naranjas), no hay tendencia
Por defecto, el seteo es 9, 26 y 52. Para criptomonedas, puede cambiarlo a 10, 30 y 60 períodos

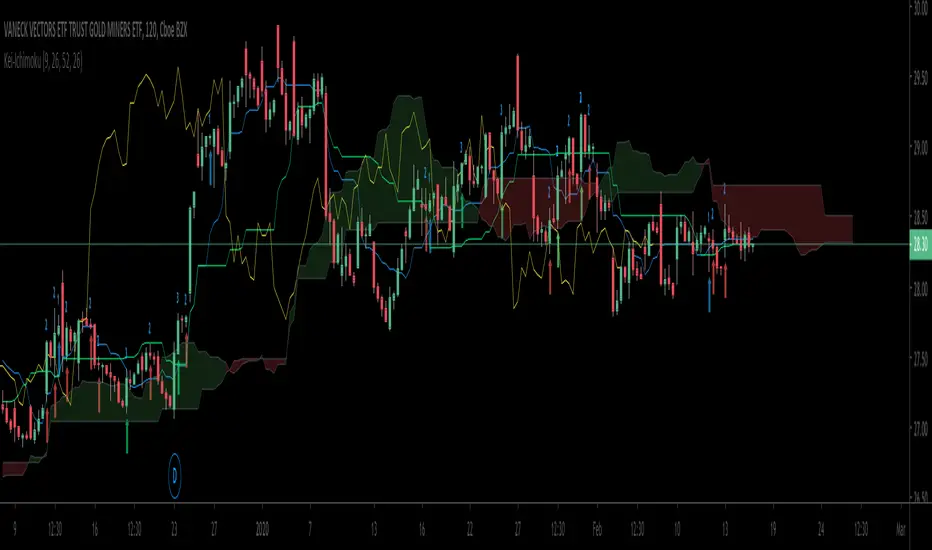
Open Source Ichimoku Kinkō hyō Keizen 改善Open Source Ichimoku Kinkō hyō Keizen 改善
First of all, thank you for using my work, making changes and continuing to share it for free.
I chose as indicator name Ichimoku Kinkō hyō Keizen logically simply by
what the word Keizen reflects a Japanese method which means continuous improvement and quality.
The goal here is to correct already any offset faults that should not be present and to try
to bring the indicator of new things that can serve and advance
and provide additional support for the decision.
A continuation will surely be planned which will bring its batch of new elements which will come
naturally be grafted to this tool.
Possibility of adding or not adding new lines Jun (76), Kan (226), Junkan A, B (676).
- Junakan To be calculated on the average of Jun / Kan 151 periods.
- Junkan B calculate over the 676 periods.
- Possibility of adding or not adding a new kinkohoyo calculate on Jun (76) and Kan (226).
- Possibility of adding or not adding a new Kumo calculate over 676 periods.
- Possibility of coloring or not the kumos or the kinkohyos.
- Possibility of adding or not Chikō 9,26,52,76,226,676.
- Ability to display or not passive lines in the future, 5 shots ahead of the movement of lines, provided that the extremes are not broken.
Thank you:
Thanks to TomQSD to have tested all the different versions of this project and to have contributed his criticism that helped me a lot to develop the tool.
Thanks to Herveo for having agreed to share his code
on the passive lines.
Remarks:
Not all options are activated at the same time.
Please do not uncheck the boxes in style, only change the colors.
To enable or disable lines, go to input parameters.
//////////////////////////////////////////////////////////////////////////////////////////////////////////////////////////////////////////////////////////////////////////////////////////////////////////////////////////////////
Open Source Ichimoku Kinkō hyō Keizen 改善
Tous d'abord, merci d'utiliser mon travail, d'apporter des modification et de continuer à le partager gratuitement.
J'ai choisi comme nom d’indicateur Ichimoku Kinkō hyō Keizen en toute logique tout simplement par
ce que le mot Keizen reflète une méthode Japonaise qui veut dire amélioration en continue et qualité.
Le but ici est de corriger déjà tout les défauts de décalage qui ne devraient pas être présents et d’essayer
d’apporter sans trop charger l’indicateur des choses nouvelles qui peuvent servir et faire progresser
et apporter une aide supplémentaire à la décision.
Une suite sera sûrement prévue qui apportera son lot d'éléments nouveaux qui viendront
naturellement se greffer à cet outil.
- Possibilité d’ajout ou non de nouvelles lignes Jun (76) , Kan (226) , Junkan A,B (676).
- Junakan A calculer sur la moyenne de Jun/Kan 151 périodes.
- Junkan B calculer sur les 676 périodes.
- Possibilité d’ajout ou non d’un nouveau kinkohoyo calculer sur le Jun (76) et le Kan (226).
- Possibilité d’ajout ou non d’un nouveau Kumo calculer sur 676 périodes.
- Possibilité de colorier ou non le ou les kumos et le ou les kinkohyos.
- Possibilité d’ajout ou non de Chikō 9,26,52,76,226,676.
- Possibilité d’afficher ou non de lignes passives dans le future, 5 coups d’avance sur les déplacement des lignes, a condition que les extrêmes ne soient pas rompu.
Remerciement :
Merci à TomQSD d'avoir tester toutes les différentes versions de ce projet et d’avoir apporter sa critique qui m'a beaucoup aidé à développer l’outil.
Merci à Herveo pour sont accord d’avoir bien voulu partager son code
sur les lignes passives.
Remarques:
Toutes les options ne sont pas toutes à activer en même temps.
Merci de ne pas décocher les cases dans style, modifiez seulement les couleurs.
Pour activer ou désactiver des lignes, allez dans paramètres en entrée.

The Rumpy CloudSimilar basic principle to Ichimoku cloud, more sophisticated implementation.
I've exposed cloud width multipliers in the setting in case anyone wants to experiment with them, there are likely to be other widths of significance.
Lots of lines so settings includes easy batch way of altering color settings.
--------------------------------------
If you find it useful please consider a tip/donation :
BTC - 3BMEXEDyWJ58eXUEALYPadbn1wwWKmf6sA
--------------------------------------
Volume Weighted Ichimoku (Cleaned Up Visuals)Ichimoku with cleaned up appearance on chart and volume-weighted highs / lows. Publishing this final version with open script.

MTF Ichimoku CloudI published it because I could not find a good MTF glance.
なかなか良いMTF一目が見つからないので公開しました。


ICHIMOKU MTFMultiple Time Frame Version of Ichimoku Kinko Hyo Indicator.
Created in 1940's by Goichi Hosoda withe the help of University students in Japan.
Ichimoku is one of the best trend following indicators that works nearly perfect in all markets and time frames.
Ichimoku is originally an built in indicator in Tradingview but there are some problems like:
the indicator hast 5 lines but you can change only 4 parameters in the settings menu of Tradingview Charts which you could only control 3 of the lines effectively. A second problem is that Tradingview preferred to use English titles for the ICHIMOKU lines instead of giving them the most common original Japanese ones. (So I rewrite the indicator)
Kijun Sen (blue line): Also called standard line or base line, this is calculated by averaging the highest high and the lowest low for the past 26 periods.
Tenkan Sen (red line): This is also known as the turning line and is derived by averaging the highest high and the lowest low for the past nine periods.
Chikou Span (Plum line): This is called the lagging line. It is today’s closing price plotted 26 periods behind.
Senkou SpanA (green line): The first Senkou line is calculated by averaging the Tenkan Sen and the Kijun Sen and plotted 26 periods ahead.
Senkou SpanB (purple line):
The second Senkou line is determined by averaging the highest high and the lowest low for the past 52 periods and plotted 26 periods ahead.
PERSONALLY I ADVISE YOU TO USE ICHIMOKU WITH DEAFULT LENGTHS (9,26,26,52,26) IN ORDER FOR STOCK MARKETS AND FOREX MARKETS
FOR CRYPTO YOU'D BETTER USE:
10,30,30,60,30 OR 20,60,60,120,60
THE TRICKY THING IS THAT KEEPING THE 1-3-3-6-3 RATIO CONSTANT IS NECESSARY
Here's a link of my Youtube video explaining ICHIMOKU but unfortunately only in TURKISH:
www.youtube.com
Developed by: Goichi Hosoda
Here's the link to a complete list of all my indicators:
tr.tradingview.com
Ichimoku kullanımı anlattığım detaylı video serisini linkten izleyebilirsiniz:
www.youtube.com
İndikatörü geliştiren: Goichi Hosoda

ULTIMATE ICHIMOKU TRADING SUITEThis is an update of "Uncle Mo's Ultimate Ichimoku V1"
Main features:
2 x Ichimoku Cloud
5 x EMA
2 x MA
1 x HullMA
Williams Fractal
Bollinger Bands - ***NEW***
ATR - ***NEW***
PSAR - ***NEW***
Candlestick Patterns - ***NEW***
Price Action Bars- ***NEW***
List of credits:
@br0qn for the Ichimoku
@RicardoSantos for the Bill Williams Fractal
@EmilianoMesa for the EMAs/MAs
@mohamed982 for the HullMA
@ymaheshreddy4u for the Bollinger Bands
@ChrisMoody for the Price Action Bars and PSAR
@HPotter for the ATR
@repo32 for the Candlestick Patterns
The script is open source and free to use. Feel free to change it around to suit your needs.
***If you copy & paste code from other traders to make your own script, please do remember to give them credit for their amazing work.***
Happy trading!

Uncle Mo's Ultimate Ichimoku V1Main features:
2 x Ichimoku Cloud
5 x EMA
2 x MA
1 x HullMA
Williams Fractals
Study is based around trader @br0qn 's Ichimoku script.
Credits also go to:
@RicardoSantos for the Bill Williams Fractals
@EmilianoMesa for the EMAs/MAs
@mohamed982 for the HullMA
The script is open source so please feel free to change it around. I'd greatly appreciate it if you could suggest ways to improve it.
Happy trading!

Gomoku_V2I tried to improve the one - step equilibrium table.
Since the original glance consisted of the middle line of the Hiroo band, something is calculated from the upper and lower lines.
Leading span A = Double the width of the HiLo band (Green 2) * (1-75 (≒ 76.4% return)), the central complex clouds only changed the expression at a glance.
It is unified to shift all lines at first glance by 25. The old lagging span was renamed to the preceding price span.
You can use the first line of conversion line and reference line with the combination of the preceding conversion line, the preceding reference line and the preceding price span.
The part surrounded by the preceding conversion line and the preceding reference line is defined as rain cloud.
The leading span B is the interpretation of the rain cloud and the effective value of the cloud.
(the width of the reference line and the leading span A) ÷ The width of the rain cloud is like the intensity of the cloud.
Rain clouds have the same properties as clouds, and the twisted parts are weak.
When the type of cloud and rain cloud are different, it is countervailing and resistance seems to be weak.
Even when the width of the leading span A and the leading reference line is narrow, the resistance seems to be weak.
It seems there are clouds above and below as well because it was the motivation for development so there are two clouds each above and below. The clouds are five (although it is actually six) so it is the fifth grade.
It should normally be bounced back in the green zone.
There is a red zone for abnormal price fluctuations.
It seems that the upper and lower clouds only bounce back toward the center.
If you are not satisfied with price movements overall it seems that you are in the range market, often breaking through for the passage of time.
Update Ver 2.0
integrate MTF amagumo
Devices of color arrangement
The resistance is strong where the cloud color is thin.
It should be weak as the force is canceled as much as it is black.
Batch display option for each part
Specealthanks
Ichimoku kinkou hyou
KazmaxFAN Club # Place for technical discussion
一目均衡表を改良してみました。
元の一目はハイローバンドの中線から構成されていたので、上下の線から何かを算出しています。
先行スパンA=ハイローバンドの幅の2倍(Green2)*(1-75(≒76.4%戻し)) という発見により、中央の複雑な雲は一目の表現を変えるだけにしました。
一目の線は全て25前にずらすのに統一です。旧遅行スパンは先行価格スパンに改名しました。
先行転換線と先行基準線と先行価格スパンの組み合わせで一目の転換線と基準線の使い方が出来ます。
先行転換線と先行基準線で囲まれた部分は雨雲と定義。
先行スパンBは雨雲と雲の実効値という解釈です。
(基準線と先行スパンAの幅)÷雨雲の幅が雲の強度という感じです。
雨雲も雲と同じ性質を持っていて、ねじれた部分は弱いぽいです。
雲と雨雲の種類が異なる時は打ち消しあって抵抗が弱いようです。
先行スパンAと先行基準線の幅が狭い時も抵抗が弱いようです。
上下にも雲があるように思えたのが開発の動機だったので上下に各2本雲があります。雲が5本(本当は6本ですが)だから五目です。
通常はグリーンゾーンで跳ね返されるはずです。
異常な価格変動用にレッドゾーンがあります。
上下の雲は中央に向けて跳ね返すくらいしかしないようです。
全体的に価格移動に困ればレンジ相場になって、時間の経過で強行突破することが多いように見えます。
Update Ver2.0
MTF amagumoを統合
配色を工夫
雲の色が薄い所は抵抗が強いです。
黒い所ほど力が打ち消しあって弱いはずです。
各パーツごとに一括表示オプション
Specealthanks
一目均衡表
KazmaxFAN倶楽部 #テクニカル議論の場


Chinkou_ProWelcome traders,
I have made this script wishing a higher gain,
Originally, this strategy is taken from Ichimoku Kinko Hyo
Simply:
ChinkouPro crossing with price is giving a clear opportunity.
Review it, master it, work it.
first version
change log
Delete function of lazy trader { smooth candle }
Delete function of alert , { make alert from chart it's better }
Enjoy with it , and contact me for any reason :)
