Inverted Yield Curve with VIX Fear IndexUS 2 year and US 10 year comparison, inverted yield curve with VIX. I use this on a weekly chart with 2 moving averages, the 40 week (ma200 daily) and the 520 week (10 year median).
The bottom histogram is the VIX and the plot is the yield curve. When the VIX is above a certain level (you can set it in settings) and the ýield curve is close to or at inversion the background goes red.
The last seven recessions were preceded by an inverted yield curve. Here I combined the two main fear indexes, the VIX and the run for safe US treasuries (Inverted Yield Curve).
This is preset to the 2 year and 10 year US bond, weekly, and the normal VIX ticker but you can set it to whatever you like.
Published with source code for anyone to modify. Please comment below if you do so! This is the second in a series of indicators I intend to publish as a package of economic recoverty/recession symptom indicators.
Follow me for updates, next one up is commodities with dr Copper and oil!
Historical Volatility

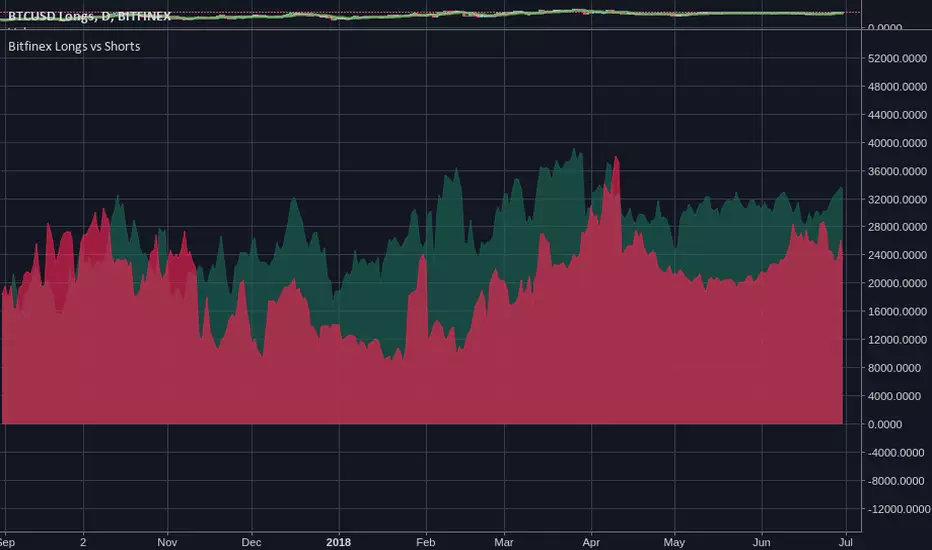
Bitfinex Longs vs Shortssexy view of the current long/short positions on Bitfinex. I saw some pay-for, hidden-source-code version of this and thought: "oh man."
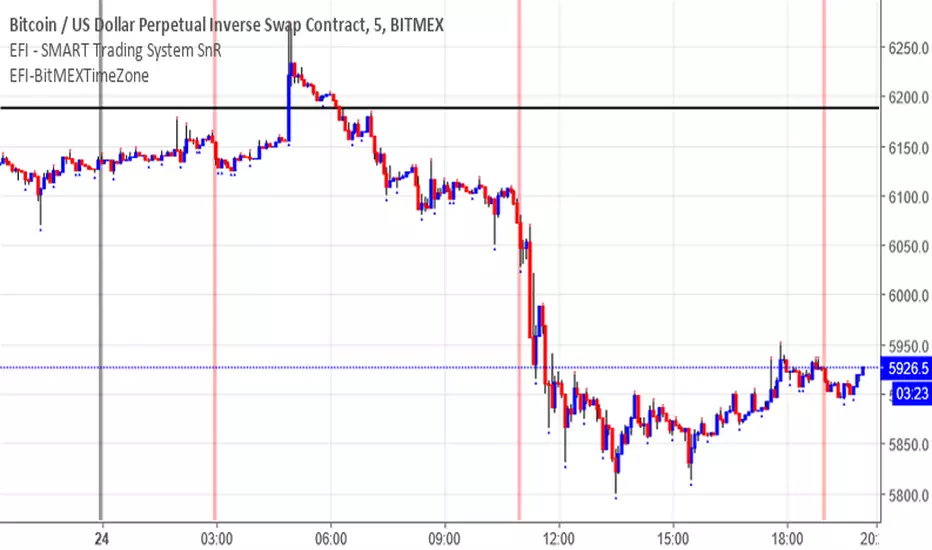
EFI-BitMEXTimeZone//EFI - SMART Trading System
//This is an invite and private SMART Trading System for EFI 0.00% (Edukasi Finansial Internasional) group members.
//Risk Disclosure :
//Futures, Forex, Stock, Crypto and Derivative trading contains substantial risk and is not for every investor.
//An investor could potentially lose all or more than the initial investment.
//We are not responsible for any financial losses you may incur by using this script!

Toby Crabel's narrow range with historical volatility1. Find bar with the smallest narrow range for a chosen period. Use hvol for filter.
2. Place stop-order for long position at previous high and stop-order for short at previous low to catch breakout in any direction.
3. Take profit on the next bar.

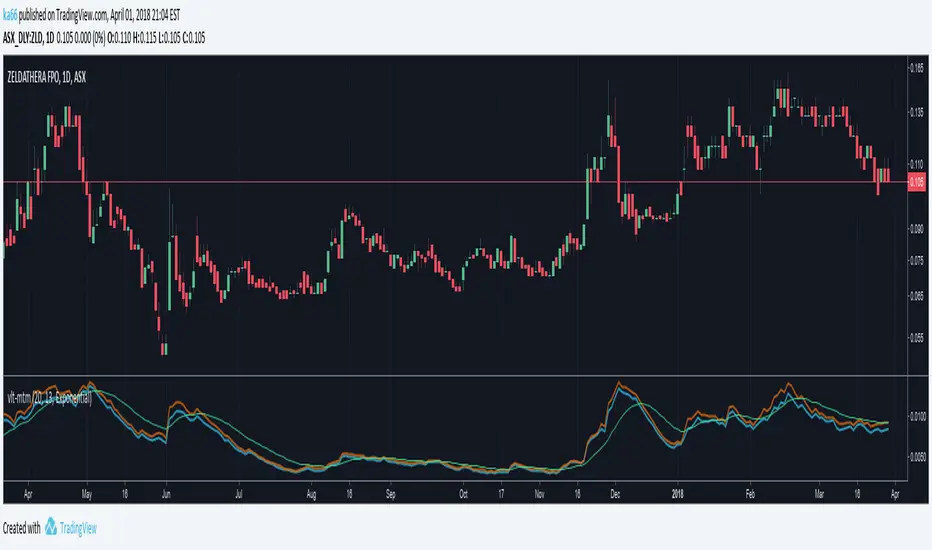
ka66: Volatility MomentumThis is a 'monitoring' indicator to see if an instrument is viable enough to be traded, by virtue of volatility (or lack of volatility in context may lead to a break out), or may become so. It shows the following information:
Price Range (high - low) averaged across a set of bars: Useful gauging potential trading profits. This was its initial goal, to not measure bars manually!
ATR : As a comparison point for the price range above. Divergence between true range (TR) and plain price range might signal volatility changes occurring in the instrument.
Signal volatility line : a moving average of the larger of the average price range and ATR. This takes inspiration from other indicators like MACD and Stochastic, and is a way of comparing change in recent volatility --- this achieves the momentum part. The larger was chosen to keep things simple, and not have a signal line per range!
avgRange = movingAvg(high - low, avgPeriod)
atr = movingAvg(trueRange, avgPeriod)
signal = movingAvg(max(avgRange, atr), avgPeriod)
Configurable periods and averaging mechanism.
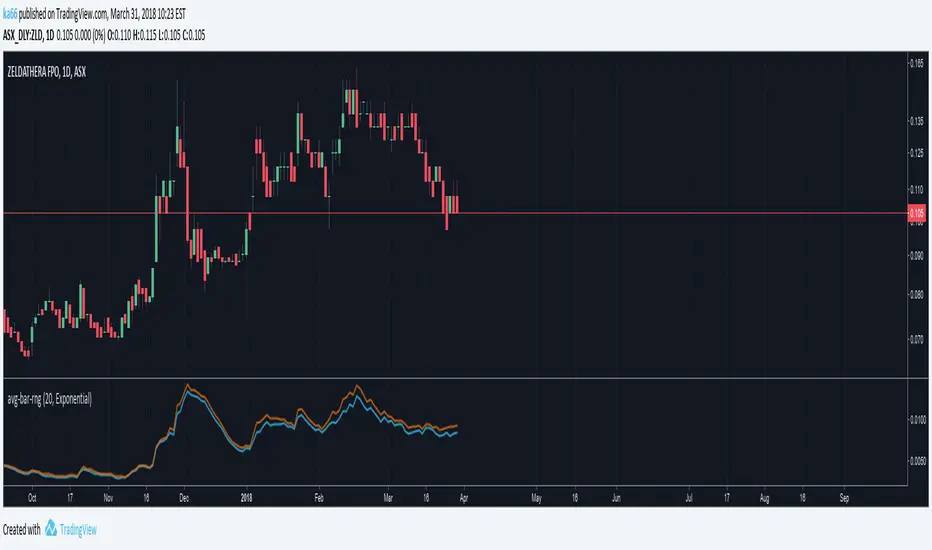
ka66: Average Bar RangeAverages price ranges (high - low) across a set of bars in a given timeframe. Additionally, also plots the Average True Range (ATR) as a better comparison for volatility.
Configurable period and averaging mechanism.
Useful for gauging minimum profits and price movement over a period, a filter for historical volatility.
Furthermore, executing trades is better done with channels like ATR/Keltner channels, or Bollinger Bands.
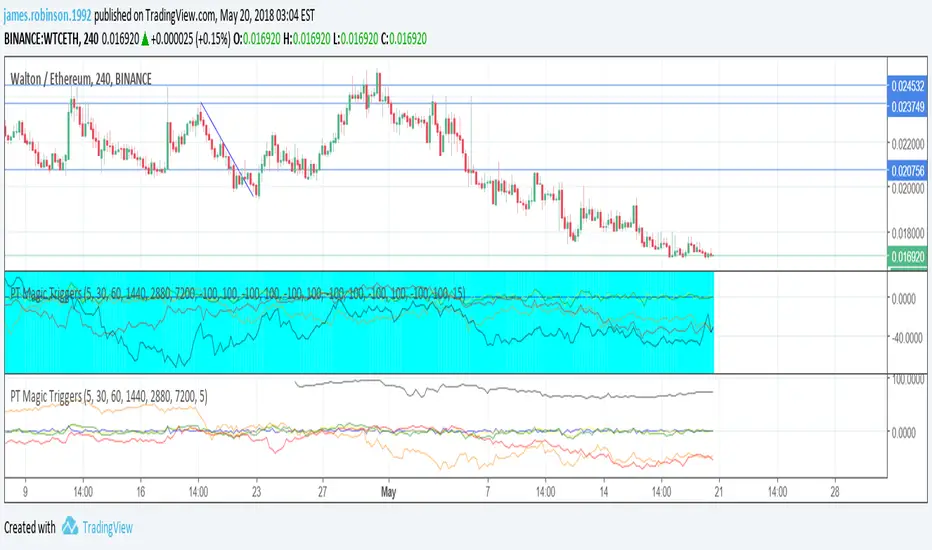
1min_&15min_Crypto_indicatorDear users,
This indicator used Fibonacci, MACD, RSI and Volume.
You just need to consider the "B" signal for Buy and "S" for sell your position...
Color candles stick are just here to confirm the position and use different setting less risky than B and S signals.
If you want to use the maximal potential of this indicator to buy and sell correctly I suggest you to buy and sell with B and S signal and to cut your position to the next B and S signal. You can also choose to cut your position to the next candle stick color... for less risky.
The backtesting of this indicator is 73.6% of good trades on 15 min candlestick and 81,6% on 1 minute candlesticks on BTCUSD. Same indicator is available for equities. (Min&15min_Equity_indactor_V14_Moriceau)
If you have any comment, let me know.


Volatility IndexWhat is volatility and why does it matter?
Volatility is a measure of how much the price of an asset varies over time.
Volatility refers to the amount of uncertainity or risk about the size of changes in a finacial asset's value. A higher volatility means that the price of the asset can change dramatically over a short time period in either direction.
A lower volatility means that a financial asset's value does not fluctuate dramatically, but changes in value at a steady pace over a period of time.
How does the volatility gets calculated?
It uses the standard deviation of the closing price for the preceding selected period (i.e. 30, 60...) and plots the value in relative terms (%).

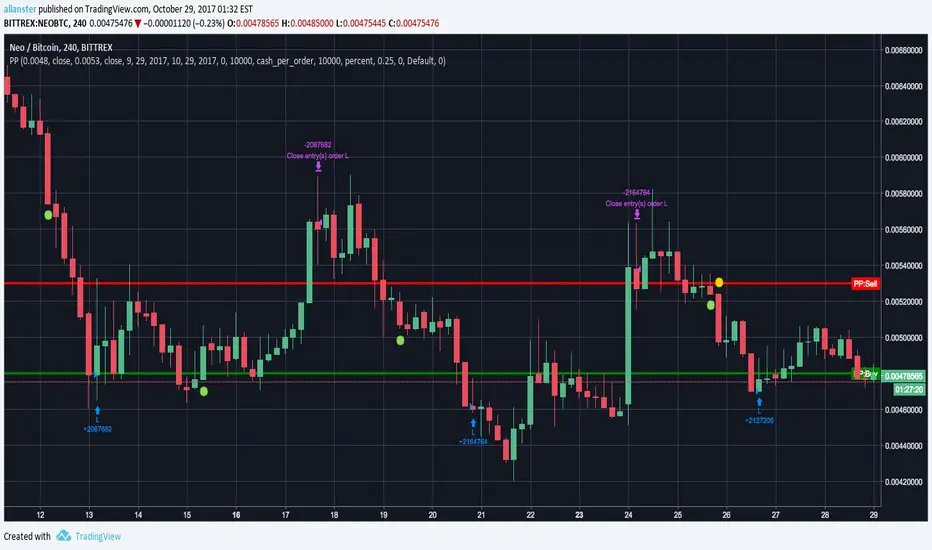
Gunbot PingPongSimulation of Gunbot PingPong strategy useful for fine tuning settings and backtesting. First load the instrument and chart period you are wanting to trade and note the general low and high prices. You will need these for "dialing in" your PingPong Buy and Sell prices once you load the indicator. Defaults are set for current USDT-BTC prices.
In Pine Editor -> Open "Gunbot PingPong" -> Add To Chart -> On Indicator -> Format -> Input your desired settings to test.
Red = PingPong Sell Price
Green = PingPong Buy Price
NOTICE: By requesting access to this script you acknowledge that you have read and understood that this is for research purposes only and I am not responsible for any financial losses you may incur by using this script!


OHLC Volatility Estimators by @Xel_arjonaDISCLAIMER:
The Following indicator/code IS NOT intended to be a formal investment advice or recommendation by the author, nor should be construed as such. Users will be fully responsible by their use regarding their own trading vehicles/assets.
The embedded code and ideas within this work are FREELY AND PUBLICLY available on the Web for NON LUCRATIVE ACTIVITIES and must remain as is by Creative-Commons as TradingView's regulations. Any use, copy or re-use of this code should mention it's origin as it's authorship.
WARNING NOTICE!
THE INCLUDED FUNCTION MUST BE CONSIDERED AS DEBUGING CODE The models included in the function have been taken from openly sources on the web so they could have some errors as in the calculation scheme and/or in it's programatic scheme. Debugging are welcome.
WHAT'S THIS?
Here's a full collection of candle based (compressed tick) Volatility Estimators given as a function, openly available for free, it can print IMPLIED VOLATILITY by an external symbol ticker like INDEX:VIX.
Models included in the volatility calculation function:
CLOSE TO CLOSE: This is the classic estimator by rule, sometimes referred as HISTORICAL VOLATILITY and is the must common, accepted and widely used out there. Is based on traditional Standard Deviation method derived from the logarithm return of current close from yesterday's.
ELASTIC WEIGHTED MOVING AVERAGE: This estimator has been used by RiskMetriks®. It's calculation is based on an ElasticWeightedMovingAverage Standard Deviation method derived from the logarithm return of current close from yesterday's. It can be viewed or named as an EXPONENTIAL HISTORICAL VOLATILITY model.
PARKINSON'S: The Parkinson number, or High Low Range Volatility, developed by the physicist, Michael Parkinson, in 1980 aims to estimate the Volatility of returns for a random walk using the high and low in any particular period. IVolatility.com calculates daily Parkinson values. Prices are observed on a fixed time interval. n=10, 20, 30, 60, 90, 120, 150, 180 days.
ROGERS-SATCHELL: The Rogers-Satchell function is a volatility estimator that outperforms other estimators when the underlying follows a Geometric Brownian Motion (GBM) with a drift (historical data mean returns different from zero). As a result, it provides a better volatility estimation when the underlying is trending. However, this Rogers-Satchell estimator does not account for jumps in price (Gaps). It assumes no opening jump. The function uses the open, close, high, and low price series in its calculation and it has only one parameter, which is the period to use to estimate the volatility.
YANG-ZHANG: Yang and Zhang were the first to derive an historical volatility estimator that has a minimum estimation error, is independent of the drift, and independent of opening gaps. This estimator is maximally 14 times more efficient than the close-to-close estimator.
LOGARITHMIC GARMAN-KLASS: The former is a pinescript transcript of the model defined as in iVolatility . The metric used is a combination of the overnight, high/low and open/close range. Such a volatility metric is a more efficient measure of the degree of volatility during a given day. This metric is always positive.


Historical Volatility Strategy Backtest Strategy buy when HVol above BuyBand and close position when HVol below CloseBand.
Markets oscillate from periods of low volatility to high volatility
and back. The author`s research indicates that after periods of
extremely low volatility, volatility tends to increase and price
may move sharply. This increase in volatility tends to correlate
with the beginning of short- to intermediate-term moves in price.
They have found that we can identify which markets are about to make
such a move by measuring the historical volatility and the application
of pattern recognition.
The indicator is calculating as the standard deviation of day-to-day
logarithmic closing price changes expressed as an annualized percentage.
Please, use it only for learning or paper trading. Do not for real trading.

Historical Volatility based Standard Deviation_V2This Plots the Standard Deviation Price Band based on the Historical Volatility. SD 1, 2, 3.
Version update:
Fixed the Standard Deviation mistake on Version 1.
Added Smoothing Options for those who prefer a less choppy version.
Standard Deviation 3 plot is not set to Default

Historical Volatility based Standard DeviationThis Plots the Standard Deviation Price Band based on the Historical Volatility. SD 1, 2, 3.
List of All my Indicators - www.tradingview.com

Historical Volatility Strategy Strategy buy when HVol above BuyBand and close position when HVol below CloseBand.
Markets oscillate from periods of low volatility to high volatility
and back. The author`s research indicates that after periods of
extremely low volatility, volatility tends to increase and price
may move sharply. This increase in volatility tends to correlate
with the beginning of short- to intermediate-term moves in price.
They have found that we can identify which markets are about to make
such a move by measuring the historical volatility and the application
of pattern recognition.
The indicator is calculating as the standard deviation of day-to-day
logarithmic closing price changes expressed as an annualized percentage.

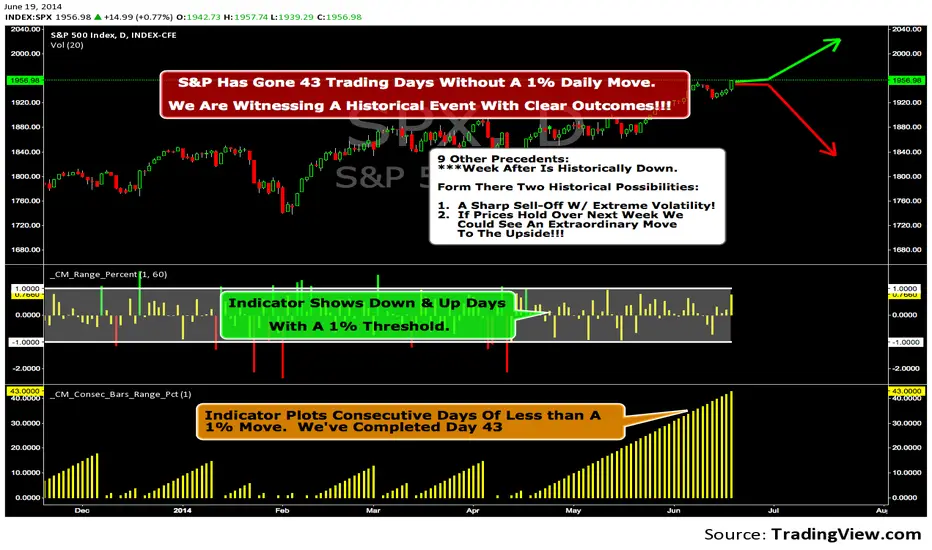
We Are Witnessing A Historical Event With A Clear Outcome!!!"Full Disclosure: I came across this information from www.SentimenTrader.com
I have no financial affiliation…They provide incredible statistical facts on
The General Market, Currencies, and Futures. They offer a two week free trial.
I Highly Recommend.
The S&P 500 has gone 43 trading days without a 1% daily move, up or down.
which is the equivalent of two months and one day in trading days.
During this stretch, the S&P has gained more than 4%,
and it has notched a 52-week high recently as well.
Since 1952, there were nine other precedents. All of
these went 42 trading days without a 1% move, all of
them saw the S&P gain at least 4% during their streaks,
and all of them saw the S&P close at a 52-week highs.
***There was consistent weakness a week later, with only three
gainers, and all below +0.5%.
***After that, stocks did better, often continuing an Extraordinary move higher.
Charts can sometimes give us a better nuance than
numbers from a table, and from the charts we can see a
general pattern -
***if stocks held up well in the following
weeks, then they tended to do extremely well in the
months ahead.
***If stocks started to stumble after this two-
month period of calm, however, then the following months
tended to show a lot more volatility.
We already know we're seeing an exceptional market
environment at the moment, going against a large number
of precedents that argued for weakness here, instead of
the rally we've seen. If we continue to head higher in
spite of everything, these precedents would suggest that
we're in the midst of something that could be TRULY EXTRAORDINARY.
Statistical Volatility - Extreme Value Method This indicator used to calculate the statistical volatility, sometime
called historical volatility, based on the Extreme Value Method.
Please use this link to get more information about Volatility.
