Expected Move w/ Volatility Panel (advanced) [Loxx]This indicator shows the expected range of movement of price given the assumption that price is log-normally distributed. This includes 3 multiples of standard deviation and 1 user selected level input as a multiple of standard deviation. Expected assumes that volatility remains static on the next bar. In reality, this may or may not be the case, so use caution when making broad assumptions about the levels shown when using this indicator. However, these levels match the same levels on Loxx's backtests and Multi-Panel indicator. These static levels are used as the take profit targets and stoploss on all Loxx's scripts previously posted.
This indicator can be be used on all timeframes, but the internal timeframe must be higher than the current timeframe or an error is thrown. The purpose for internal MTF is so that you can track the deviation range from higher timeframes on lower timeframes. When "current bar" is selected, this indicator will change with live prices changes. This is useful if you wish to enter a trade before the current bar closes and need to know the deviation ranges before the close. Current bar is also useful to see the past ranges of literally that bar. When "past bar" is selected, then the values shown on the current bar are values that were calculated on the last bar. The previous bar setting is useful to track price changes with the assumption that you entered a trade at the close of the previous bar. The default set to the previous bar. (careful, this default setting won't match Loxx's Muti-Panel tool since the Multi-Panel is built using the current bar. To make them match, you must change this setting to current bar)
I've included the ability for you to smooth the output around a moving average. Included are Loxx's Moving Averages. There are 41 to choose from. See more details here:
Smoothing applied yielding Keltner Channels
Also included are various UI options to manipulate line styling and colors.
Volatility Panel
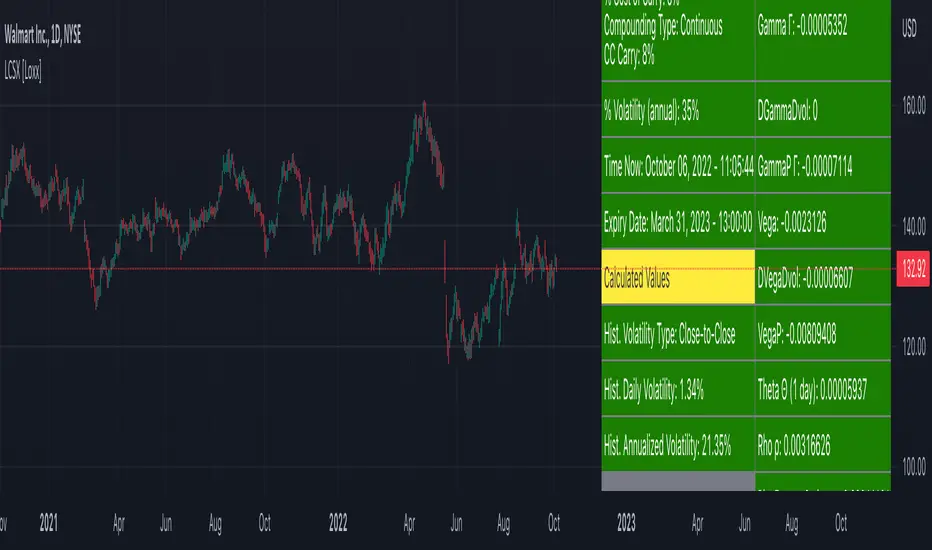
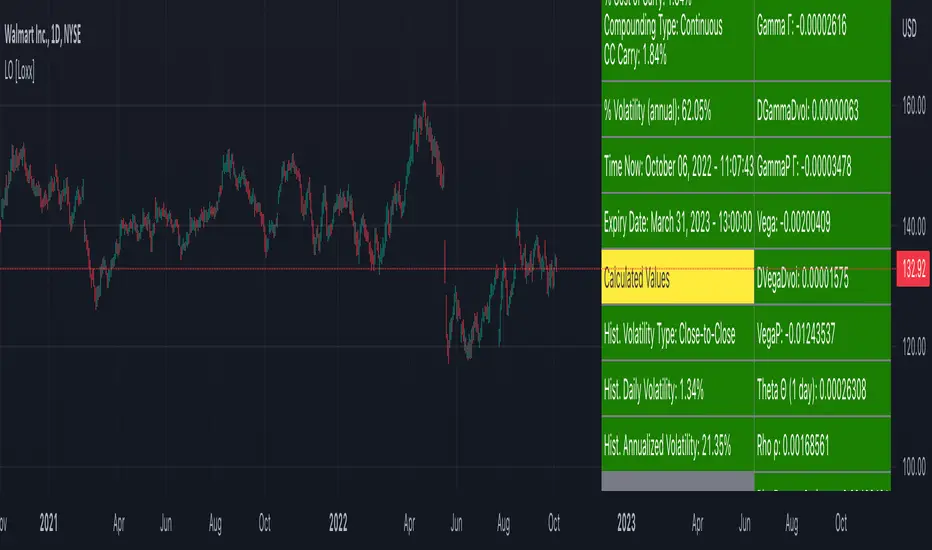
Shows information about user selected volatility included confidence range of the chosen volatility. The following volatility types are included with additional volatility types to added in future releases.
Close-to-Close
Close-to-Close volatility is a classic and most commonly used volatility measure, sometimes referred to as historical volatility .
Volatility is an indicator of the speed of a stock price change. A stock with high volatility is one where the price changes rapidly and with a bigger amplitude. The more volatile a stock is, the riskier it is.
Close-to-close historical volatility calculated using only stock's closing prices. It is the simplest volatility estimator. But in many cases, it is not precise enough. Stock prices could jump considerably during a trading session, and return to the open value at the end. That means that a big amount of price information is not taken into account by close-to-close volatility .
Despite its drawbacks, Close-to-Close volatility is still useful in cases where the instrument doesn't have intraday prices. For example, mutual funds calculate their net asset values daily or weekly, and thus their prices are not suitable for more sophisticated volatility estimators.
Parkinson
Parkinson volatility is a volatility measure that uses the stock’s high and low price of the day.
The main difference between regular volatility and Parkinson volatility is that the latter uses high and low prices for a day, rather than only the closing price. That is useful as close to close prices could show little difference while large price movements could have happened during the day. Thus Parkinson's volatility is considered to be more precise and requires less data for calculation than the close-close volatility .
One drawback of this estimator is that it doesn't take into account price movements after market close. Hence it systematically undervalues volatility . That drawback is taken into account in the Garman-Klass's volatility estimator.
Garman-Klass
Garman Klass is a volatility estimator that incorporates open, low, high, and close prices of a security.
Garman-Klass volatility extends Parkinson's volatility by taking into account the opening and closing price. As markets are most active during the opening and closing of a trading session, it makes volatility estimation more accurate.
Garman and Klass also assumed that the process of price change is a process of continuous diffusion (geometric Brownian motion). However, this assumption has several drawbacks. The method is not robust for opening jumps in price and trend movements.
Despite its drawbacks, the Garman-Klass estimator is still more effective than the basic formula since it takes into account not only the price at the beginning and end of the time interval but also intraday price extremums.
Researchers Rogers and Satchel have proposed a more efficient method for assessing historical volatility that takes into account price trends. See Rogers-Satchell Volatility for more detail.
Rogers-Satchell
Rogers-Satchell is an estimator for measuring the volatility of securities with an average return not equal to zero.
Unlike Parkinson and Garman-Klass estimators, Rogers-Satchell incorporates drift term (mean return not equal to zero). As a result, it provides a better volatility estimation when the underlying is trending.
The main disadvantage of this method is that it does not take into account price movements between trading sessions. It means an underestimation of volatility since price jumps periodically occur in the market precisely at the moments between sessions.
A more comprehensive estimator that also considers the gaps between sessions was developed based on the Rogers-Satchel formula in the 2000s by Yang-Zhang. See Yang Zhang Volatility for more detail.
Yang-Zhang
Yang Zhang is a historical volatility estimator that handles both opening jumps and the drift and has a minimum estimation error.
We can think of the Yang-Zhang volatility as the combination of the overnight (close-to-open volatility ) and a weighted average of the Rogers-Satchell volatility and the day’s open-to-close volatility . It considered being 14 times more efficient than the close-to-close estimator.
Garman-Klass-Yang-Zhang
Garman Klass is a volatility estimator that incorporates open, low, high, and close prices of a security.
Garman-Klass volatility extends Parkinson's volatility by taking into account the opening and closing price. As markets are most active during the opening and closing of a trading session, it makes volatility estimation more accurate.
Garman and Klass also assumed that the process of price change is a process of continuous diffusion (geometric Brownian motion). However, this assumption has several drawbacks. The method is not robust for opening jumps in price and trend movements.
Despite its drawbacks, the Garman-Klass estimator is still more effective than the basic formula since it takes into account not only the price at the beginning and end of the time interval but also intraday price extremums.
Researchers Rogers and Satchel have proposed a more efficient method for assessing historical volatility that takes into account price trends. See Rogers-Satchell Volatility for more detail.
Exponential Weighted Moving Average
The Exponentially Weighted Moving Average (EWMA) is a quantitative or statistical measure used to model or describe a time series. The EWMA is widely used in finance, the main applications being technical analysis and volatility modeling.
The moving average is designed as such that older observations are given lower weights. The weights fall exponentially as the data point gets older – hence the name exponentially weighted.
The only decision a user of the EWMA must make is the parameter lambda. The parameter decides how important the current observation is in the calculation of the EWMA. The higher the value of lambda, the more closely the EWMA tracks the original time series.
Standard Deviation of Log Returns
This is the simplest calculation of volatility . It's the standard deviation of ln(close/close(1))
Pseudo GARCH(2,2)
This is calculated using a short- and long-run mean of variance multiplied by θ.
θavg(var ;M) + (1 − θ) avg (var ;N) = 2θvar/(M+1-(M-1)L) + 2(1-θ)var/(M+1-(M-1)L)
Solving for θ can be done by minimizing the mean squared error of estimation; that is, regressing L^-1var - avg (var; N) against avg (var; M) - avg (var; N) and using the resulting beta estimate as θ.
Average True Range
The average true range (ATR) is a technical analysis indicator, introduced by market technician J. Welles Wilder Jr. in his book New Concepts in Technical Trading Systems, that measures market volatility by decomposing the entire range of an asset price for that period.
The true range indicator is taken as the greatest of the following: current high less the current low; the absolute value of the current high less the previous close; and the absolute value of the current low less the previous close. The ATR is then a moving average, generally using 14 days, of the true ranges.
True Range Double
A special case of ATR that attempts to correct for volatility skew.
Chi-squared Confidence Interval:
Confidence interval of volatility is calculated using an inverse CDF of a Chi-Squared Distribution. You can change the volatility input used to either realized, upper confidence interval, or lower confidence interval. This is included in case you'd like to see how far price can extend if volatility hits it's upper or lower confidence levels. Generally, you'd just used realized volatility , so I wouldn't change this setting.
Inverse CDF of a Chi-Squared Distribution
The chi-square distribution is a one-parameter family of curves. The parameter ν is the degrees of freedom.
The icdf of the chi-square distribution is
x=F^−1(p∣ν) = {x:F(x∣ν) = p}
where
p=F(x∣ν)= ∫ (t^(v-2)/2 * e^t/2) / (2^(v/2) / Γ(v/2))
ν is the degrees of freedom, and Γ( · ) is the Gamma function. The result p is the probability that a single observation from the chi-square distribution with ν degrees of freedom falls in the interval .
Related Indicators
Multi-Panel: Trade-Volatility-Probability
Variety Distribution Probability Cone
Historical Volatility

Implied Volatility Suite (TG Fork)Displays the Implied Volatility, which is usually calculated from options, but here is calculated indirectly from spot price directly, either using a model or model-free using the VIXfix.
The model-free VIXfix based approach can detect times of high volatility, which usually coincides with panic and hence lowest prices. Inversely, the model-based approach can detect times of highest greed.
Forked and updated by Tartigradia to fix some issues in the calculations, convert to pinescript v5 and reverse engineered to reproduce the "Implied Volatility Rank & Model Free IVR" indicator by the same author (but closed source) and allow to plot both model-based and model-free implied volatilities simultaneously.
If you like this indicator, please show the original author SegaRKO some love:
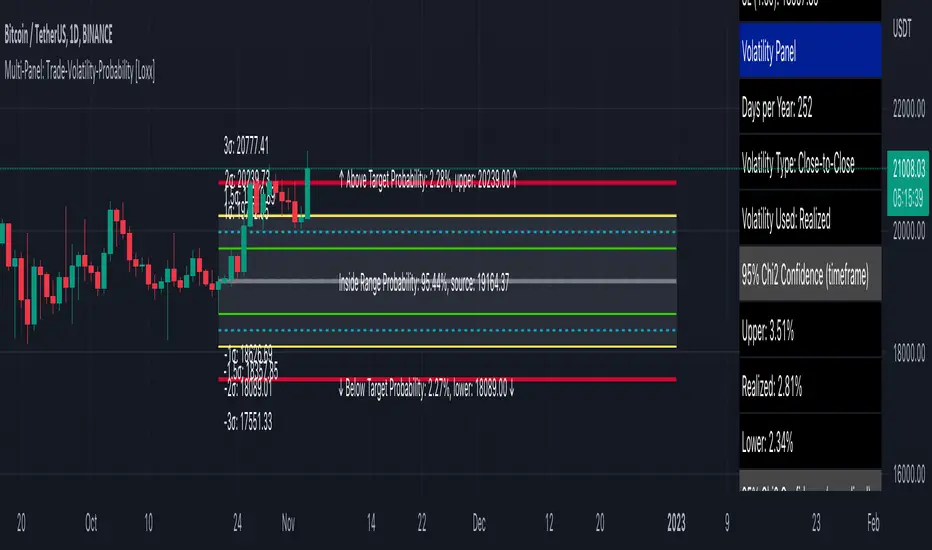
Multi-Panel: Trade-Volatility-Probability [Loxx]Multi-Panel: Trade-Volatility-Probability shows user selected and volatility-based price levels and probabilities on the chart. This is useful for both options and all styles of up/down trading methods that rely on volatility.
Trading Panel: Shows trading information to take profits and stop-loss based on multiples of volatility. Also shows equity inputs by the user to calculate optimal position size
Key things to note about the Trading Panel
-Trade side: Long or short. you change this this to change the take profit and SL levels in displayed on the table to be used w/ up/down trading styles that rely on volatility stops
-Account size: User enters total balance available for trade
-Risk: Total % of account size you're willing to lose should the SL be hit
-Position size: Size of the position given the SL and your preferred Risk
-Take profit/Stop loss levels: Based on multipliers selected by the user in settings. These shouldn't be changed unless you really know what you're doing with volatility stops
-Entry: Source price. can be 1 of 37 different prices. See Loxx's Expanded Source Types:
Volatility Panel: Shows information about the volatility the user selected to be used to take profit/stop-loss/range calculations. Volatility types included are:
Close-to-Close
Close-to-Close volatility is a classic and most commonly used volatility measure, sometimes referred to as historical volatility .
Volatility is an indicator of the speed of a stock price change. A stock with high volatility is one where the price changes rapidly and with a bigger amplitude. The more volatile a stock is, the riskier it is.
Close-to-close historical volatility calculated using only stock's closing prices. It is the simplest volatility estimator. But in many cases, it is not precise enough. Stock prices could jump considerably during a trading session, and return to the open value at the end. That means that a big amount of price information is not taken into account by close-to-close volatility .
Despite its drawbacks, Close-to-Close volatility is still useful in cases where the instrument doesn't have intraday prices. For example, mutual funds calculate their net asset values daily or weekly, and thus their prices are not suitable for more sophisticated volatility estimators.
Parkinson
Parkinson volatility is a volatility measure that uses the stock’s high and low price of the day.
The main difference between regular volatility and Parkinson volatility is that the latter uses high and low prices for a day, rather than only the closing price. That is useful as close to close prices could show little difference while large price movements could have happened during the day. Thus Parkinson's volatility is considered to be more precise and requires less data for calculation than the close-close volatility.
One drawback of this estimator is that it doesn't take into account price movements after market close. Hence it systematically undervalues volatility. That drawback is taken into account in the Garman-Klass's volatility estimator.
Garman-Klass
Garman Klass is a volatility estimator that incorporates open, low, high, and close prices of a security.
Garman-Klass volatility extends Parkinson's volatility by taking into account the opening and closing price. As markets are most active during the opening and closing of a trading session, it makes volatility estimation more accurate.
Garman and Klass also assumed that the process of price change is a process of continuous diffusion (geometric Brownian motion). However, this assumption has several drawbacks. The method is not robust for opening jumps in price and trend movements.
Despite its drawbacks, the Garman-Klass estimator is still more effective than the basic formula since it takes into account not only the price at the beginning and end of the time interval but also intraday price extremums.
Researchers Rogers and Satchel have proposed a more efficient method for assessing historical volatility that takes into account price trends. See Rogers-Satchell Volatility for more detail.
Rogers-Satchell
Rogers-Satchell is an estimator for measuring the volatility of securities with an average return not equal to zero.
Unlike Parkinson and Garman-Klass estimators, Rogers-Satchell incorporates drift term (mean return not equal to zero). As a result, it provides a better volatility estimation when the underlying is trending.
The main disadvantage of this method is that it does not take into account price movements between trading sessions. It means an underestimation of volatility since price jumps periodically occur in the market precisely at the moments between sessions.
A more comprehensive estimator that also considers the gaps between sessions was developed based on the Rogers-Satchel formula in the 2000s by Yang-Zhang. See Yang Zhang Volatility for more detail.
Yang-Zhang
Yang Zhang is a historical volatility estimator that handles both opening jumps and the drift and has a minimum estimation error.
We can think of the Yang-Zhang volatility as the combination of the overnight (close-to-open volatility ) and a weighted average of the Rogers-Satchell volatility and the day’s open-to-close volatility . It considered being 14 times more efficient than the close-to-close estimator.
Garman-Klass-Yang-Zhang
Garman Klass is a volatility estimator that incorporates open, low, high, and close prices of a security.
Garman-Klass volatility extends Parkinson's volatility by taking into account the opening and closing price. As markets are most active during the opening and closing of a trading session, it makes volatility estimation more accurate.
Garman and Klass also assumed that the process of price change is a process of continuous diffusion (geometric Brownian motion). However, this assumption has several drawbacks. The method is not robust for opening jumps in price and trend movements.
Despite its drawbacks, the Garman-Klass estimator is still more effective than the basic formula since it takes into account not only the price at the beginning and end of the time interval but also intraday price extremums.
Researchers Rogers and Satchel have proposed a more efficient method for assessing historical volatility that takes into account price trends. See Rogers-Satchell Volatility for more detail.
Exponential Weighted Moving Average
The Exponentially Weighted Moving Average (EWMA) is a quantitative or statistical measure used to model or describe a time series. The EWMA is widely used in finance, the main applications being technical analysis and volatility modeling.
The moving average is designed as such that older observations are given lower weights. The weights fall exponentially as the data point gets older – hence the name exponentially weighted.
The only decision a user of the EWMA must make is the parameter lambda. The parameter decides how important the current observation is in the calculation of the EWMA. The higher the value of lambda, the more closely the EWMA tracks the original time series.
Standard Deviation of Log Returns
This is the simplest calculation of volatility . It's the standard deviation of ln(close/close(1))
Pseudo GARCH(2,2)
This is calculated using a short- and long-run mean of variance multiplied by θ.
θavg(var ;M) + (1 − θ) avg (var ;N) = 2θvar/(M+1-(M-1)L) + 2(1-θ)var/(M+1-(M-1)L)
Solving for θ can be done by minimizing the mean squared error of estimation; that is, regressing L^-1var - avg (var; N) against avg (var; M) - avg (var; N) and using the resulting beta estimate as θ.
Average True Range
The average true range (ATR) is a technical analysis indicator, introduced by market technician J. Welles Wilder Jr. in his book New Concepts in Technical Trading Systems, that measures market volatility by decomposing the entire range of an asset price for that period.
The true range indicator is taken as the greatest of the following: current high less the current low; the absolute value of the current high less the previous close; and the absolute value of the current low less the previous close. The ATR is then a moving average, generally using 14 days, of the true ranges.
True Range Double
A special case of ATR that attempts to correct for volatility skew.
Chi-squared Confidence Interval:
Confidence interval of volatility is calculated using an inverse CDF of a Chi-Squared Distribution. You can change the volatility input used to either realized, upper confidence interval, or lower confidence interval. This is included in case you'd like to see how far price can extend if volatility hits it's upper or lower confidence levels. Generally, you'd just used realized volatility, so I wouldn't change this setting.
Inverse CDF of a Chi-Squared Distribution
The chi-square distribution is a one-parameter family of curves. The parameter ν is the degrees of freedom.
The icdf of the chi-square distribution is
x=F^−1(p∣ν) = {x:F(x∣ν) = p}
where
p=F(x∣ν)= ∫ (t^(v-2)/2 * e^t/2) / (2^(v/2) / Γ(v/2))
ν is the degrees of freedom, and Γ( · ) is the Gamma function. The result p is the probability that a single observation from the chi-square distribution with ν degrees of freedom falls in the interval .
Additional notes on Volatility Panel
-Shows both current timeframe volatility per candle at whatever date backward you select
-Shows annualized volatility basaed on selected days per year and per bar volatility; this is automaitcally caulculated no matter the timeframe used. This means that it'll calculate annualized volatility for the current candle even on the 1 second timeframe. Days per year should be 252 for everything but cryptocurrency; however, for all types of tradable assets, anything over the 3 day timeframe will calculate on 365 days.
Probability Panel
This panel shows the probability levels of a user selected upper and lower price boundary. This includes the inside range of volatility between the lower and upper price levels and the outside probability below the lower price level and above the upper price level. These values are calculated using the CDF (cumulative density function) of a normal distribution. In simpler terms, CDF returns area under a bell curve between two points left and right, or for our purposes, high and low. This yeilds the probabilities you see in the Probability Panel. See the following graphic to visualize how this works:
The red line is the entry bar; the yellow line is the "mean" but in this case just the chosen source price.
Other things to know
You can turn on/off all labels and levels and fills
Volatility Cone [Loxx]When it comes to forecasting volatility, it seems that the old axiom about weather is applicable: "Everyone talks about it, but no one can do much about it!" Volatility cones are a tool that may be useful in one’s attempt to do something about predicting the future volatility of an asset.
A "volatility cone" is a plot of the range of volatilities within a fixed probability band around the true parameter, as a function of sample length. Volatility cone is a visualization tool for the display of historical volatility term structure. It was introduced by Burghardt and Lane in early 1990 and is popular in the option trading community. This is mostly a static indicator due to processor load and is restricted to the daily time frame.
Why cones?
When we enter the options arena, in an effort to "trade volatility," we want to be able to compare current levels of implied volatility with recent historical volatility in an effort to assess the relative value of the option(s) under consideration Volatility cones can be an effective tool to help us with this assessment. A volatility cone is an analytical application designed to help determine if the current levels of historical or implied volatilities for a given underlying, its options, or any of the new volatility instruments, such as VolContractTM futures, VIX futures, or VXX and VXZ ETNs, are likely to persist in the future. As such, volatility cones are intended to help the user assess the likely volatility that an underlying will go on to display over a certain period. Those who employ volatility cones as a diagnostic tool are relying upon the principle of "reversion to the mean." This means that unusually high levels of volatility are expected to drift or move lower (revert) to their average (mean) levels, while relatively low volatility readings are expected to rise, eventually, to more "normal" values.
How to use
Suppose you want to analyze an options contract expiring in 3-months and this current option has an current implied volatility 25.5%. Suppose also that realized volatility (y-axis) at the 3-month mark (90 on the x-axis) is 45%, median in 35%, the 25th percentile is 30%, and the low is 25%. Comparing this range to the implied volatility you would maybe conclude that this is a relatively "cheap" option contract. To help you visualize implied volatility on the chart given an expiration date in bars, the indicator includes the ability to enter up to three expirations in bars and each expirations current implied volatility
By ascertaining the various historical levels of volatility corresponding to a given time horizon for the options futures under consideration, we’re better prepared to judge the relative "cheapness" or "expensiveness" of the instrument.
Volatility options
Close-to-Close
Close-to-Close volatility is a classic and most commonly used volatility measure, sometimes referred to as historical volatility .
Volatility is an indicator of the speed of a stock price change. A stock with high volatility is one where the price changes rapidly and with a bigger amplitude. The more volatile a stock is, the riskier it is.
Close-to-close historical volatility calculated using only stock's closing prices. It is the simplest volatility estimator. But in many cases, it is not precise enough. Stock prices could jump considerably during a trading session, and return to the open value at the end. That means that a big amount of price information is not taken into account by close-to-close volatility .
Despite its drawbacks, Close-to-Close volatility is still useful in cases where the instrument doesn't have intraday prices. For example, mutual funds calculate their net asset values daily or weekly, and thus their prices are not suitable for more sophisticated volatility estimators.
Parkinson
Parkinson volatility is a volatility measure that uses the stock’s high and low price of the day.
The main difference between regular volatility and Parkinson volatility is that the latter uses high and low prices for a day, rather than only the closing price. That is useful as close to close prices could show little difference while large price movements could have happened during the day. Thus Parkinson's volatility is considered to be more precise and requires less data for calculation than the close-close volatility. One drawback of this estimator is that it doesn't take into account price movements after market close. Hence it systematically undervalues volatility. That drawback is taken into account in the Garman-Klass's volatility estimator.
Garman-Klass
Garman Klass is a volatility estimator that incorporates open, low, high, and close prices of a security.
Garman-Klass volatility extends Parkinson's volatility by taking into account the opening and closing price. As markets are most active during the opening and closing of a trading session, it makes volatility estimation more accurate.
Garman and Klass also assumed that the process of price change is a process of continuous diffusion (geometric Brownian motion). However, this assumption has several drawbacks. The method is not robust for opening jumps in price and trend movements.
Despite its drawbacks, the Garman-Klass estimator is still more effective than the basic formula since it takes into account not only the price at the beginning and end of the time interval but also intraday price extremums.
Researchers Rogers and Satchel have proposed a more efficient method for assessing historical volatility that takes into account price trends. See Rogers-Satchell Volatility for more detail.
Rogers-Satchell
Rogers-Satchell is an estimator for measuring the volatility of securities with an average return not equal to zero.
Unlike Parkinson and Garman-Klass estimators, Rogers-Satchell incorporates drift term (mean return not equal to zero). As a result, it provides a better volatility estimation when the underlying is trending.
The main disadvantage of this method is that it does not take into account price movements between trading sessions. It means an underestimation of volatility since price jumps periodically occur in the market precisely at the moments between sessions.
A more comprehensive estimator that also considers the gaps between sessions was developed based on the Rogers-Satchel formula in the 2000s by Yang-Zhang. See Yang Zhang Volatility for more detail.
Yang-Zhang
Yang Zhang is a historical volatility estimator that handles both opening jumps and the drift and has a minimum estimation error.
We can think of the Yang-Zhang volatility as the combination of the overnight (close-to-open volatility ) and a weighted average of the Rogers-Satchell volatility and the day’s open-to-close volatility . It considered being 14 times more efficient than the close-to-close estimator.
Garman-Klass-Yang-Zhang
Garman Klass is a volatility estimator that incorporates open, low, high, and close prices of a security.
Garman-Klass volatility extends Parkinson's volatility by taking into account the opening and closing price. As markets are most active during the opening and closing of a trading session, it makes volatility estimation more accurate.
Garman and Klass also assumed that the process of price change is a process of continuous diffusion (geometric Brownian motion). However, this assumption has several drawbacks. The method is not robust for opening jumps in price and trend movements.
Despite its drawbacks, the Garman-Klass estimator is still more effective than the basic formula since it takes into account not only the price at the beginning and end of the time interval but also intraday price extremums.
Researchers Rogers and Satchel have proposed a more efficient method for assessing historical volatility that takes into account price trends. See Rogers-Satchell Volatility for more detail.
Exponential Weighted Moving Average
The Exponentially Weighted Moving Average (EWMA) is a quantitative or statistical measure used to model or describe a time series. The EWMA is widely used in finance, the main applications being technical analysis and volatility modeling.
The moving average is designed as such that older observations are given lower weights. The weights fall exponentially as the data point gets older – hence the name exponentially weighted.
The only decision a user of the EWMA must make is the parameter lambda. The parameter decides how important the current observation is in the calculation of the EWMA. The higher the value of lambda, the more closely the EWMA tracks the original time series.
Standard Deviation of Log Returns
This is the simplest calculation of volatility . It's the standard deviation of ln(close/close(1))
Sampling periods used
5, 10, 20, 30, 60, 90, 120, 150, 180, 210, 240, 270, 300, 330, and 360
Historical Volatility plot
Purple outer lines: High and low volatility values corresponding to x-axis time
Blue inner lines: 25th and 75th percentiles of volatility corresponding to x-axis time
Green line: Median volatility values corresponding to x-axis time
White dashed line: Realized volatility corresponding to x-axis time
Additional things to know
Due to UI constraints on TradingView it will be easier to visualize this indicator by double-clicking the bottom pane where it appears and then expanded the y- and x-axis to view the entire chart.
You can click on each point on the graph to see what the volatility of that point is.
Option expiration dates will show up as large dots on the graph. You can input your own values in the settings.

ATR - Average True Range + Dynamic Trend w/ Signals | by Octopu$↕ ATR - Average True Range + Dynamic Trend w/ Signals | by Octopu$
What is ATR?
ATR stands for Average True Range
A Technical Analysis Indicator that measures market volatility by decomposing the range of a Security Price in a specific period.
The ATR can be used as a High Low Spectrum,
As well as a variation of a Moving Average, considering the ranges on a timeframe, generally this being 14 days.
Shorter periods can be used (will generate more signals) or longer periods for steadier trends (for fewer signals)
A ticker on a high volatility has a high ATR.
A ticker on a low volatility has a low ATR.
It is an useful resource for a trading system:
Can be used to enter or exit trades and/or also measure the daily spectrum of a stock.
Does not necessarily points price direction, but takes into account gaps and strong legs.
Can also be used as trading positions confirmation,
Rather be it for stop losses or take profits,
As well as setting trailing stops or limit orders.
This tool offers a great Risk to Reward Ratio, considering the fact you will be aware of the possible moves that an asset can perform.
This indicator should not be used as a standalone tool.
(The combination of factors relies on your own knowledge about Confluence Factors along with your Due Diligence)
This indicator is not an advice to buy or sell securities.
www.tradingview.com
SPY
ANY Ticker. ANY Timeframe.
(Used SPY 5m as Example only)
Features:
• ATR ( Average True Range )
• Range UP and DOWN
• Movement from Price Line
• Dynamic ATR
• Cross/Test Signals
• Live and Last Close
Options:
• Specific Factors Setup
• Length Customization
• Toggle On/Off
• Color PIcker
• Styling Options
Notes:
v1.0
Indicator release.
Changes and updates can come in the future for additional functionalities or per requests. Follow and Stay Tuned!
Did you like it? Please Support and Shoot me a message! I'd appreciate if you dropped by to say thanks! Thank you.
- Octopu$
🐙

Asymmetric Dispersion High Lowdear fellows,
this indicator is an effort to determine the range where the prices are likely to fall within in the current candle.
how it is calculated
1. obtain
a. gain from the open to the high
b. loss from the open to the low
in the last 20 (by default) candles and
in the last 200 (10*20 by default) candles
2. perform
a. the geometric average (sma of the log returns) over these gains and losses
b. their respective standard deviation
3. plot from the open of each candle
a. the average + 2 standard deviations (2 by default) of the short window size
b. same for the long window size (which is overlapped)
what it shows
1. where the current candle is likely to move with 95% likelyhood
how it can be interpreted
1. a gauge for volatility in the short and long term
2. a visual inbalance between likelyhood to go up or down according to dispersion in relation to current prices or candle open.
3. a confirmation of crossings of, for instance, support and resistances once the cloud is completely above or below.
in regard to bollinger bands (which are and excellent well proven indicator)
1. it segregates upward moves from the downward ones.
2. it is hardly crossed by prices
3. it is centered on the current candle open, instead of the moving average.
we welcome feedback and critic.
best regards and success wishes.

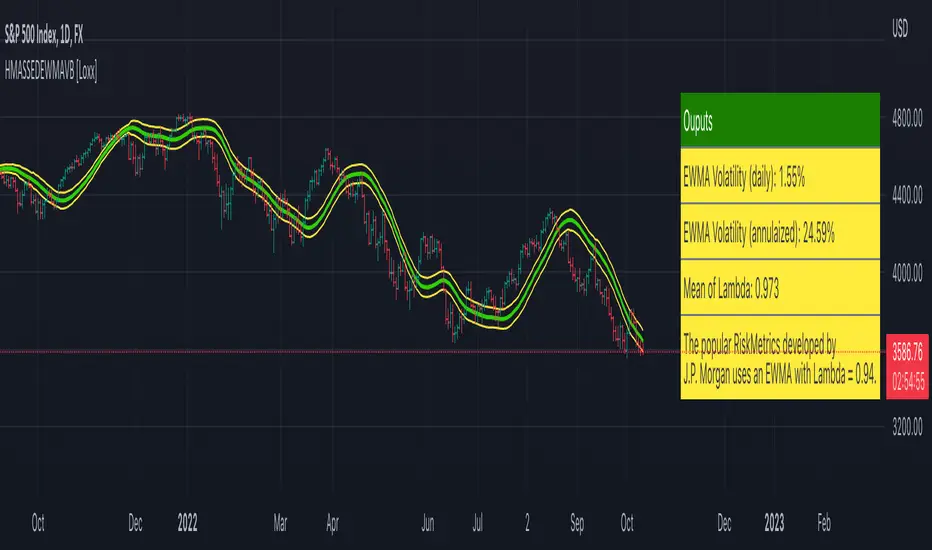
HMA w/ SSE-Dynamic EWMA Volatility Bands [Loxx]This indicator is for educational purposes to lay the groundwork for future closed/open source indicators. Some of thee future indicators will employ parameter estimation methods described below, others will require complex solvers such as the Nelder-Mead algorithm on log likelihood estimations to derive optimal parameter values for omega, gamma, alpha, and beta for GARCH(1,1) MLE and other volatility metrics. For our purposes here, we estimate the rolling lambda (λ) value used to calculate EWMA by minimizing of the sum of the squared errors minus the long-run variance--a rolling window of the one year mean of squared log-returns. In practice, practitioners will use a λ equal to a standardized value put out by institutions such as JP Morgan. Even simpler than this, others use a ratio of (per - 1) / (per + 1) to derive λ where per is the lookback period for EWMA. Due to computation limits in Pine, we'll likely not see a true GARCH(1,1) MLE on Pine for quite some time, but future closed source indicators will contain some very interesting industry hacks to get close by employing modifications to EWMA. Enjoy!
Exponentially weighted volatility and its relationship to GARCH(1,1)
Exponentially weighted volatility--also called exponentially weighted moving average volatility (EWMA)--puts more weight on more recent observations. EWMA is calculated as follows:
σ*2 = λσ(n - 1)^2 + (1 − λ)u(n - 1)^2
The estimate, σn, of the volatility for day n (made at the end of day n − 1) is calculated from σn −1 (the estimate that was made at the end of day n − 2 of the volatility for day n − 1) and u^n−1 (the most recent daily percentage change).
The EWMA approach has the attractive feature that the data storage requirements are modest. At any given time, we need to remember only the current estimate of the variance rate and the most recent observation on the value of the market variable. When we get a new observation on the value of the market variable, we calculate a new daily percentage change to update our estimate of the variance rate. The old estimate of the variance rate and the old value of the market variable can then be discarded.
The EWMA approach is designed to track changes in the volatility. Suppose there is a big move in the market variable on day n − 1 so that u2n−1 is large. This causes our estimate of the current volatility to move upward. The value of λ governs how responsive the estimate of the daily volatility is to the most recent daily percentage change. A low value of λ leads to a great deal of weight being given to the u(n−1)^2 when σn is calculated. In this case, the estimates produced for the volatility on successive days are themselves highly volatile. A high value of λ (i.e., a value close to 1.0) produces estimates of the daily volatility that respond relatively slowly to new information provided by the daily percentage change.
The RiskMetrics database, which was originally created by JPMorgan and made publicly available in 1994, used the EWMA model with λ = 0.94 for updating daily volatility estimates. The company found that, across a range of different market variables, this value of λ gives forecasts of the variance rate that come closest to the realized variance rate. In 2006, RiskMetrics switched to using a long memory model. This is a model where the weights assigned to the u(n -i)^2 as i increases decline less fast than in EWMA.
GARCH(1,1) Model
The EWMA model is a particular case of GARCH(1,1) where γ = 0, α = 1 − λ, and β = λ. The “(1,1)” in GARCH(1,1) indicates that σ^2 is based on the most recent observation of u^2 and the most recent estimate of the variance rate. The more general GARCH(p, q) model calculates σ^2 from the most recent p observations on u2 and the most recent q estimates of the variance rate.7 GARCH(1,1) is by far the most popular of the GARCH models. Setting ω = γVL, the GARCH(1,1) model can also be written:
σ(n)^2 = ω + αu(n-1)^2 + βσ(n-1)^2
What this indicator does
Calculate log returns log(close/close(1))
Calculates Lambda (λ) dynamically by minimizing the sum of squared errors. I've restricted this to the daily timeframe so as to not bloat the code with additional logic required to derive an annualized EWMA historical volatility metric.
After the Lambda is derived, EWMA is calculated one last time and the result is the daily volatility
This daily volatility is multiplied by the source and the multiplier +/- the HMA to create the volatility bands
Finally, daily volatility is multiplied by the square-root of days per year to derive annualized volatility. Years are trading days for the asset, for most everything but crypto, its 252, for crypto is 365.
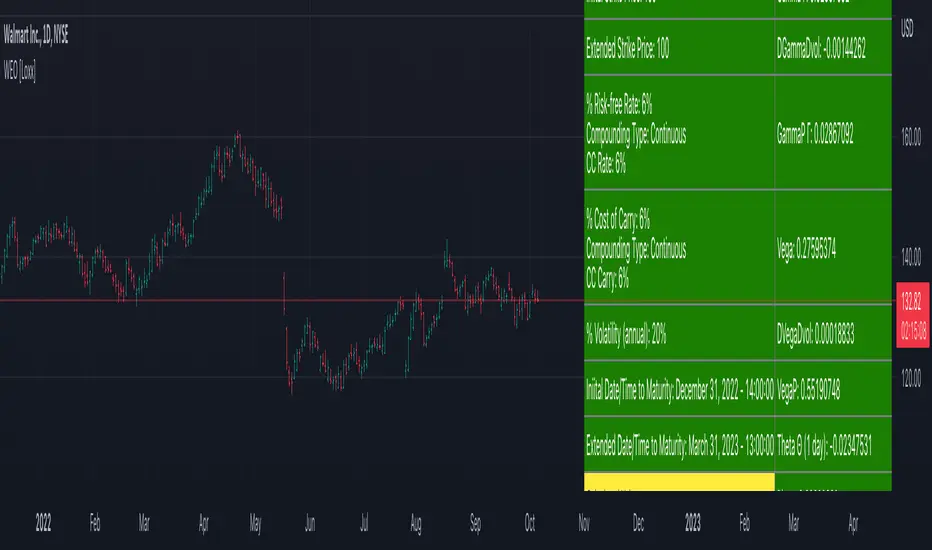
Reset Strike Options-Type 2 (Gray Whaley) [Loxx]For a reset option type 2, the strike is reset in a similar way as a reset option 1. That is, the strike is reset to the asset price at a predetermined future time, if the asset price is below (above) the initial strike price for a call (put). The payoff for such a reset call is max(S - X, 0), and max(X - S, 0) for a put, where X is equal to the original strike X if not reset, and equal to the reset strike if reset. Gray and Whaley (1999) have derived a closed-form solution for the price of European reset strike options. The price of the call option is then given by (via "The Complete Guide to Option Pricing Formulas")
c = Se^(b-r)T2 * M(a1, y1; p) - Xe^(-rT2) * M(a2, y2; p) - Se^(b-r)T1 * N(-a1) * N(z2) * e^-r(T2-T1) + Se^(b-r)T2 * N(-a1) * N(z1)
p = Se^(b-r)T1 * N(a1) * N(-z2) * e^-r(T2-T1) + Se^(b-r)T2 * N(a1) * N(-z1) + Xe^(-rT2) * M(-a2, -y2; p) - Se^(b-r)T2 * M(-a1, -y1; p)
where b is the cost-of-carry of the underlying asset, a is the volatility of the relative price changes in the asset, and r is the risk-free interest rate. K is the strike price of the option, T1 the time to reset (in years), and T2 is its time to expiration. N(x) and M(a,b; p) are, respectively, the univariate and bivariate cumulative normal distribution functions. Further
a1 = (log(S/X) + (b+v^2/2)T1) / v*T1^0.5 ... a2 = a1 - v*T1^0.5
z1 = ((b+v^2/2)(T2-T1)) / v*(T2-T1)^0.5 ... z2 = z1 - v*(T2-T1)^0.5
y1 = (log(S/X) + (b+v^2/2)T1) / v*T1^0.5 ... y2 = a1 - v*T1^0.5
and p = (T1/T2)^0.5. For reset options with multiple reset rights, see Dai, Kwok, and Wu (2003) and Liao and Wang (2003).
Inputs
Asset price ( S )
Strike price ( K )
Reset time ( T1 )
Time to maturity ( T2 )
Risk-free rate ( r )
Cost of carry ( b )
Volatility ( s )
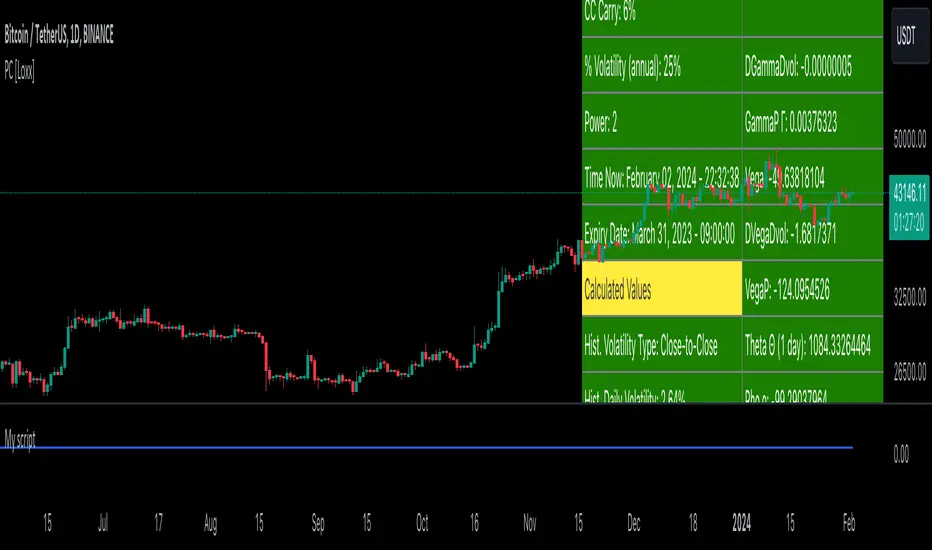
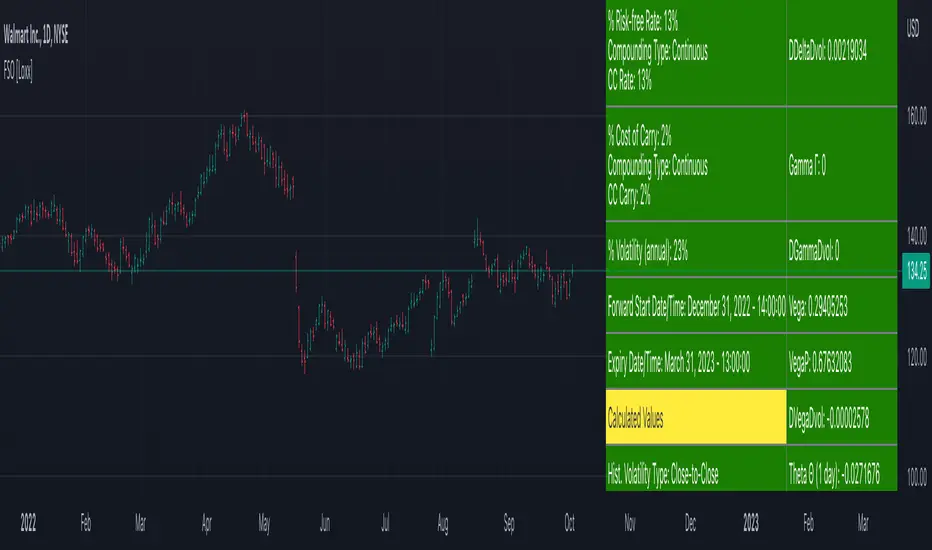
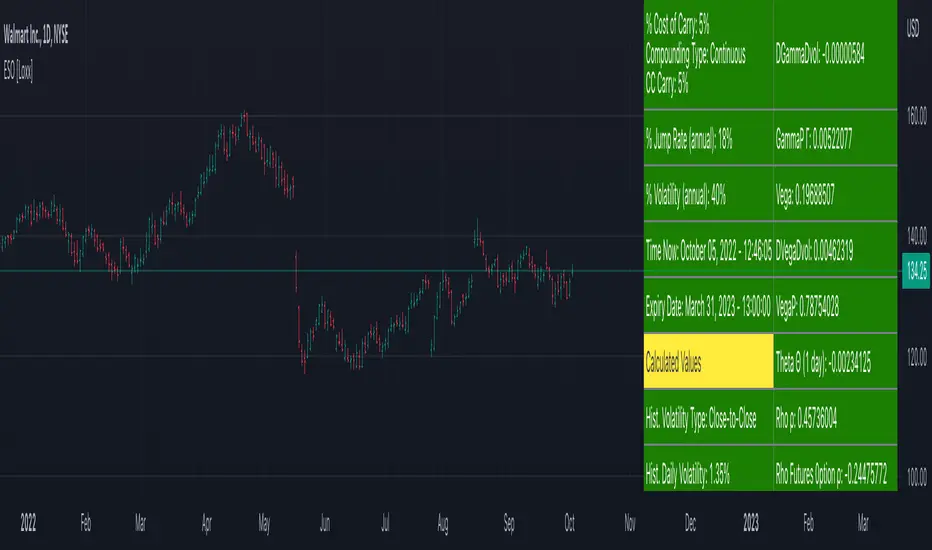
Numerical Greeks or Greeks by Finite Difference
Analytical Greeks are the standard approach to estimating Delta, Gamma etc... That is what we typically use when we can derive from closed form solutions. Normally, these are well-defined and available in text books. Previously, we relied on closed form solutions for the call or put formulae differentiated with respect to the Black Scholes parameters. When Greeks formulae are difficult to develop or tease out, we can alternatively employ numerical Greeks - sometimes referred to finite difference approximations. A key advantage of numerical Greeks relates to their estimation independent of deriving mathematical Greeks. This could be important when we examine American options where there may not technically exist an exact closed form solution that is straightforward to work with. (via VinegarHill FinanceLabs)
Numerical Greeks Outputs
Delta D
Elasticity L
Gamma G
DGammaDvol
GammaP G
Vega
DvegaDvol
VegaP
Theta Q (1 day)
Rho r
Rho futures option r
Phi/Rho2
Carry
DDeltaDvol
Speed
Strike Delta
Strike gamma
Things to know
Only works on the daily timeframe and for the current source price.
You can adjust the text size to fit the screen

Writer Extendible Option [Loxx]These options can be exercised at their initial maturity date /I but are extended to T2 if the option is out-of-the-money at ti. The payoff from a writer-extendible call option at time T1 (T1 < T2) is (via "The Complete Guide to Option Pricing Formulas")
c(S, X1, X2, t1, T2) = (S - X1) if S>= X1 else cBSM(S, X2, T2-T1)
and for a writer-extendible put is
c(S, X1, X2, T1, T2) = (X1 - S) if S< X1 else pBSM(S, X2, T2-T1)
Writer-Extendible Call
c = cBSM(S, X1, T1) + Se^(b-r)T2 * M(Z1, -Z2; -p) - X2e^-rT2 * M(Z1 - vT^0.5, -Z2 + vT^0.5; -p)
Writer-Extendible Put
p = cBSM(S, X1, T1) + X2e^-rT2 * M(-Z1 + vT^0.5, Z2 - vT^0.5; -p) - Se^(b-r)T2 * M(-Z1, Z2; -p)
b=r options on non-dividend paying stock
b=r-q options on stock or index paying a dividend yield of q
b=0 options on futures
b=r-rf currency options (where rf is the rate in the second currency)
Inputs
Asset price ( S )
Initial strike price ( X1 )
Extended strike price ( X2 )
Initial time to maturity ( t1 )
Extended time to maturity ( T2 )
Risk-free rate ( r )
Cost of carry ( b )
Volatility ( s )
Numerical Greeks or Greeks by Finite Difference
Analytical Greeks are the standard approach to estimating Delta, Gamma etc... That is what we typically use when we can derive from closed form solutions. Normally, these are well-defined and available in text books. Previously, we relied on closed form solutions for the call or put formulae differentiated with respect to the Black Scholes parameters. When Greeks formulae are difficult to develop or tease out, we can alternatively employ numerical Greeks - sometimes referred to finite difference approximations. A key advantage of numerical Greeks relates to their estimation independent of deriving mathematical Greeks. This could be important when we examine American options where there may not technically exist an exact closed form solution that is straightforward to work with. (via VinegarHill FinanceLabs)
Numerical Greeks Output
Delta
Elasticity
Gamma
DGammaDvol
GammaP
Vega
DvegaDvol
VegaP
Theta (1 day)
Rho
Rho futures option
Phi/Rho2
Carry
DDeltaDvol
Speed
Things to know
Only works on the daily timeframe and for the current source price.
You can adjust the text size to fit the screen
Reset Strike Options-Type 1 [Loxx]In a reset call (put) option, the strike is reset to the asset price at a predetermined future time, if the asset price is below (above) the initial strike price. This makes the strike path-dependent. The payoff for a call at maturity is equal to max((S-X)/X, 0) where is equal to the original strike X if not reset, and equal to the reset strike if reset. Similarly, for a put, the payoff is max((X-S)/X, 0) Gray and Whaley (1997) x have derived a closed-form solution for such an option. For a call, we have
c = e^(b-r)(T2-T1) * N(-a2) * N(z1) * e^(-rt1) - e^(-rT2) * N(-a2)*N(z2) - e^(-rT2) * M(a2, y2; p) + (S/X) * e^(b-r)T2 * M(a1, y1; p)
and for a put,
p = e^(-rT2) * N(a2) * N(-z2) - e^(b-r)(T2-T1) * N(a2) * N(-z1) * e^(-rT1) + e^(-rT2) * M(-a2, -y2; p) - (S/X) * e^(b-r)T2 * M(-a1, -y1; p)
where b is the cost-of-carry of the underlying asset, a is the volatil- ity of the relative price changes in the asset, and r is the risk-free interest rate. X is the strike price of the option, r the time to reset (in years), and T is its time to expiration. N(x) and M(a, b; p) are, respec- tively, the univariate and bivariate cumulative normal distribution functions. The remaining parameters are p = (T1/T2)^0.5 and
a1 = (log(S/X) + (b+v^2/2)T1) / vT1^0.5 ... a2 = a1 - vT1^0.5
z1 = (b+v^2/2)(T2-T1)/v(T2-T1)^0.5 ... z2 = z1 - v(T2-T1)^0.5
y1 = log(S/X) + (b+v^2)T2 / vT2^0.5 ... y2 = y1 - vT2^0.5
b=r options on non-dividend paying stock
b=r-q options on stock or index paying a dividend yield of q
b=0 options on futures
b=r-rf currency options (where rf is the rate in the second currency)
Inputs
Asset price ( S )
Initial strike price ( X1 )
Extended strike price ( X2 )
Initial time to maturity ( t1 )
Extended time to maturity ( T2 )
Risk-free rate ( r )
Cost of carry ( b )
Volatility ( s )
Numerical Greeks or Greeks by Finite Difference
Analytical Greeks are the standard approach to estimating Delta, Gamma etc... That is what we typically use when we can derive from closed form solutions. Normally, these are well-defined and available in text books. Previously, we relied on closed form solutions for the call or put formulae differentiated with respect to the Black Scholes parameters. When Greeks formulae are difficult to develop or tease out, we can alternatively employ numerical Greeks - sometimes referred to finite difference approximations. A key advantage of numerical Greeks relates to their estimation independent of deriving mathematical Greeks. This could be important when we examine American options where there may not technically exist an exact closed form solution that is straightforward to work with. (via VinegarHill FinanceLabs)
Numerical Greeks Ouput
Delta
Elasticity
Gamma
DGammaDvol
GammaP
Vega
DvegaDvol
VegaP
Theta (1 day)
Rho
Rho futures option
Phi/Rho2
Carry
DDeltaDvol
Speed
Things to know
Only works on the daily timeframe and for the current source price.
You can adjust the text size to fit the screen
Fade-in Options [Loxx]A fade-in call has the same payoff as a standard call except the size of the payoff is weighted by how many fixings the asset price were inside a predefined range (L, U). If the asset price is inside the range for every fixing, the payoff will be identical to a plain vanilla option. More precisely, for a call option, the payoff will be max(S(T) - X, 0) X 1/n Sum(n(i)), where n is the total number of fixings and n(i) = 1 if at fixing i the asset price is inside the range, and n(i) = 0 otherwise. Similarly, for a put, the payoff is max(X - S(T), 0) X 1/n Sum(n(i)).
Brockhaus, Ferraris, Gallus, Long, Martin, and Overhaus (1999) describe a closed-form formula for fade-in options. For a call the value is given by
max(X - S(T), 0) X 1/n Sum(n(i))
describe a closed-form formula for fade-in options. For a call the value is given by
c = 1/n * Sum(S^((b-r)*T) * (M(-d5, d1; -p) - M(-d3, d1; -p)) - Xe^(-rT) * (M(-d6, d2; -p) - M(-d4, d2; -p))
where n is the number of fixings, p = (t1^0.5/T^0.5), t1 = iT/n
d1 = (log(S/X) + (b + v^2/2)*T) / (v * T^0.5) ... d2 = d1 - v*T^0.5
d3 = (log(S/L) + (b + v^2/2)*t1) / (v * t1^0.5) ... d4 = d3 - v*t1^0.5
d5 = (log(S/U) + (b + v^2/2)*t1) / (v * t1^0.5) ... d6 = d5 - v*t1^0.5
The value of a put is similarly
p = 1/n * Sum(Xe^(-rT) * (M(-d6, -d2; -p) - M(-d4, -d2; -p))) - S^((b-r)*T) * (M(-d5, -d1; -p) - M(-d3, -d1; -p)
b=r options on non-dividend paying stock
b=r-q options on stock or index paying a dividend yield of q
b=0 options on futures
b=r-rf currency options (where rf is the rate in the second currency)
Inputs
Asset price ( S )
Strike price ( K )
Lower barrier ( L )
Upper barrier ( U )
Time to maturity ( T )
Risk-free rate ( r )
Cost of carry ( b )
Volatility ( s )
Fixings ( n )
cnd1(x) = Cumulative Normal Distribution
nd(x) = Standard Normal Density Function
cbnd3() = Cumulative Bivariate Distribution
convertingToCCRate(r, cmp ) = Rate compounder
Numerical Greeks or Greeks by Finite Difference
Analytical Greeks are the standard approach to estimating Delta, Gamma etc... That is what we typically use when we can derive from closed form solutions. Normally, these are well-defined and available in text books. Previously, we relied on closed form solutions for the call or put formulae differentiated with respect to the Black Scholes parameters. When Greeks formulae are difficult to develop or tease out, we can alternatively employ numerical Greeks - sometimes referred to finite difference approximations. A key advantage of numerical Greeks relates to their estimation independent of deriving mathematical Greeks. This could be important when we examine American options where there may not technically exist an exact closed form solution that is straightforward to work with. (via VinegarHill FinanceLabs)
Things to know
Only works on the daily timeframe and for the current source price.
You can adjust the text size to fit the screen

Log Contract Ln(S/X) [Loxx]A log contract, first introduced by Neuberger (1994) and Neuberger (1996), is not strictly an option. It is, however, an important building block in volatility derivatives (see Chapter 6 as well as Demeterfi, Derman, Kamal, and Zou, 1999). The payoff from a log contract at maturity T is simply the natural logarithm of the underlying asset divided by the strike price, ln(S/ X). The payoff is thus nonlinear and has many similarities with options. The value of this contract is (via "The Complete Guide to Option Pricing Formulas")
L = e^(-r * T) * (log(S/X) + (b-v^2/2)*T)
The delta of a log contract is
delta = (e^(-r*T) / S)
and the gamma is
gamma = (e^(-r*T) / S^2)
Inputs
S = Stock price.
K = Strike price of option.
T = Time to expiration in years.
r = Risk-free rate
c = Cost of Carry
V = Variance of the underlying asset price
cnd1(x) = Cumulative Normal Distribution
nd(x) = Standard Normal Density Function
convertingToCCRate(r, cmp ) = Rate compounder
Numerical Greeks or Greeks by Finite Difference
Analytical Greeks are the standard approach to estimating Delta, Gamma etc... That is what we typically use when we can derive from closed form solutions. Normally, these are well-defined and available in text books. Previously, we relied on closed form solutions for the call or put formulae differentiated with respect to the Black Scholes parameters. When Greeks formulae are difficult to develop or tease out, we can alternatively employ numerical Greeks - sometimes referred to finite difference approximations. A key advantage of numerical Greeks relates to their estimation independent of deriving mathematical Greeks. This could be important when we examine American options where there may not technically exist an exact closed form solution that is straightforward to work with. (via VinegarHill FinanceLabs)
Things to know
Only works on the daily timeframe and for the current source price.
You can adjust the text size to fit the screen
Log Option [Loxx]A log option introduced by Wilmott (2000) has a payoff at maturity equal to max(log(S/X), 0), which is basically an option on the rate of return on the underlying asset with strike log(X). The value of a log option is given by: (via "The Complete Guide to Option Pricing Formulas")
e^−rT * n(d2)σ√(T − t) + e^−rT*(log(S/K) + (b −σ^2/2)T) * N(d2)
where N(*) is the cumulative normal distribution function, n(*) is the normal density function, and
d = ((log(S/X) + (b - v^2/2)*T) / (v*T^0.5)
b=r options on non-dividend paying stock
b=r-q options on stock or index paying a dividend yield of q
b=0 options on futures
b=r-rf currency options (where rf is the rate in the second currency)
Inputs
S = Stock price.
K = Strike price of option.
T = Time to expiration in years.
r = Risk-free rate
c = Cost of Carry
V = Variance of the underlying asset price
cnd1(x) = Cumulative Normal Distribution
nd(x) = Standard Normal Density Function
convertingToCCRate(r, cmp ) = Rate compounder
Numerical Greeks or Greeks by Finite Difference
Analytical Greeks are the standard approach to estimating Delta, Gamma etc... That is what we typically use when we can derive from closed form solutions. Normally, these are well-defined and available in text books. Previously, we relied on closed form solutions for the call or put formulae differentiated with respect to the Black Scholes parameters. When Greeks formulae are difficult to develop or tease out, we can alternatively employ numerical Greeks - sometimes referred to finite difference approximations. A key advantage of numerical Greeks relates to their estimation independent of deriving mathematical Greeks. This could be important when we examine American options where there may not technically exist an exact closed form solution that is straightforward to work with. (via VinegarHill FinanceLabs)
Things to know
Only works on the daily timeframe and for the current source price.
You can adjust the text size to fit the screen
Log Contract Ln(S) [Loxx]A log contract, first introduced by Neuberger (1994) and Neuberger (1996), is not strictly an option. It is, however, an important building block in volatility derivatives (see Chapter 6 as well as Demeterfi, Derman, Kamal, and Zou, 1999). The payoff from a log contract at maturity T is simply the natural logarithm of the underlying asset divided by the strike price, ln(S/ X). The payoff is thus nonlinear and has many similarities with options. The value of this contract is (via "The Complete Guide to Option Pricing Formulas")
L = e^(-r * T) * (log(S/X) + (b-v^2/2)*T)
The delta of a log contract is
delta = (e^(-r*T) / S)
and the gamma is
gamma = (e^(-r*T) / S^2)
An even simpler version of the log contract is when the payoff simply is ln(S). The payoff is clearly still nonlinear in the underlying asset. It follows that the value of this contract is:
L = e^(-r * T) * (log(S) + (b-v^2/2)*T)
The theta/time decay of a log contract is
theta = - 1/T * v^2
and its exposure to the stock price, delta, is
delta = - 2/T * 1/S
This basically tells you that you need to be long stocks to be delta- neutral at any time. Moreover, the gamma is
gamma = 2 / (T * S^2)
b=r options on non-dividend paying stock
b=r-q options on stock or index paying a dividend yield of q
b=0 options on futures
b=r-rf currency options (where rf is the rate in the second currency)
Inputs
S = Stock price.
T = Time to expiration in years.
r = Risk-free rate
c = Cost of Carry
V = volatility of the underlying asset price
cnd1(x) = Cumulative Normal Distribution
nd(x) = Standard Normal Density Function
convertingToCCRate(r, cmp ) = Rate compounder
Numerical Greeks or Greeks by Finite Difference
Analytical Greeks are the standard approach to estimating Delta, Gamma etc... That is what we typically use when we can derive from closed form solutions. Normally, these are well-defined and available in text books. Previously, we relied on closed form solutions for the call or put formulae differentiated with respect to the Black Scholes parameters. When Greeks formulae are difficult to develop or tease out, we can alternatively employ numerical Greeks - sometimes referred to finite difference approximations. A key advantage of numerical Greeks relates to their estimation independent of deriving mathematical Greeks. This could be important when we examine American options where there may not technically exist an exact closed form solution that is straightforward to work with. (via VinegarHill FinanceLabs)
Things to know
Only works on the daily timeframe and for the current source price.
You can adjust the text size to fit the screen

Powered Option [Loxx]At maturity, a powered call option pays off max(S - X, 0)^i and a put pays off max(X - S, 0)^i . Esser (2003 describes how to value these options (see also Jarrow and Turnbull, 1996, Brockhaus, Ferraris, Gallus, Long, Martin, and Overhaus, 1999). (via "The Complete Guide to Option Pricing Formulas")
b=r options on non-dividend paying stock
b=r-q options on stock or index paying a dividend yield of q
b=0 options on futures
b=r-rf currency options (where rf is the rate in the second currency)
Inputs
S = Stock price.
K = Strike price of option.
T = Time to expiration in years.
r = Risk-free rate
c = Cost of Carry
V = volatility of the underlying asset price
i = power
cnd1(x) = Cumulative Normal Distribution
nd(x) = Standard Normal Density Function
combin(x) = Combination function, calculates the number of possible combinations for two given numbers
convertingToCCRate(r, cmp ) = Rate compounder
Numerical Greeks or Greeks by Finite Difference
Analytical Greeks are the standard approach to estimating Delta, Gamma etc... That is what we typically use when we can derive from closed form solutions. Normally, these are well-defined and available in text books. Previously, we relied on closed form solutions for the call or put formulae differentiated with respect to the Black Scholes parameters. When Greeks formulae are difficult to develop or tease out, we can alternatively employ numerical Greeks - sometimes referred to finite difference approximations. A key advantage of numerical Greeks relates to their estimation independent of deriving mathematical Greeks. This could be important when we examine American options where there may not technically exist an exact closed form solution that is straightforward to work with. (via VinegarHill FinanceLabs)
Things to know
Only works on the daily timeframe and for the current source price.
You can adjust the text size to fit the screen

Capped Standard Power Option [Loxx]Power options can lead to very high leverage and thus entail potentially very large losses for short positions in these options. It is therefore common to cap the payoff. The maximum payoff is set to some predefined level C. The payoff at maturity for a capped power call is min . Esser (2003) gives the closed-form solution: (via "The Complete Guide to Option Pricing Formulas")
c = S^i * (e^((i - 1) * (r + i*v^2 / 2) - i * (r - b))*T) * (N(e1) - N(e3)) - e^(-r*T) * (X*N(e2) - (C + X) * N(e4))
while the value of a put is
e1 = (log(S/X^(1/i)) + (b + (i - 1/2)*v^2)*T) / v*T^0.5
e3 = (log(S/(C + X)^(1/i)) + (b + (i - 1/2)*v^2)*T) / v*T^0.5
e4 = e3 - i * v * T^0.5
In the case of a capped power put, we have
p = e^(-r*T) * (X*N(-e2) - (C + X) * N(-e4)) - S^i * (e^((i - 1) * (r + i*v^2 / 2) - i * (r - b))*T) * (N(-e1) - N(-e3))
where e1 and e2 is as before. e3 and e4 has to be changed to
e3 = (log(S/(X - C)^(1/i)) + (b + (i - 1/2)*v^2)*T) / v*T^0.5
e4 = e3 - i * v * T^0.5
b=r options on non-dividend paying stock
b=r-q options on stock or index paying a dividend yield of q
b=0 options on futures
b=r-rf currency options (where rf is the rate in the second currency)
Inputs
S = Stock price.
K = Strike price of option.
T = Time to expiration in years.
r = Risk-free rate
c = Cost of Carry
V = Variance of the underlying asset price
i = power
c = Capped on pay off
cnd1(x) = Cumulative Normal Distribution
nd(x) = Standard Normal Density Function
convertingToCCRate(r, cmp ) = Rate compounder
Numerical Greeks or Greeks by Finite Difference
Analytical Greeks are the standard approach to estimating Delta, Gamma etc... That is what we typically use when we can derive from closed form solutions. Normally, these are well-defined and available in text books. Previously, we relied on closed form solutions for the call or put formulae differentiated with respect to the Black Scholes parameters. When Greeks formulae are difficult to develop or tease out, we can alternatively employ numerical Greeks - sometimes referred to finite difference approximations. A key advantage of numerical Greeks relates to their estimation independent of deriving mathematical Greeks. This could be important when we examine American options where there may not technically exist an exact closed form solution that is straightforward to work with. (via VinegarHill FinanceLabs)
Things to know
Only works on the daily timeframe and for the current source price.
You can adjust the text size to fit the screen

Standard Power Option [Loxx]Standard power options (aka asymmetric power options) have nonlinear payoff at maturity. For a call, the payoff is max(S^i - X, 0), and for a put, it is max(X - S^i , 0), where i is some power (i > 0). The value of this power call is given by (see Heynen and Kat, 1996c; Zhang, 1998; and Esser, 2003). (via "The Complete Guide to Option Pricing Formulas")
c = S^i * (e^((i - 1) * (r + i*v^2 / 2) - i * (r - b))*T) * N(d1) - X*e^(-r*T) * N(d2)
while the value of a put is
p = X*e^(-r*T) * N(-d2) - S^i * (e^((i - 1) * (r + i*v^2 / 2) - i * (r - b))*T) * N(-d1)
where
d1 = (log(S/X^(1/i)) + (b + (i - 1/2)*v^2)*T) / v*T^0.5
d2 = d1 - i * v * T^0.5
b=r options on non-dividend paying stock
b=r-q options on stock or index paying a dividend yield of q
b=0 options on futures
b=r-rf currency options (where rf is the rate in the second currency)
Inputs
S = Stock price.
K = Strike price of option.
T = Time to expiration in years.
r = Risk-free rate
c = Cost of Carry
V = Variance of the underlying asset price
pwr = power
cnd1(x) = Cumulative Normal Distribution
nd(x) = Standard Normal Density Function
convertingToCCRate(r, cmp ) = Rate compounder
Numerical Greeks or Greeks by Finite Difference
Analytical Greeks are the standard approach to estimating Delta, Gamma etc... That is what we typically use when we can derive from closed form solutions. Normally, these are well-defined and available in text books. Previously, we relied on closed form solutions for the call or put formulae differentiated with respect to the Black Scholes parameters. When Greeks formulae are difficult to develop or tease out, we can alternatively employ numerical Greeks - sometimes referred to finite difference approximations. A key advantage of numerical Greeks relates to their estimation independent of deriving mathematical Greeks. This could be important when we examine American options where there may not technically exist an exact closed form solution that is straightforward to work with. (via VinegarHill FinanceLabs)
Things to know
Only works on the daily timeframe and for the current source price.
You can adjust the text size to fit the screen

Power Contract [Loxx]There are two main categories of power options. Standard power options' payoff depends on the price of the underlying asset raised to some power. For powered options, the "standard" payoff (stock price in excess of the exercise price) is raised to some power.
A power contract is a simple derivative instrument paying (S/ X)^i at maturity, where i is some fixed power. The value of such a power contract is given by Shaw (1998) as: (via "The Complete Guide to Option Pricing Formulas")
VPower = (S/X)^i * e^((b-v^2)/2)*i - r + i^2 * v^2/2)*T
b=r options on non-dividend paying stock
b=r-q options on stock or index paying a dividend yield of q
b=0 options on futures
b=r-rf currency options (where rf is the rate in the second currency)
Inputs
S = Stock price.
K = Strike price of option.
T = Time to expiration in years.
r = Risk-free rate
c = Cost of Carry
V = Variance of the underlying asset price
lambda = Jump rate per year
cnd1(x) = Cumulative Normal Distribution
nd(x) = Standard Normal Density Function
convertingToCCRate(r, cmp ) = Rate compounder
Numerical Greeks or Greeks by Finite Difference
Analytical Greeks are the standard approach to estimating Delta, Gamma etc... That is what we typically use when we can derive from closed form solutions. Normally, these are well-defined and available in text books. Previously, we relied on closed form solutions for the call or put formulae differentiated with respect to the Black Scholes parameters. When Greeks formulae are difficult to develop or tease out, we can alternatively employ numerical Greeks - sometimes referred to finite difference approximations. A key advantage of numerical Greeks relates to their estimation independent of deriving mathematical Greeks. This could be important when we examine American options where there may not technically exist an exact closed form solution that is straightforward to work with. (via VinegarHill FinanceLabs)
Things to know
Only works on the daily timeframe and for the current source price.
You can adjust the text size to fit the screen
Moneyness Options [Loxx]A moneyness option is basically a plain vanilla option where the strike is set to a percentage of the future/forward price. For example, a 120% moneyness call would have a strike equal to 120% of the forward price. A 120% moneyness put would have a spot equal to 120% of the strike. The value of this option is given in percent of the forward. The value of a moneyness call or put is thus given by: (via "The Complete Guide to Option Pricing Formulas")
c = p = c^-rT * (N(d1) - LN(d2))
where L = X/F for a call and L = F/X for a put, and
d1 = (-log(L) + v^2*T/2) / (v*T^0.5)
d2 = d1 - (v*T^0.5)
b=r options on non-dividend paying stock
b=r-q options on stock or index paying a dividend yield of q
b=0 options on futures
b=r-rf currency options (where rf is the rate in the second currency)
Inputs
S = Stock price.
K = Strike price of option.
T = Time to expiration in years.
r = Risk-free rate
c = Cost of Carry
V = Variance of the underlying asset price
lambda = Jump rate per year
cnd1(x) = Cumulative Normal Distribution
nd(x) = Standard Normal Density Function
convertingToCCRate(r, cmp ) = Rate compounder
Numerical Greeks or Greeks by Finite Difference
Analytical Greeks are the standard approach to estimating Delta, Gamma etc... That is what we typically use when we can derive from closed form solutions. Normally, these are well-defined and available in text books. Previously, we relied on closed form solutions for the call or put formulae differentiated with respect to the Black Scholes parameters. When Greeks formulae are difficult to develop or tease out, we can alternatively employ numerical Greeks - sometimes referred to finite difference approximations. A key advantage of numerical Greeks relates to their estimation independent of deriving mathematical Greeks. This could be important when we examine American options where there may not technically exist an exact closed form solution that is straightforward to work with. (via VinegarHill FinanceLabs)
Things to know
Only works on the daily timeframe and for the current source price.
You can adjust the text size to fit the screen

Forward Start Options [Loxx]A forward start option with time to maturity T starts at-the-money or proportionally in- or out-of-the-money after a known elapsed time t in the future. The strike is set equal to a positive constant a times the asset price S after the known time t. If a is less than unity, the call (put) will start 1 - a percent in-the-money (out-of-the- money); if a is unity, the option will start at-the-money; and if a is larger than unity, the call (put) will start a - 1 percentage out-of-the- money (in-the-money).A forward start option can be priced using the Rubinstein (1990) formula: (via "The Complete Guide to Option Pricing Formulas")
c = S*e^(b-r)t * (e^(b-r)(T-t) * N(d1)) - alpha * e^-r(T-t) * N(d2))
p = S*e^(b-r)t * (alpha*e^r(T-t) * N(-d2)) - e^-(b-r)(T-t) * N(-d1))
where
d1 = (log(1/alpha) + (b + v^2/2)(T-1))/v*(T-t)^0.5
d2 = d1 - v*(T-t)^0.5
Application
Employee options are often of the forward starting type. Ratchet options (aka cliquet options) consist of a series of forward starting options.
b=r options on non-dividend paying stock
b=r-q options on stock or index paying a dividend yield of q
b=0 options on futures
b=r-rf currency options (where rf is the rate in the second currency)
Inputs
S = Stock price.
a = Alpha
T1 = Time to forward start
T = Time to expiration in years.
r = Risk-free rate
c = Cost of Carry
v = volatility of the underlying asset price
Numerical Greeks or Greeks by Finite Difference
Analytical Greeks are the standard approach to estimating Delta, Gamma etc... That is what we typically use when we can derive from closed form solutions. Normally, these are well-defined and available in text books. Previously, we relied on closed form solutions for the call or put formulae differentiated with respect to the Black Scholes parameters. When Greeks formulae are difficult to develop or tease out, we can alternatively employ numerical Greeks - sometimes referred to finite difference approximations. A key advantage of numerical Greeks relates to their estimation independent of deriving mathematical Greeks. This could be important when we examine American options where there may not technically exist an exact closed form solution that is straightforward to work with. (via VinegarHill FinanceLabs)
Things to know
Only works on the daily timeframe and for the current source price.
You can adjust the text size to fit the screen
Executive Stock Options [Loxx]The Jennergren and Naslund (1993) formula takes into account that an employee or executive often loses her options if she has to leave the company before the option's expiration: (via "The Complete Guide to Option Pricing Formulas")
c = e^(-lambda*T) * (Se^((b-r)T) * N(d1) - Xe^-rT * N(d2))
p = e^(-lambda*T) * (Xe^(-rT) * N(-d2) - Se^(b-r)T * N(-d1))
where
d1 = (log(S/X) + (b + v^2/2)T) / vT^0.5
d2 = d1 - vT^0.5
lambda is the jump rate per year. The value of the executive option equals the ordinary Black-Scholes option price multiplied by the probability e —AT that the executive will stay with the firm until the option expires.
b=r options on non-dividend paying stock
b=r-q options on stock or index paying a dividend yield of q
b=0 options on futures
b=r-rf currency options (where rf is the rate in the second currency)
Inputs
S = Stock price.
K = Strike price of option.
T = Time to expiration in years.
r = Risk-free rate
c = Cost of Carry
V = Variance of the underlying asset price
lambda = Jump rate per year
cnd1(x) = Cumulative Normal Distribution
nd(x) = Standard Normal Density Function
convertingToCCRate(r, cmp ) = Rate compounder
Numerical Greeks or Greeks by Finite Difference
Analytical Greeks are the standard approach to estimating Delta, Gamma etc... That is what we typically use when we can derive from closed form solutions. Normally, these are well-defined and available in text books. Previously, we relied on closed form solutions for the call or put formulae differentiated with respect to the Black Scholes parameters. When Greeks formulae are difficult to develop or tease out, we can alternatively employ numerical Greeks - sometimes referred to finite difference approximations. A key advantage of numerical Greeks relates to their estimation independent of deriving mathematical Greeks. This could be important when we examine American options where there may not technically exist an exact closed form solution that is straightforward to work with. (via VinegarHill FinanceLabs)
Things to know
Only works on the daily timeframe and for the current source price.
You can adjust the text size to fit the screen
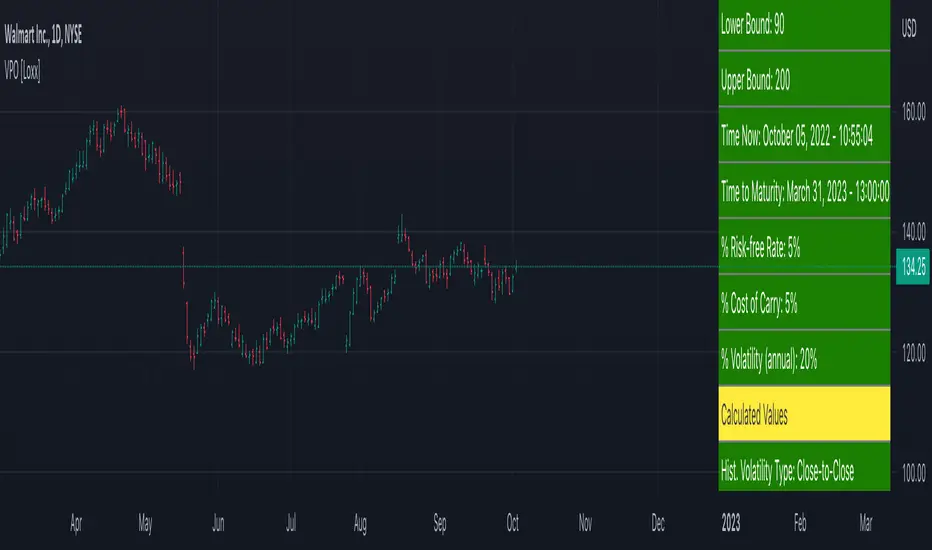
Variable Purchase Options [Loxx]Handley (2001) describes how to value variable purchase options (VPO). A VPO is basically a call option, but where the number of underlying shares is stochastic rather than fixed, or more precisely, a deterministic function of the asset price. The strike price of a VPO is typically a fixed discount to the underlying share price at maturity. The payoff at maturity is equal to max , where N is the number of shares. VPOs may be an interesting tool for firms that need to raise capital relatively far into the future at a given time. The number of underlying shares N is decided on at maturity and is equal to
N = X / St(1 -D)
where X is the strike price, ST is the asset price at maturity, and D is the fixed discount expressed as a proportion 0 > D < 1. The number of shares is in this way a deterministic function of the asset price. Further, the number of shares is often subjected to a minimum and maximum. In this case, we will limit the minimum number of shares to Nmin = X / U(1 -D) if, the asset price at maturity is above a predefined level U at maturity. Similarly, we will reach the maximum number of shares A T = x if the stock price at maturity is equal Nmax = X / L(1 -D) or lower than a predefined level L. Based on Handley (2001), we get the following closed-form solution: (via "The Complete Guide to Option Pricing Formulas")
c = XD / 1-D e^-rT + Nmin(Se^(b-r)T * N(d1) - Ue^-rT * N(d2))
- Nmax(Le^-rT * N(-d4) - Se^(b-r)T * N(-d3))
+ Nmax(L(1-D)e^-rT * N(-d6) - Se^(b-r)T * N(-d5))
where
d1 = (log(S/U) + (b+v^2/2)T) / vT^0.5 ... d2 = d1 - vT^0.5
d3 = (log(S/L) + (b+v^2/2)T) / vT^0.5 ... d4 = d3 - vT^0.5
d5 = (log(S/L(1-D)) + (b+v^2/2)T) / vT^0.5 ... d6 = d5 - vT^0.5
Inputs
Asset price (S)
Strike price (K)
Discount %
Lower bound
Upper bound
Time to maturity
Risk-free rate (r) %
Cost of carry (b) %
Volatility (v) %
Things to know
Only works on the daily timeframe and for the current source price.
You can adjust the text size to fit the screen
Perpetual American Options [Loxx]Perpetual American Options is Perpetual American Options pricing model. This indicator also includes numerical greeks.
American Perpetual Options
While there in general is no closed-form solution for American options (except for non-dividend-paying stock call options) it is possible to find a closed-form solution for options with an infinite time to expiration. The reason is that the time to expiration will always be the same: infinite. The time to maturity, therefore, does not depend on at what point in time we look at the valuation problem, which makes the valuation problem independent of time McKean (1965) and Merton (1973) gives closed-form solutions for American perpetual options. For a call option we have
c = (X / (y1 - 1)) * ((y1 - 1)/y1 * S/X)^y1
where
y1 = 1/2 - b/v^2 + ((b/v^2 - 1/2)^2 + 2*r/v^2)^0.5
If b >= r, then there is never optimal to exercise a call option. In the case of an American perpetual put, we have
p = X/(1-y2) * (((y2 - 1) / y2) * S/X)^y2
where
y2 = 1/2 - b/v^2 - ((b/v^2 - 1/2)^2 + 2*r/v^2)^0.5
In practice, one can naturally discuss if there is such a thing as infinite time to maturity. For instance, credit risk could play an important role: Even when you are buying an option from an AAA bank, there is no guarantee the bank will be around forever.
b=r options on non-dividend paying stock
b=r-q options on stock or index paying a dividend yield of q
b=0 options on futures
b=r-rf currency options (where rf is the rate in the second currency)
Inputs
S = Stock price.
K = Strike price of option.
T = Time to expiration in years.
r = Risk-free rate
c = Cost of Carry
V = Variance of the underlying asset price
cnd1(x) = Cumulative Normal Distribution
cbnd3(x) = Cumulative Bivariate Normal Distribution
nd(x) = Standard Normal Density Function
convertingToCCRate(r, cmp ) = Rate compounder
Numerical Greeks or Greeks by Finite Difference
Analytical Greeks are the standard approach to estimating Delta, Gamma etc... That is what we typically use when we can derive from closed form solutions. Normally, these are well-defined and available in text books. Previously, we relied on closed form solutions for the call or put formulae differentiated with respect to the Black Scholes parameters. When Greeks formulae are difficult to develop or tease out, we can alternatively employ numerical Greeks - sometimes referred to finite difference approximations. A key advantage of numerical Greeks relates to their estimation independent of deriving mathematical Greeks. This could be important when we examine American options where there may not technically exist an exact closed form solution that is straightforward to work with. (via VinegarHill FinanceLabs)
Things to know
Only works on the daily timeframe and for the current source price.
You can adjust the text size to fit the screen