HhLl-OscilatorSimple oscillator which checks how many highs and how many lows the price is making. Parameters are as explained below:
lookback - Checks how many highs and lows it is making in these many bars. Sum of all highs and lows are taken for plotting.
periods - Initial period to check high and lows
multiples - Number of multiples on initial period for which highs and lows are checked
colorCandles - CandleColor based on the oscillator
If periods is 20 and multiples is 5 and loopback is 10
Indicator checks for last 10 bars how many highs/lows are made for 20, 40, 60, 80 and 100 periods. Sum of all highs and lows are plotted on the oscillator overlay
High-Low Index

Price MovementPrice indicator that shows the trend based on price movement.
The indicator determinants when an asset price is getting higher or lower by comparing the previous price highs and lows to the current price.
==Explanation==
In case current HL2 exceeds the previous HL2 HIGH then the columns will turn green.
In case current HL2 fails the previous HL2 LOW then the columns will turn red.
The trick here is that the trend CONTINUES to show the greens and reds, until a reversal happens to the opposite side.
This can be used to determinate trends and reversals.
Note: Bar colors are disabled by default.
You can set the lookback period at the indicator settings as well as the asset source (HL2,CLOSE, etc..). default is HL2
Quote that i like: “It is impossible to produce superior performance unless you do something different from the majority.” – John Templeton
Enjoy and like if you like :)

Algonize Pivot Strategy (APS)This study is based on several Price Action parameters of :-
• Pivot Points,
• Higher High and Lower Lows,
• High Low Index ,
• Support and Resistance.
► How To Use This Strategy?
This is a pure scalping strategy and it is advised to use this only with algo trading systems. Due to high trade frequency.
► This Strategy has inbuilt custom time frame backtester, which enables you to test for performance between any date or check for a single day.
► To Create Alerts for algo trading in this strategy simply Check "Activate Algo" from Settings then Create new alert , select your strategy in condition box, and now scroll down to message box and write
{{strategy.order.comment}}
That's it , Just Click on Create Alert Button
Backtest Values Used:-
Initial Capital : 1000000
Order Size (Lots) : 1 (Contract) Lots
Pyramiding : 0 orders
Commission : 0.003%
Sharpe Ratio : 1.741
Profit Factor : 1.174
Test Yourself and give feedback.
PM us to obtain access.

High Low Differential MeterYet another trend follower that is based on a very simple principle: Take the highest high and lowest low from a user defined bars back period, do an average between them and smooth them up with 3 possible moving averages, VIDYA, EMA and SMA, while VIDYA is the default.
What is VIDYA ?
Variable Index Dynamic Average (VIDYA) is similar to the Exponential Moving Average (EMA), but automatically adjusts the smoothing weight based on price volatility.
How to use:
GREEN : Up trending
LIGHT GREEN : Up trend reversal might occur.
RED : Down trending
LIGHT RED : Down trend reversal might occur.
NOTE: BAR COLORS are set to TRUE by default!
Follow for more indicators: www.tradingview.com

Trend-Range IdentifierTrend trading algorithms fail in ranging market and Swing trading algorithm fail in trending market. Purpose of this indicator is to identify if the instrument is trending or ranging so that you can apply appropriate trading algorithm for the market.
Process:
ATR is calculated based on the input parameter atrLength
Range/Channel containing upLine and downLine is calculated by adding/subtracting atrMultiplier * atr to close price.
This range/channel will remain same until the price breaks either upLine or downLine.
Once price crosses one among upLine and downLine, then new upLine/downLine is calculated based on latest close price.
If price breaks upLine, the trend is considered to be up until the next line break or no lines are broken for rangeLength bars. During this state, candles are colored in lime and upLine/downLine are colored in green.
If price breaks downLine, the trend is considered to be down until the next line break or no lines are broken for rangeLength bars. During this state, candles are colored in orange and upLine/downLine are colored in red.
If close price does not break either upLine or downLine for rangeLength bars, then the instrument is considered to be in range. During this state, candles are colored in silver and upLine/downLine are colored in purple.
In ranging duration, we display one among Keltner Channel, Bollinger Band or Donchian Band as per input parameter : rangeChannel . Other parameters used for calculation are rangeLength and stdDev
I have not fully optimized parameters. Suggestions and feedback welcome.

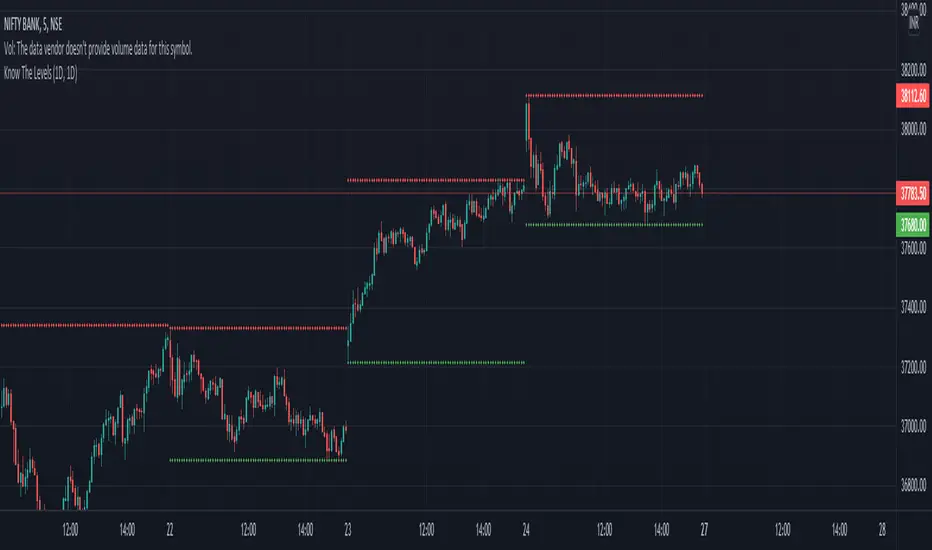
Know The LevelsAs Mr. Yen says as a day traders we need a reference to work with , this is a chart showing high low of current and previous day, yellow are yesterday's and green are present day's
Divergence of Market Breadth & Price deduction indicatorHow it begin?
Traders and investors use market breadth in order to assess the index’s overall health. Market breadth can be a reliable, if not an accurate, indicator of an upcoming price rise in the index. Similarly, it can also provide early warning signs for a future price decline.
What is it?
market breadth in this case refer to percentage of stocks above 20 Simple Moving Average,which could be used as a barometer for the market.
How it works?
This paticular indicator compare the divergence of Nasdaq 100 and Russell 2000 percentage of stocks above 20 Simple Moving Average.
This indicator also include a deduction price method ,which is inspired from LEI & LoneCapital

Cumulative High Low IndexThis indicator tells how many days it is making new HighLowPeriod highs or lows in Lookback period.
If bar makes new HighLowPeriod high, HighLow index for that bar is +1
If bar makes new HighLowPeriod low, HighLow index for that bar is -1
Cumulative high low index is sum of HighLow index for Lookback periods.
Optional moving average can also be applied on this index

VIX MTF MomentumSweet little momentum gadget to track the VIX Index.
What is the VIX?
The CBOE S&P 500 Volatility Index (VIX) is known as the 'Fear Index' which can measure how worried traders are that the S&P 500 might suddenly drop within the next 30 days.
When the VIX starts moving higher, it is telling you that traders are getting nervous. When the VIX starts moving lower, it is telling you that traders are gaining confidence.
VIX calculation?
The Chicago Board of Options Exchange Market Volatility Index (VIX) is a measure of implied volatility (Of the S&P 500 securities options), based on the prices of a basket of S&P 500 Index options with 30 days to expiration.
How to use:
If VIX Momentum is above 0 (RED) traders are getting nervous.
If VIX Momentum is below 0 (GREEN) traders are gaining confidence.
Follow to get updates and new scripts: www.tradingview.com

Low - High Simple TrackerYet another "Low - High" indicator using the new Pine Script Arrays.
The indicator uses the latests Lows and Highs to plot a trend line and reversal/slowdown.
More detailed explanation inside the script.
Enjoy!
Green - Up Trending
Red - Down Trending
White - Slow Down/Reversal might occur.
Made for educational purposes of how to use Arrays, yet can be very useful.

High - Low Trend TunnelHigh - Low Trend Tunnel Experiment.
Using latest pinescript Array support!
Plotting Highest highs and Lowest lows for specific length (can be defined in settings).
The blue line is whom determinate the direction.
Blue line is the average of the highest highs and lowest lows smoothed by EMA.
Green - Up Trending.
Red - Down Trending.
Yellow - Squeeze, a reversal might be coming.
Any suggestions/comments are welcome as this is an experiment.

High/Low meterUsing the new 'pinescript' array support to build an High/Low tunnel meter.
Using the Array to save only X HIGHEST HIGHS and Y LOWEST LOWS.
By the X and Y i build a tunnel - X is the top line (highs) and Y bottom line (lows)
Green - Up Trending
Red - Down Trending
Yellow - Reversal / drawback might occur.

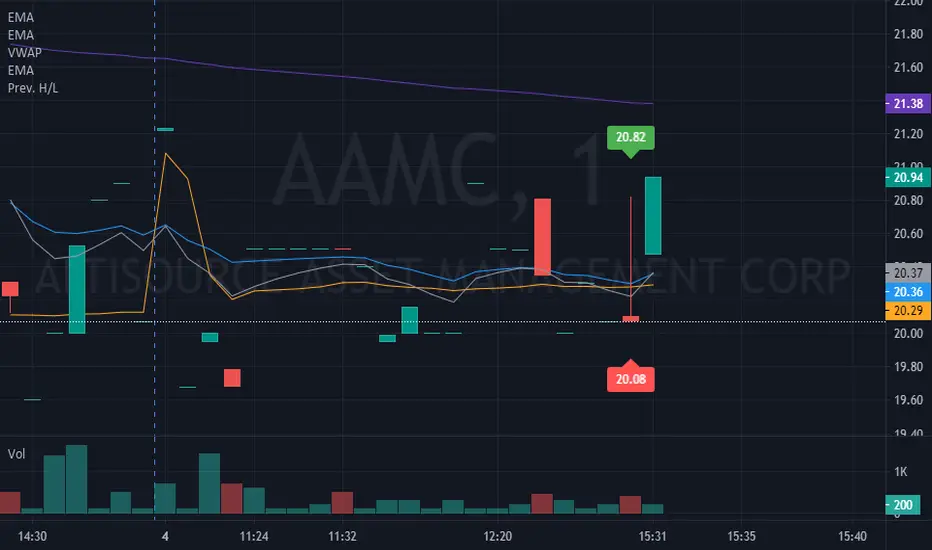
Previous Candle High and LowThis Indicator add's a label over and below the previous candle which show's it's high and low values.

Support Resistance HH HL LH LLThis is a very powerful indicator and I'm really happy to show you how it works.
It shows Higher Highs(HH),Higher Lows(HL),Lower Highs(LH),and Lower Lows (LL), the supports and the resistance.
Lets start with the HH, HL, LH and LL.
This points helps a lot who can not identify them yet. They help to identify up trends having HH and HL in sequence, and when the trend is not strong anymore creating LH after.
For down trends, the indicator show LH and LL in sequence and when the trend is not strong anymore showing HL after.
As well this indicator helps to draw trend lines when it shows. For example the LL drawing the line from the low of the first candle (LL) to the low of the second candle showing HL for an uptrend.
It can be done for the down trend, drawing the trend line from the high of the candle showing the HH, to the high of the candle showing LH.
Another use of the HH, HL, LH, LL can be the stop loss this will be explained later in the support and resistance part.
Now let me explain the support and resistance.
The support and resistance can be used as entry when the price break true using the previous HH, HL, LH and LL as stop loss.
For a safer entry I advise to use the retest of the line.
In the settings of the indicator there is the possibility to make the indicators invisible, to change the color, and as well to change how many candles before and after the main candle showing the HH, HL, LH and LL, but I advise to leave it as it is.
Thank you and lets take some pips!

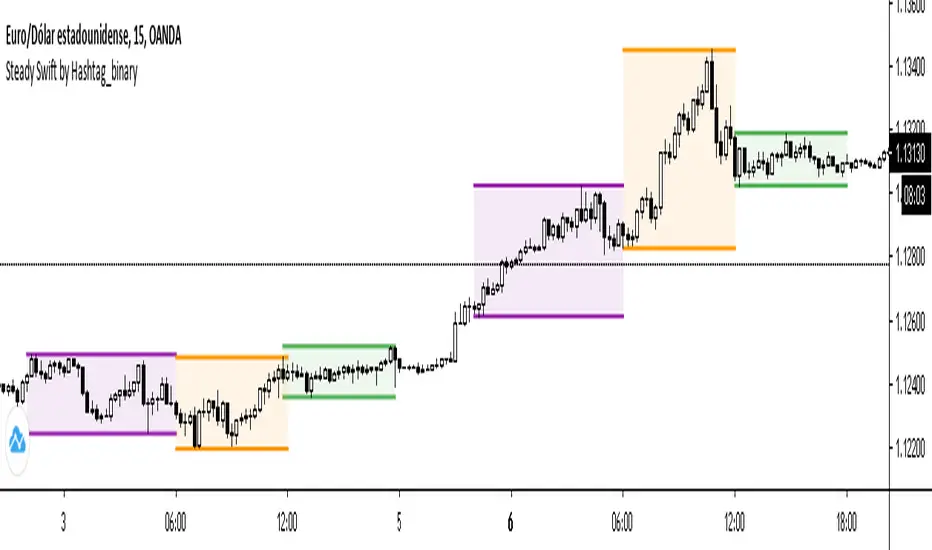
Steady Swift by Hashtag_binarySteady Swift is an indicator that shows the forex sessions and the highest and lowest points of each session of the day.
The sessions that appear on the indicator are Tokyo, London and New York.
The calculation of each session is per hour and goes from 0 to 24 hours, where point 0 begins in the Tokyo session.
In the settings part sessions can be selected or removed, just as you can choose if you want the high and low points to be measured from the wick or the body of the candle, and you can also place the colored background or remove it if you wish (as a preference it is better to leave the background color).
The lines (either current or past) of the high points and the low points of each session can be modified in thickness.
There is a variety to choose the color of the sessions. Even modify the term of each session.
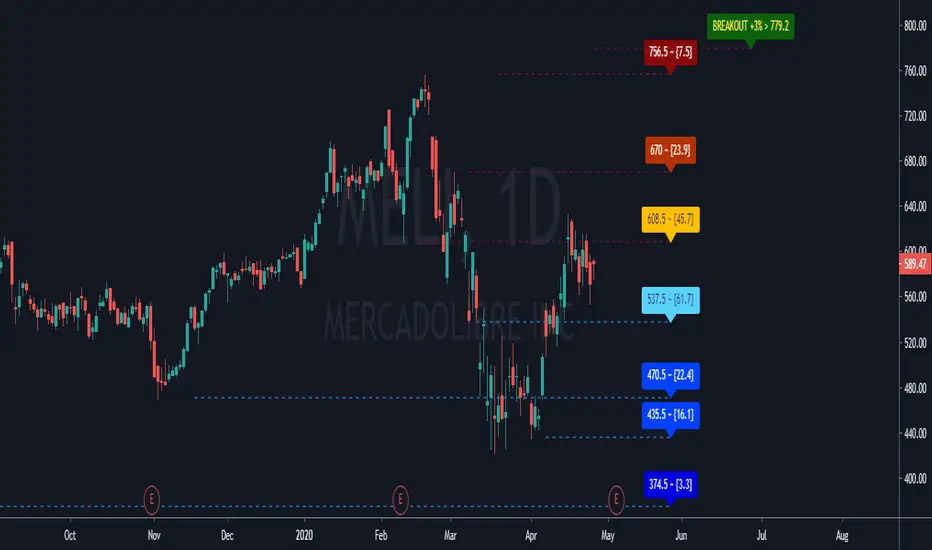
Major Event Price Indicators (Coronavirus Lows)This very simple script adds a corridor for two low price ranges, where Corona started to hit. Useful to visualize where a stock currently trades at, relative to the Corona / Covid-19 crisis.
Can easily be adjusted for different dates regarding any major events, crashes. Useful when you run out of Alarms and just want to see "is that still below or above where it was before ?".
Add as many dates as you want, just alter the names of each indicator.
Built upon the script of vitvlkv.

CPR by Anand with PDL/PDH & Breakouts 15/30 minsThis is an enhanced version of CPR by Anand with Configurable previous day high and low and option to configure breakout lines of 15 and 30 mins.
Will be an useful tool for day traders who follows CPR tricks and breakouts.

GC Supports & ResistancesThe indicator display the supports and resistances available. Breakout also are reported in case that not exists at least three resistances.
Does print lines and labels with each identified data (S, R and BO).
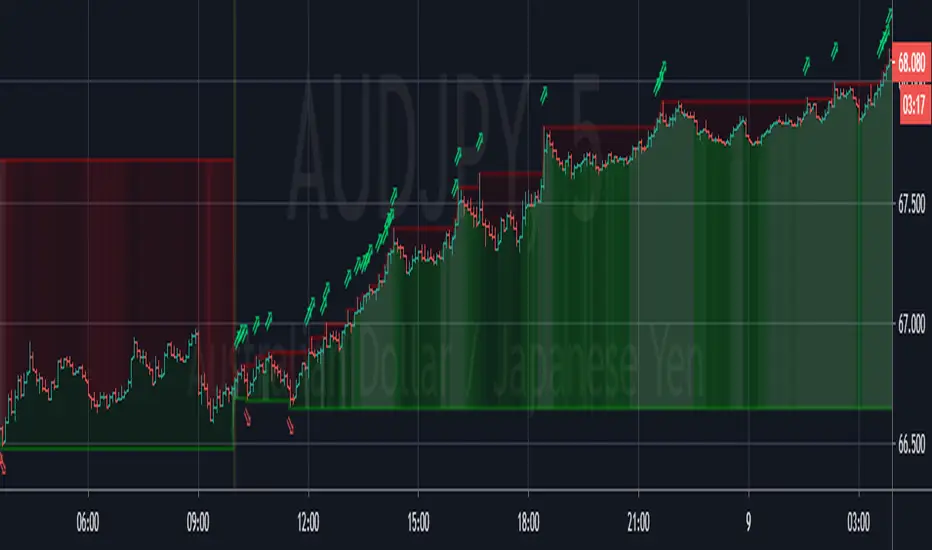
[Zekis]Opening Range Higher High Lower Low Forex SessionsOpening Range Higher High Lower Low Forex Sessions
Very useful for session trading, the opening range will reset when new session is start and will plot new higher highs and new lower lows until the end of the session.
Ability to change between 3 opening sessions:
* London - opens at 3:00 am EST
* New York - opens at 8:00 am EST
* Tokyo - opens at 7:00 pm EST
* New day - GMT +0
Green arrow - new higher high
Red arrow - new lower low
Green background - the strength of the bullish trend
Red background - the strength of the bearish trend
(the lighter the color, the stronger the trend)
Enjoy!
@zekis
Hi-Lo VT-Trader24月 1
日足以下のチャートで、選択している通貨の日足を表示します。
Displays the daily basis of the selected currency on the chart below the daily basis.
security()を使用する際の塗り直しを回避する方法を反映
Reflects how to avoid repainting when using security()

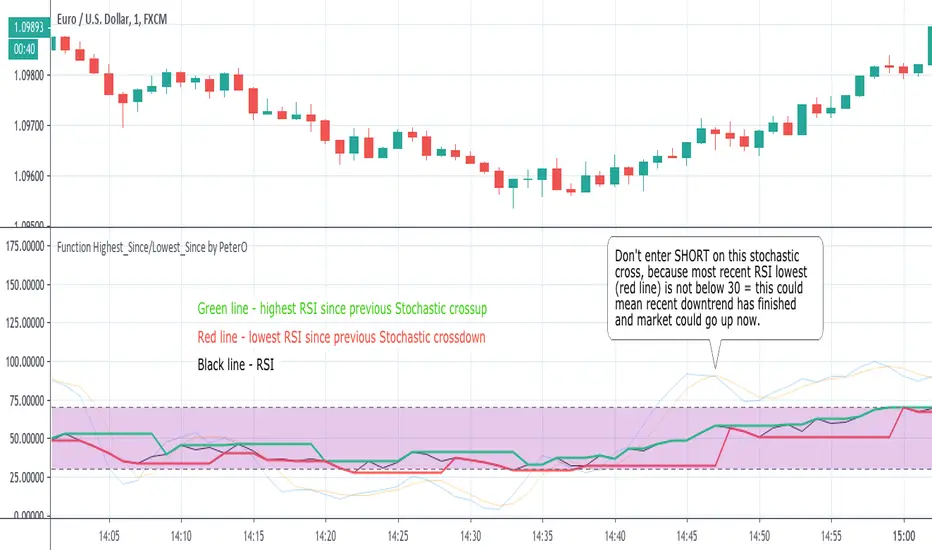
Function Highest/Lowest by PeterONo matter how much I like PineScript, there are still things missing in the language. One of the most annoying issues is that you cannot set dynamic length value for highest/lowest functions. This length must be fixed integer. But it doesn't make sense in a lot of cases, when you'd like to know what was the highest/lowest value of a series SINCE EVENT in the past, but you don't know WHEN this event exactly happened.
Us, coders would like to do this: `highest(series,barssince(...))`
But it is not working.
Numerous coders are using RicardoSantos' f_highest/f_lowest script (), probably the most often copy/pasted snippet of PineScript code out there. It is doing more-less what `highest(series,barssince(...))` would be doing, but with hardcoded max bars back.
Ricardo is my idol by the way, but that didn't stop me from creating my own version of Highest/Lowest functions. They are fast, simple, effective and very light for Pine engine.
Please treat this as an OPEN SOURCE snippet of code, which can be used in variety of ways.
I have implemented a simple use-case myself, to demonstrate what can be done. The example shows what was the highest/lowest value of RSI since the previous cross of Stochastic. So that you don't enter SHORT on Stochastic crossunder, if RSI didn't reach oversold (<30) since the previous Stochastic crossunder = aka maybe the downtrend has exhausted.
I'm sure you'll find plenty of use cases for it in your studies and strategies as well. If you create your own code using my Highest/Lowest functions, don't hesitate to put a link down here in comments.
P.S. This is not a strategy in any way, so don't ask me "does it backtest well?".
P.S.2 This code doesn't repaint as well ;)
ORB 15 Min By EquityDurai#Let the index/stock trade for the first fifteen minutes and then use the high and low of this "fifteen minute range" as support and resistance levels.
#A buy signal is given when price exceeds the high of the 15 minute range after an up gap.
#A sell signal is given when price moves below the low of the 15 minute range after a down gap.
#It's a simple technique that works like a charm in many cases.
>If you use this technique, though, a few caveats are in order to avoid whipsaws and other market traps.
>The most common whipsaw is a trading range that lasts longer than 15 minutes.
>If an obvious range builds in 20, 25 or even 30 minutes , use those to define your support and resistance levels.
>Also consider the higher noise level in the morning.
>A breakout that extends only a tick or two can be easily reversed and trap you in a sudden loss.
>So let others take the bait at these levels, while you find pullbacks and narrow range bars for trade execution.
