Mid to High daily % - MA & ThresholdPurpose of this script is to provide a metric for comparing crypto volatility in terms of the % gain that can be garnished if you buy the midpoint price of the day and sell the high***. I'm specifically using bots that buy non-stop. This metric makes it easy to compare crypto coins while also providing insight on what a take profit % should be if I want to be sure it closes often instead of getting stuck in a position.
Added a few moving averages of (Mid-range to High Daily %). When these lines starts to trend down, it's time to lower the take profit % or move on to the next coin.
Decided to add a threshold so I could easily mark where I think the (Mid-range to High Daily %) is for most days.
Ex. I can mark 10% threshold and can eyeball roughly ~75% of the days in the past month or so were at or above that level. Then I know I have plenty volatility for a bot taking 5% profit. Also if you have plenty of periodic poke-through that month (let's say once a week) you might argue that you can set it to 7% if you're willing to wait about that long. Either way this metric is conservative because it is only the middle of the range to the high, a less conservative version might provide the % gain if you bought the day low and sold the day high.
***Since this calculation only takes the middle of the range and the high of the day into account, red days are volatile against a buyer but to your advantage if you are a seller. BUT if you have plenty of safety buy orders this volatility in price only means your total purchase volume increases and when/if you reach a take profit level you sell more there.
Would like to upgrade and add a separate MA line for green days and a separate MA line for red days to discern if that particular coin has a bias. Also would like to include some statistics on how many candles are above or below threshold for a certain period instead of eyeballing.
High-Low Index

SAR-adjusted extremesThis indicator shows how far (i.e. the absolute distance) of the extremes (i.e. high & low) are from the current parabolic SAR

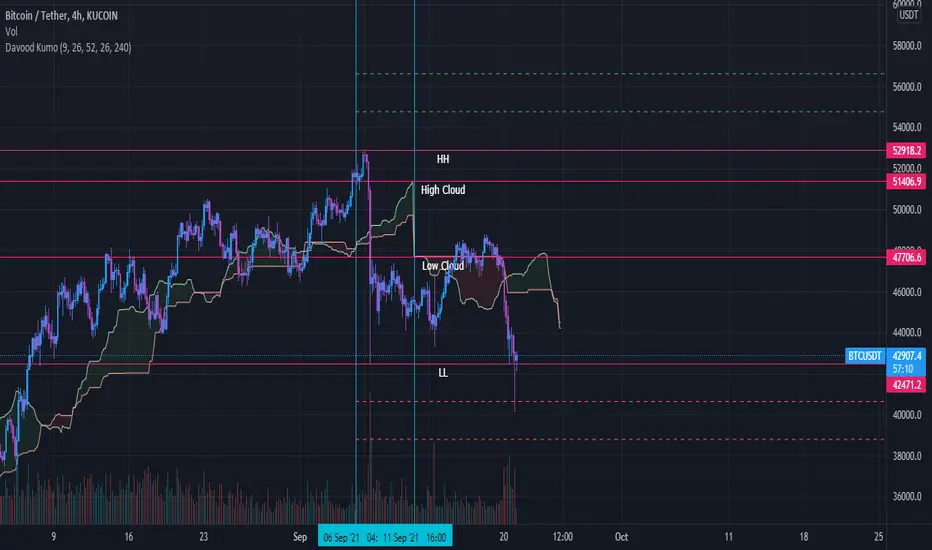
Davood Kumothis andicator is build in base of ichimoku cloud.
Select the interval at which the kumo clouds change phase and depending on what time frame we are in, we give the time inputs to the indicator.
then, the indicator calculates the area of the cloud and set the ascending and descending targets when price break the highest or lowest candle in that time range.
So entry point is the highest and lowest candle and first and second targets are determined by the indicator.
note : i used this andicator only in crypto market not forex and it works well
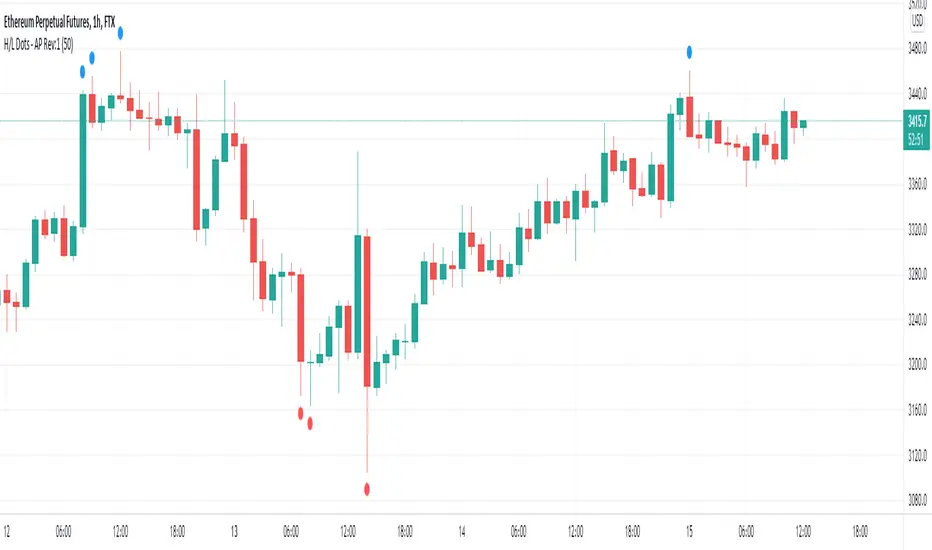
Recent High/Low Dots by Alejandro PSimple indicator that plots a dot in the chart when a candle breaks the high of the past X candles.
This is useful to easily visualize when the market is coming out of a range and making fresh highs or lows relative to the past X candles.
It can be used in trend following systems as an additional filter for validation.
Trend Background by Alejandro PThis indicator is a comprehensive trend indicator designed to help traders filter market conditions for their trading.
The indicator has the option to use a classic Simple Moving Average as a trend filer or a more advanced Simple Moving Average Slope.
The indicator can also use the Aroon indicator as the trend filter and both the SMA and Aroon can be used together to only trade in strong trends.
The Simple Moving Average Slope and the Aroon filters can allow you to filter our 3 market conditions. 1- Upwards Trend, 2- Downwards Trend, 3- Ranging
By tuning these filters to your strategy you can make sure you are only taking trades when the trend is on your side and you can even filter out ranging market conditions to trade the best strategies depending on the market conditions.
Technical details:
If the Simple Moving Average filter is on and the Slope filter if off the indicator will determine the trend by where the price is relative to the moving average. If the price is higher than the SMA then the trend will be bullish, if the price is below the SMA the trend will be bearish.
If SMA filter and Slope FIlter are both on then the trend es defined by the slope of the SMA, this means that if the SMA slope is increasing then the trend will be bullish, if the slow is negative then it will be bearish, but if the slope is within a certain percentile that is classified as neutral then there will be no trend or a neutral market.
If the Aroon filter is enabled this will calculate the trend by the percent of candles with new highs or lows in a similar way as the SMA slope filter works
If both filters are enabled then both filters will have to coincide for a bull or bear trend to be determined.

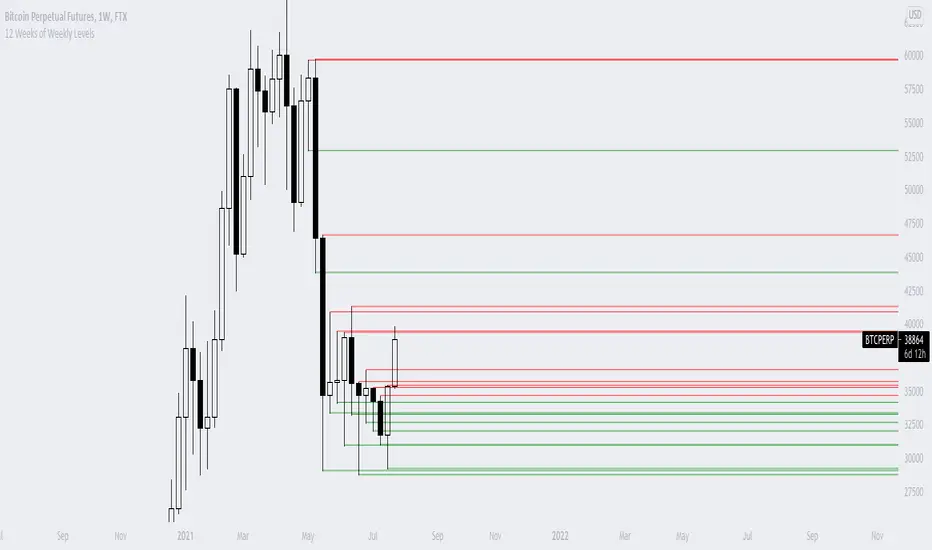
12 Weeks of Weekly LevelsA very simple indicator, which basically looks back on the past 12 weeks at 8PM EST and finds the highs and the lows. Once it finds those levels, it draws them as horizontal rays on the chart. The lows are drawn in green (to indicate previous buy zones) and the highs in red (to indicate previous sell zones). No user inputs are required
Nothing fancy, just weekly levels for the past quarter. You can easily draw these on a chart yourself, but it becomes very time consuming if you are watching a bunch of instruments and then Sundays come around.
Special shoutout to rumpypumpydumpy on StackOverflow for helping me work out the kinks, this is the first indicator I ever created. Hope it helps you find confluence in your decision making
Tripple super Trend + EMA + RSI StrategyGreetings!
Here I show you the Tripple Super Trend Strategy.
I discovered the strategy on a YouTube channel and tried to transfer it as a strategy into a script.
Tested with the currency pair EUR/USD in the one hour chart.
Period: beginning of 2020 until today.
The strategy should also work with cryptocurrencies. But then the settings have to be adjusted.
There is the possibility to activate only long or only short position.
The EMA can be used in a time different from the chart.
-----------------------------------------------------------------------------------
How does the strategy work?
For long positions, the candle must be above the EMA .
The candle must be closed above at least two of the supertrend lines.
The stochastic RSI must show oversold and the k line must cross over the D line.
For short positions, the candle must be below the EMA .
The candle must be closed below at least two of the supertrend lines.
The stochastic RSI must indicate overbought and the K line must cross below the D line.
The stop loss is determined with the "lowest low/highest high lookback".
The profit factor is multiplied by the value of the lowest low/highest high lookback.
The results of the strategy are without commissions and levers.
If you have any questions or feedback, please let me know in the comments.
In the future I will add other types of stop loss / take profits. (ATR; %; eg.)
If you need more information about the strategy and want to know exactly how to apply it, check out my profile.
I wish you good luck with the strategy!

Open Range Breakout with TSLThis ORB with TSL Indicator Session Time is Indian NSE and BSE Equity Market
This indicator Provide you 2 type Setup
Opening Range Plot Only for Observation
1st Range Breakout = Long
2nd Range Breakout = Short
How to work This Indicator?
When Market is Open This Indicator automatically Plot Opening Range High and Low,
if Market bullish & Candle Close above Opening Range high When This Indicator automatically Plot 1st Range High and Low if You Want to 1st Range High Plot Crossingup any Candle You can Also Add Alerts
if Market Bearish & Candle Close Below Opening Range Low When This Indicator automatically Plot 2nd Range High and Low if You Want to 2nd Range Low Plot CrossingDown any Candle You can Also Add Alerts
If you Have any Suggestion please mention here
Thank you so much
This Also Automatically start trailing SL on basis of ATR

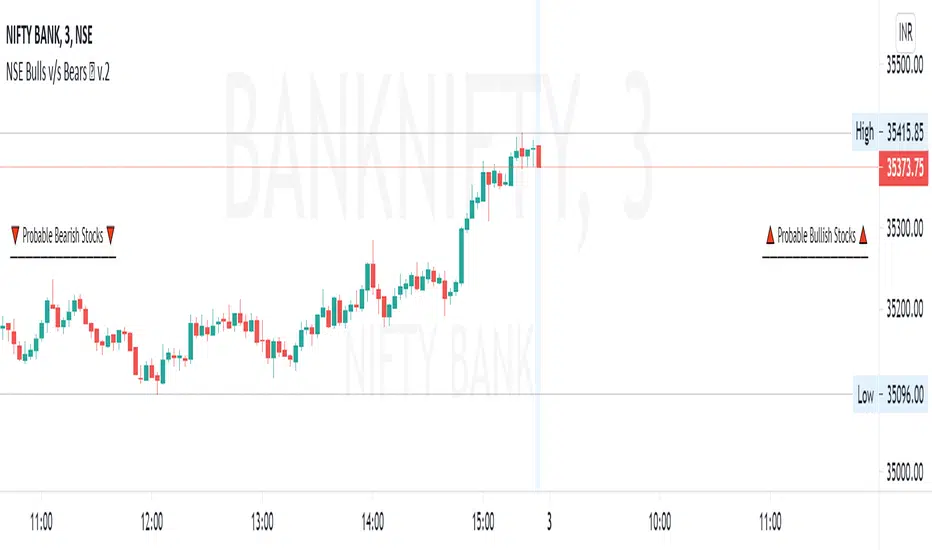
Nifty50 Bullish Bearish Scanner▪ How to use ?
The Screener has 40 stocks which are selected from NSE Nifty50 (list is given below) (cannot be editable) and after 9:15 am IST, it will scan most probable Bullish and Bearish stocks, both stocks will be labelled separately.
▪ Entry may be made at specified near the Stock name and target and SL is also mentioned nearby. Priority to be given to the stop-loss first. User can change profit percentage and Stop-loss percentage as per need, max. 10% can be done, default SL = 0.5% and Profit = 2%. Do use the indicator with other analysis, indicators, strategies, etc. Do not wait for target to hit, also use your calculations to book profit.
▪ How the figures are calculated ?
Conditions for Bullish and Bearish are calculated when trade day starts, and the default timeframe is for 1 Day (i.e.-Current Whole Day)
means the target and stop-loss are for intraday whole day, which can be changed to week, month, etc., Here Entry points are calculated depending upon the current days open price, with consecutive profit and stop-loss are calculated. The Percentage profit and stop-loss are
calculated including previous days price also, confusion to be avoided with figures.
▪ Caution :
If in morning any stock comes in any of list and if it goes from that list, that means the reversal took place for that stock(s) and stop-loss is hit. If any stock is opened Gap-Up or Gap-Down that it will come in either of the Bullish / Bearish stocks, then those stocks maybe
avoided.
▪ Which Nifty50 Stocks are included ?
Top 40 stocks from NSE Nifty50 are selected which are included are below =
ADANIPORTS, ASIANPAINT, AXISBANK, BAJAJ_AUTO, BAJFINANCE, BHARTIARTL, BPCL, BRITANNIA, CIPLA, DIVISLAB, DRREDDY,
EICHERMOT, GRASIM, HCLTECH, HDFC, HDFCBANK, HEROMOTOCO, HINDALCO, HINDUNILVR, ICICIBANK, INDUSINDBK, INFY
ITC, JSWSTEEL, KOTAKBANK, LT, M_M, MARUTI, RELIANCE, SBILIFE, SBIN, SUNPHARMA, TATACONSUM, TATAMOTORS, TATASTEEL
TCS, TECHM, TITAN, UPL, WIPRO.
▪ Indicator options :
Choice to hide bearish / bullish stocks labels, change background color of label, change text color of label, user can change position of label from the current bar, modify stop-loss and profit percentage.
▪ Alerts
You can create an alert from it easily. No additional configuration is required, message and alert on close is used the code.
The current timeframe candle is considered as alerts is set to once per bar close.
▪ Note: The initial load may be slow. If something doesn't seem to work, you can try the following:
- wait more time for it to load.
- hide & show or remove & add back to chart.
- don't add the indicator to chart multiple times in a short amount of time, as you may be rate limited
- Remember that majority of indicators fails in a sideways market, also every indicator is not 100% accurate.
▪ Disclaimer
Please remember that past performance may not be indicative of future results.
Due to various factors, including sudden changing market conditions, the indicator may not perform good.
This description and the indicator don’t provide any financial advice.
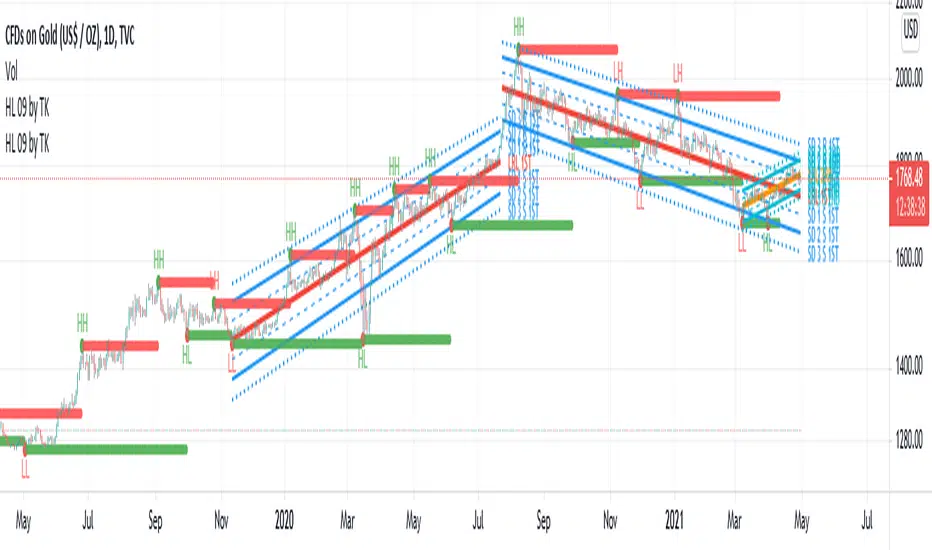
TradiKator 09 HH HL LH LL & Linear Regression
TradiKator 09 HH HL LH LL & Linear Regression indicates whether current price movement exceed the trend or not.
Here, we use Higher High,Higher low, Lower High, Lower Low to identify a possible change of trend.
Also we use 2 Linear Regression Channels (short term & long term) to identify a price trend.
I hope this indicator can help traders to estimate trend change in the essential trading behavior.
1)Higher High,Higher low, Lower High, Lower Low
Higher High and Higher Low indicates a Bull trend
Lower High and Lower Low indicates a Bear trend
Those high low pivot points is a verg good mark to judge if current trend keeps going on or not.
Setting :
Left pivot length
Right pivot length
The longer pivot length is , the less sensetive and more delay you signal will be, especially the right privot
2)Linear Regression Channels
Linear Regression Line – is a line drawn according to the least-squares statistical method which produces a best fit line
The resulting can be used to predict price trend from the same system.
Setting :
Count ---> the length of the Linear Regression, remember more data in interest = less accuracy and bigger sigma
The End bar of Linear Regression ---> If you don't want latest K bar in the Linear Regression interest (they are not in the same trend), then you can move the Linear Regression to earlier bar
This indicator is inspired by GDT who is a great coder.
Known issue:
Not yet.
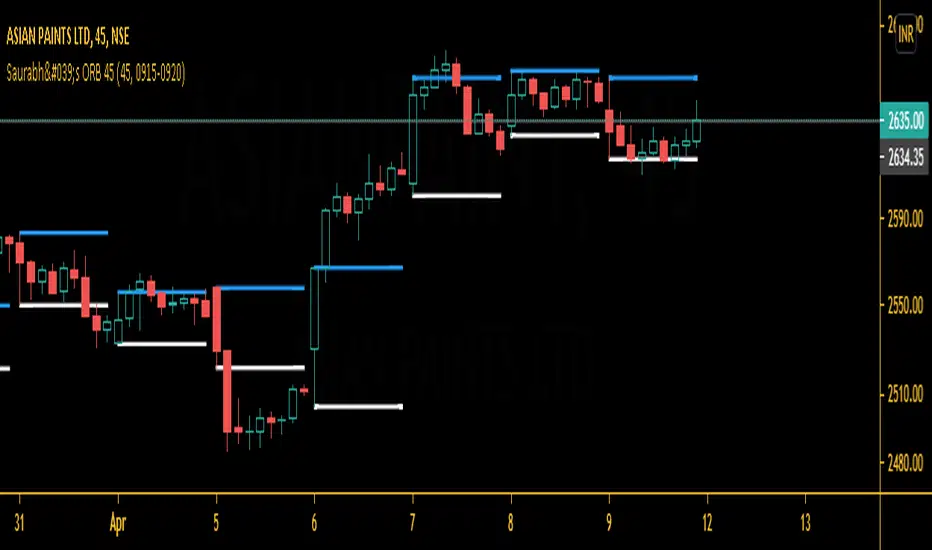
Saurabh's ORB 45This is indicator is all about opening range breakout on 45 mins charts.
|
|
|
|
|
which can be useful to day trader as a breakout strategy following the trend. Useful in 45 mins charts. Also, you may change the time frame from settings according to your likes.
Give thumbs up if you like it.
MicroStrategy Software Business Share PriceSimilar to the MicroStrategy Premium script. This indicator derives MSTR's core software business value by calculating its Bitcoin holdings as a percentage of market cap. Thus you can do, (1 - Bitcoin holdings as a % of market cap) * current share price = Core business share price

Cumulative Pivot HighLowThis indicator counts number of higher highs/lows and number of lower highs/lows and calculates trend based on that.
Indicator line shows (sum of higher highs/lows - sum of lower highs/lows) derived from last loopback periods. Indicator is green if last two consecutive highs/lows formed are on higher side. Red if on lower side. (Consecutive numbers can be controlled by parameter direction_threshold )
combineHighsAndLows if unselected shows not cumulative version but last consecutive highs and lows marked in red or green according to the trend.


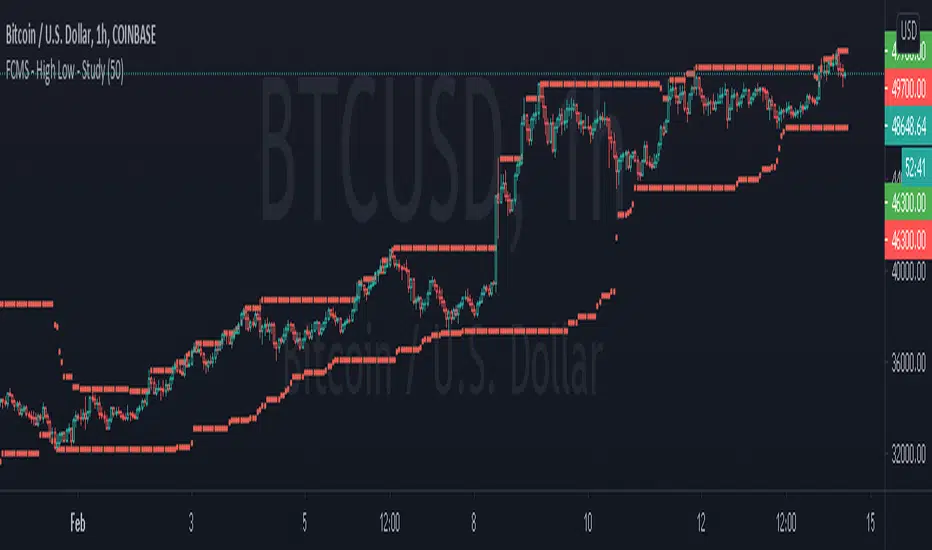
FCMS - Arrays Exercise - High Low with Arrays - StudyThis is just a script to exercise the use of arrays on pine script.
I think we could say that every for loop we had in pine script before the arrays, is eligible to become an array.
Our script will get more efficient and more reliable.
As every "if" case is elegible to became a function
I confess I was addicted to use if, else if, else in my codes, but recently i've been updating my scripts and it's became more efficient
I couldn't find an array function that insert an value removing the oldest one, so I'm using this condition to "shift" the first value.
I'll update as soon as I find a better way to do it.
In any case, for this specific goal, we already have an built in function, as I let on script
All-time high and percentage dropsThis script calculates the ATH of whichever chart you use and plots it in blue
There is also an option to display the following ATH percentages: 90, 80, 70, 60, 50, 40 and 30 in white

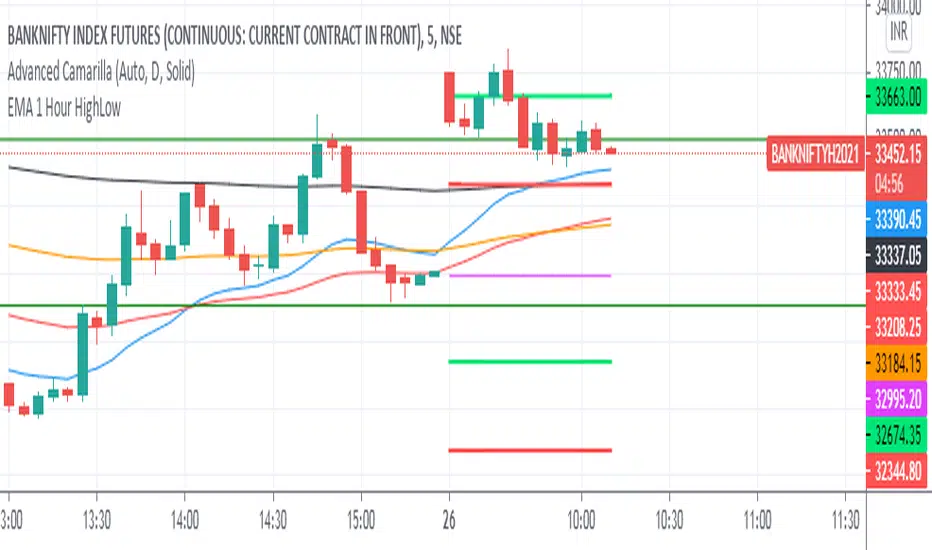
1st Hour High and Low ISRDaily Range :
1st Hour High and Low From Market Start Time
ISR = Initial Support Resistance
sDEFI Synthetix ExchangeStudy plotting sDEFI per sips.synthetix.io
Scale on the axis is not correct, it will always show whatever the base asset you open and hide. Use this study only for visual charting.

Donchian Channel - Pivot High-LowCombining Pivot High Low and Donchian Channel - both of which are useful indicators for trend following.
Donchian Channel shows highest and lowest prices for X number of bars.
Pivot High-Low identifies when price made new Highs and Lows
Applying Donchian Channel on Pivot High-Low channel, we are plotting highest and lowest pivots formed in X bars.
In this indicator, we have 3 options for Channel Base :
Price : This is regular Donchian channel based on High-Low Price
Pivots : This is Donchian channel based on pivot points.
Combined : Combines both. Takes highest of Price and Pivots for plotting high, lowest of Price and Pivots for plotting low

HTF Trend FilterTrend filter based on higher timeframe candles. Can be used as entry filters.
Checks if last 3 higher timeframe candles are in fully ascending order or fully descending order. Additionally you can also check if close price is above min of last two highs or below max of last two lows.
Lime and Orange candles imply partial trend in higher timeframe. (only last 3 candles align)
Green and Red candles imply complete trend. (last 3 candles align along with current close price).
Just an experiment. Can be further improved,

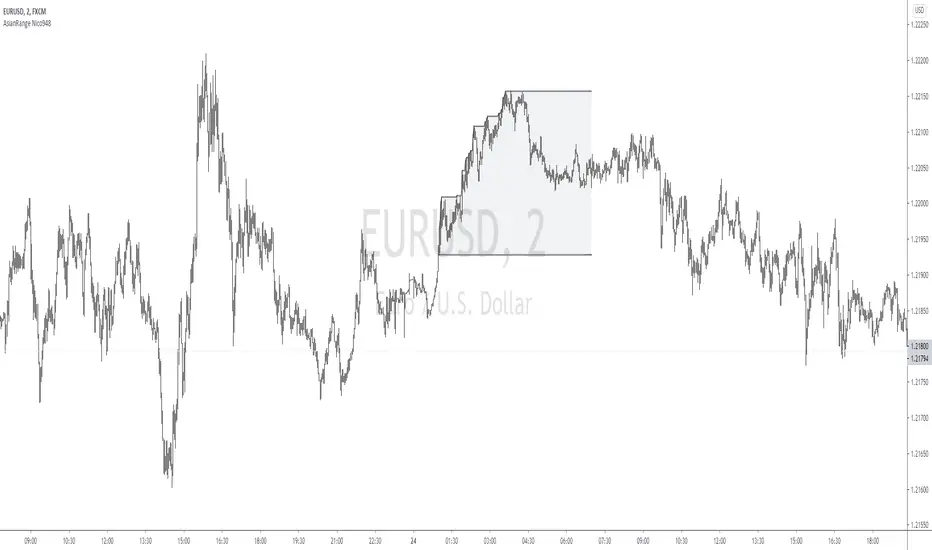
Asian Range by Nico948Displays the Asian session range on your graph.
Masked for timeframes higher than 15 minutes.
However, it can be displayed on 1 hour timeframe by filling in the relevant box in the parameters.
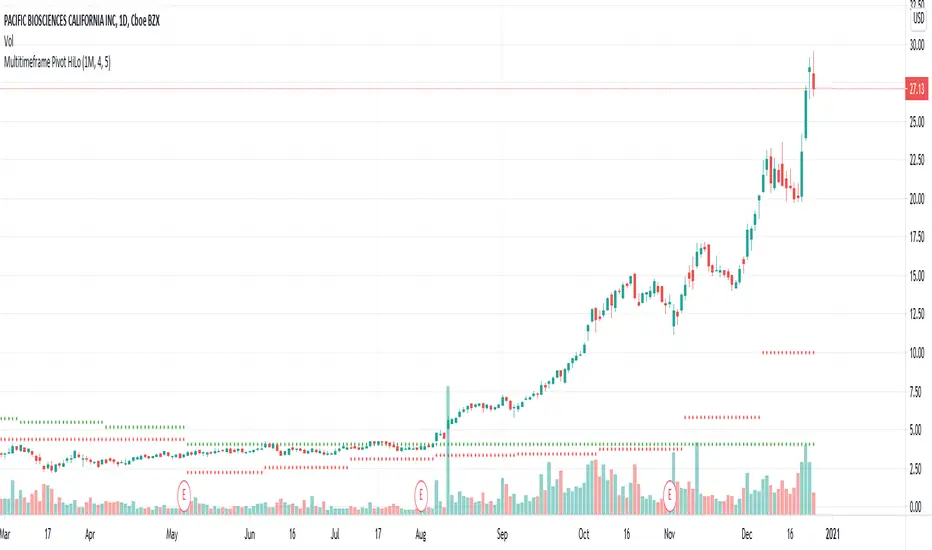
Multitimeframe Pivot HiLoPivot High/Low for multi timeframes.
Could be great entry filter to include multi time frame pivots in trend trading strategies.
Rabbit HoleHow deep is the Rabbit hole? Interesting experiment that finds the RISING HIGHS and FALLING LOWS and place the difference between the highs and lows into separate arrays.
== Calculations ==
In case current high is higher than previous high, we calculate the value by subtracting the current highest high with the previous High (lowest high) into array A,
same method for the lows just in Array B.
Since we subtract highs and lows it means velocity is taken into consideration with the plotting.
After adding a new value we remove the oldest value if the array is bigger than the Look back length. This is done for both lows and highs array.
Afterwards we sum up the lows and highs array (separately) and plot them separately, We can also smooth them a bit with Moving averages like HMA, JMA, KAMA and more.
== RULES ==
When High Lines crosses the Low Line we get a GREEN tunnel.
When Low Lines crosses the High line we get the RED tunnel.
The Greenish the stronger the up trend.
The Redish the stronger the downtrend.
== NOTES ==
Bars are not colored by default.
Better for higher time frames, 1 hour and above.
Enjoy and like if you like!
Follow up for new scripts: www.tradingview.com
