two_ma_logicLibrary "two_ma_logic"
The core logic for the two moving average strategy that is used as an example for the internal logic of
the "Template Trailing Strategy" and the "Two MA Signal Indicator"
ma(source, maType, length)
ma - Calculate the moving average of the given source for the given length and type of the average
Parameters:
source (float) : - The source of the values
maType (simple string) : - The type of the moving average
length (simple int) : - The length of the moving average
Returns: - The resulted value of the calculations of the moving average
getDealConditions(drawings, longDealsEnabled, shortDealsEnabled, endDealsEnabled, cnlStartDealsEnabled, cnlEndDealsEnabled, emaFilterEnabled, emaAtrBandEnabled, adxFilterEnabled, adxSmoothing, diLength, adxThreshold)
Parameters:
drawings (TwoMaDrawings)
longDealsEnabled (simple bool)
shortDealsEnabled (simple bool)
endDealsEnabled (simple bool)
cnlStartDealsEnabled (simple bool)
cnlEndDealsEnabled (simple bool)
emaFilterEnabled (simple bool)
emaAtrBandEnabled (simple bool)
adxFilterEnabled (simple bool)
adxSmoothing (simple int)
diLength (simple int)
adxThreshold (simple float)
TwoMaDrawings
Fields:
fastMA (series__float)
slowMA (series__float)
emaLine (series__float)
emaUpperBand (series__float)
emaLowerBand (series__float)
Example

Papercuts Time Sampled Higher Timeframe EMA Without SecurityThis EMA uses a higher time sampled method instead of using security to gather higher timeframe data.
Its quite fast and worked well with the timeframes prescribed, up to 8hrs, after 8hrs, the formatting gets more complicated and i probably wouldn't use it anyway.
You can use this as a guide to avoid security and even f_security with this method.
NOTE: This includes the non repainting f_security call so that i woudl be able to check my results against what it does, thats not nessecary to keep at all.
There is some minor differences in data, but its so minor it doesnt bother me, though it would be interesting to know what the difference actually is. If anyone figures that out, leave a comment and let me know!
This is meant to be an example for others to build and learn and play with.. so enjoy!

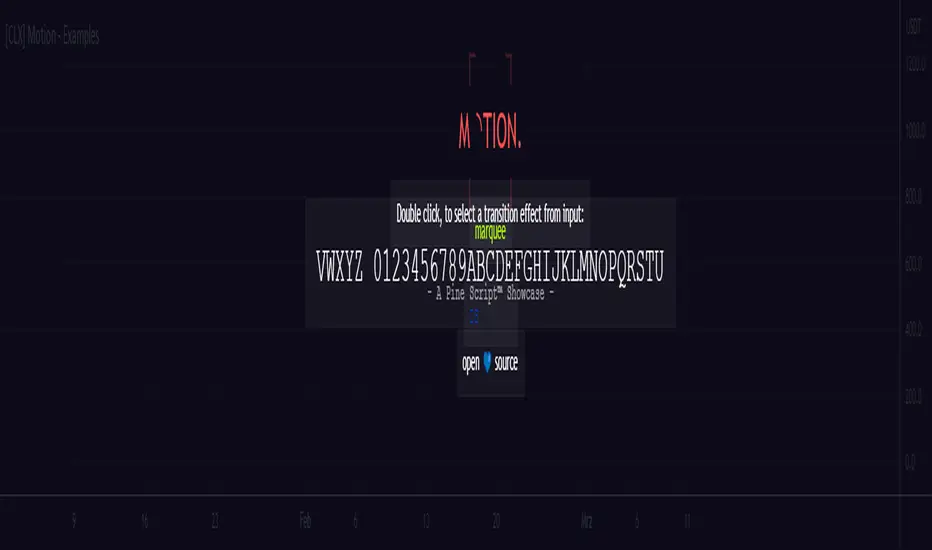
[CLX] Library Motion - Examples📑 Showcase
This is ready-to-show indicator version of the example code form the `motion` library. It can be used to create string- or color-based effects.
Library:
================================================================================
📑 Setup
To use this library in your own scripts, you must first import it. To do this, add the following line to the top of your script:
import cryptolinx/Motion/1 as motion
Next, create a `keyframe` object by using the `varip` keyword.
varip myKeyframe = motion.keyframe.new(_intv = 1, _steps = 1)
Based on your needs, you can now use one of the simplified functions to create a transition effect, or you can use the `transition()` or `iteration()` function to create a custom transition effect.
📑 Simplified Functions:
(direct output)
// motion.marquee(keyframe myKeyframe, string _seq, int _ws, int _maxLoops, bool _ltr)
motion.marquee(myKeyframe, 'Hello World!', 3, 0) // 0 = infinite loops
// motion.slideInLeft(keyframe myKeyframe, string _seq, int _ws, int _maxLoops, bool _refill)
motion.slideInLeft(myKeyframe, 'Hello World!', 3, 0) // 0 = infinite loops
// motion.slideOutLeft(keyframe myKeyframe, string _seq, int _ws, int _maxLoops, bool _refill)
motion.slideOutLeft(myKeyframe, 'Hello World!', 3, 0) // 0 = infinite loops
// motion.slideInRight(keyframe myKeyframe, string _seq, int _ws, int _maxLoops, bool _refill)
motion.slideInRight(myKeyframe, 'Hello World!', 3, 0) // 0 = infinite loops
// motion.slideOutRight(keyframe myKeyframe, string _seq, int _ws, int _maxLoops, bool _refill)
motion.slideOutRight(myKeyframe, 'Hello World!', 3, 0) // 0 = infinite loops
// motion.blink(keyframe myKeyframe, string _seq, int _ws, int _maxLoops)
motion.blink(myKeyframe, 'Hello World!', 3, 0) // 0 = infinite loops
(indirect output)
// After you create a transition, you can use the `output` field of the `keyframe` object to get the result.
// motion.marquee(myKeyframe, 'Hello World!', 3, 0)
myKeyframe.output
Ichimoku (lib-hlm)An example of how to implement Ichimoku in other scripts using my `lib-hlm`.
You can copy and paste this code into any `\\@version=5` indicator to add Ichimoku to it.

ALL Ticker ID informationAn example and overview of the syminfo and tickerid functions to be able to access different tools.
Here is an example of accessing the Bitfinex exchange (and requesting "instrument name") when another exchange is open (BINANCE:BTCUSDT)
There is a difference in name between BINANCE:BTCUSDT and BITFINEX:BTCUSD exchanges
Try swapping //
T = "BITFINEX:"+str.tostring(syminfo.basecurrency)+"USDT"
//T = "BITFINEX:"+str.tostring(syminfo.basecurrency)+"USD"
The script will show that this instrument does not exist "Error in the value of the instrument. There is no such currency!"
Implemented Resolve error handling with the ignore_invalid_symbol=true parameter, this gives further processing of the script without errors.
----------------------------------------------------------
Пример и обзор функций syminfo и tickerid для возможности доступа к разным инструментам.
Здесь реализован пример доступа к бирже Bitfinex(и запрос "названия инструмента"), когда открыта другая биржа (BINANCE:BTCUSDT)
Существует разница в названии между биржами BINANCE:BTCUSDT и BITFINEX:BTCUSD
Попробуйте поменять // местами
T = "BITFINEX:"+str.tostring(syminfo.basecurrency)+"USDT"
//T = "BITFINEX:"+str.tostring(syminfo.basecurrency)+"USD"
Скрипт выдаст, что данного инструмента нет "Ошибка в значении инструмента. Такой валюты нет!"
Реализована Обработка ошибки Resolve error с помощью параметра ignore_invalid_symbol=true это дает дальнейшую обработку скрипта без ошибок.

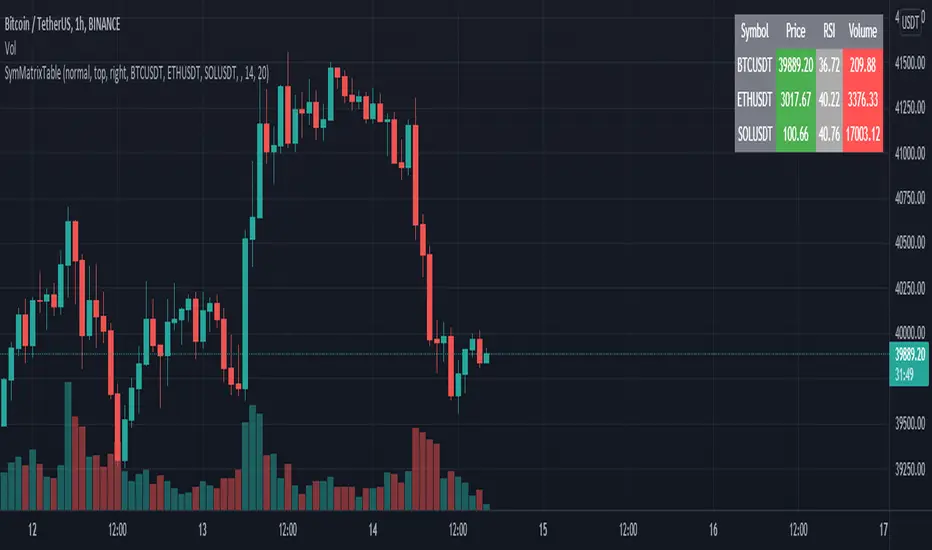
SymMatrixTableSimple Example Table for Displaying Price, RSI, Volume of multiple Tickers on selected Timeframe
Displays Price, RSI and Volume of 3 Tickers and Timeframe selected by user input
Conditional Table Cell coloring
Price color green if > than previous candle close and red if < previous candle close
RSI color green if < 30 and red if > 70 (RSI14 by default)
Volume color green if above average volume and red if less than that (SMA20 volume by default)
Can turn on/off whole table, header columns, row indices, or select individual columns or rows to show/hide
// Example Mixed Type Matrix To Table //
access the simple example script by uncommenting the code at the end
Basically I wanted to have the headers and indices as strings and the rest of the matrix for the table body as floats, then conditional coloring on the table cells
And also the functionality to turn rows and columns on/off from table through checkboxes of user input
Before I was storing each of the values separately in arrays that didn't have a centralized way of controlling table structure
so now the structure is :
- string header array, string index array
- float matrix for table body
- color matrix with bool conditions for coloring table cells
- bool checkboxes for controlling table display
Study forloop Star Triangle'Study forloop' pinescript Program to print star Triangle
The Program Logic
For example, the following Pinescript programme will need two nested for loops. The outer forloop is for rows and the inner forloop is for columns or stars. to create a triangle shape.

Bar Percent CompleteThis is an example script for checking how far the current bar has progressed towards it's completed state. This works for any time frame, eliminating extra logic calls and conversions for each timeframe.period. It is not intended to be a standalone indicator, but rather as a resource for additional logic triggers on the real time bar of a pine script.
The main caveat is that pine script calculations occur on a per-tick basis. This means that the completion percentage can exceed the percentage threshold before any logic is executed. This happens when the next tick occurs after the threshold. The relevance then will depend on the activity of the underlying asset. Longer time frames on low activity assets will likely be more relevant than their shorter time frame counterparts.

string2float v1.0In the v5 version of PineScript, casting a string to a float - float(x) - does not appear to work, in spite of the reference manual seemingly indicating that it should. The simplest test case that I could generate "float('4750.0')" would result in a "Cannot call 'float' with argument 'x'='4750.0'. An argument of 'literal string' type was used but a 'const float' is expected." Since I was pulling the floats from a string array, I could not find a way to make them into "const floats". So I gave up and wrote a quick and dirty string to float converter function that handles both positive and negative integers and floats and returns the a float. Hopefully it might save someone else an afternoon of insanity.... :-)

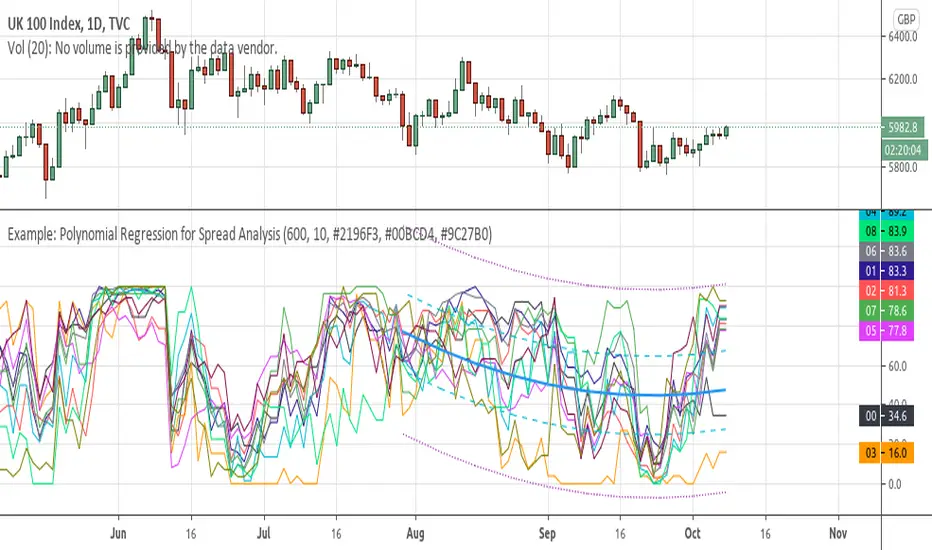
Polynomial Regression Style Examplejust a example on how to edit line style on the output of the polynomial regression library..

Date Range DemonstrationThis is a simple strategy that demonstrates how to easily incorporate a date range into a strategy. This allows you to limit your backtesting to a specific range of dates, which is vital if you want to compare different time frames.
To use:
Copy the code block between the '////' lines into your strategy.
Add the variable 'inDateRange' to your entry and/or exit strategy conditions.

Example - HTF Step InterpolationAbout this script:
This example aims to highlight an alternative way to view HTF data by providing basic interpolation functionality.
This script does not aim to provide use in itself as an indicator or strategy.
Reason for study:
Educational Purposes Only

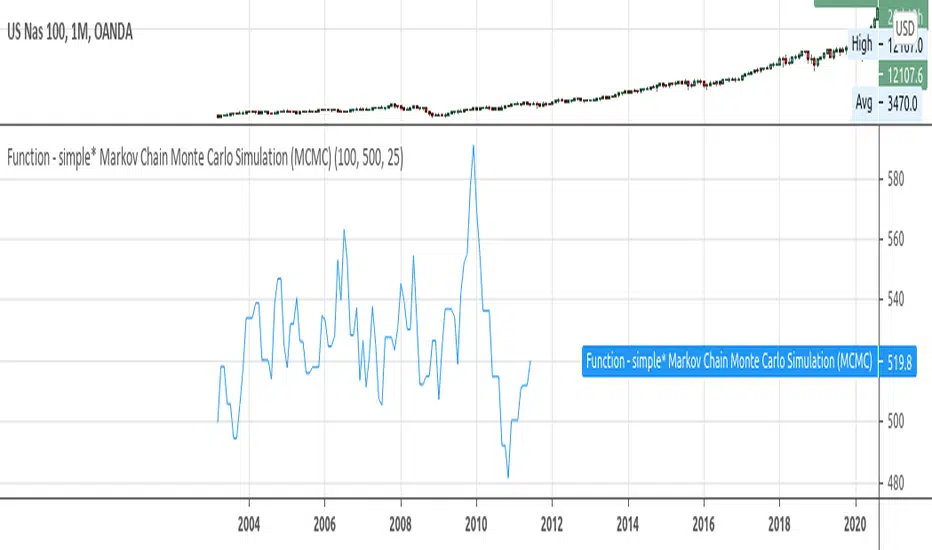
Function - simple* Markov Chain Monte Carlo Simulation (MCMC)Example function of a markov chain monte carlo simulation.
test - delta distributiona test case for the KDE function on price delta.
the KDE function can be used to quickly check or confirm edge cases of the trading systems conditionals.

Example - MA-Cross Retracement DetectionThe retracement tracker function(s) in this script outline how to:
Track conditions using "toggle" booleans.
Use multiple coinciding conditions to trigger an event just once.
What is a retracement?
"Retracements are temporary price reversals that take place within a
larger trend. The key here is that these price reversals are temporary
and do not indicate a change in the larger trend."
Quote Source: www.investopedia.com

Example - HTF Values Without 'Security()'This is an example of how to reference higher timeframe data without the
need for a 'security()' call.
I have attempted to create the function example:
f_insecurity()
with the purpose of wrapping up and pumping out all common relevent HTF
price data that's needed for your everyday indicators in a reliable fashion.

Stop loss and Take Profit in $$ exampleThis is a simple exit example in $$ (symbol's currency) for educational purpose .
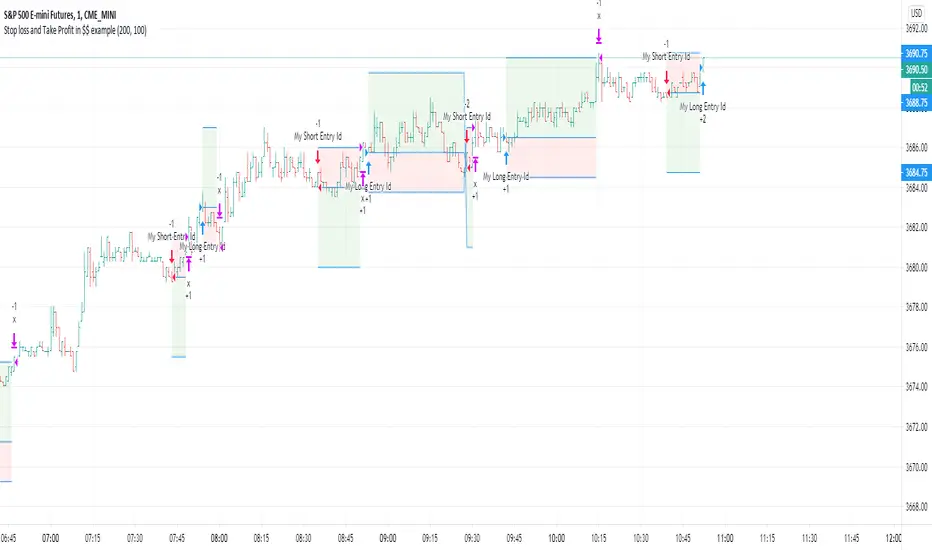
Stepped trailing strategy exampleThis is a stepped trailing exit example for educational purpose .
Short brief.
There are 1 stop loss and 3 profit levels.
When first tp is reached we move stop loss to break-even.
When second tp is reached we move stop loss to first tp.
When third tp is reached we exit by profit.

Example: Polynomial Regression for Spread AnalysisExample of applying polynomial regression channel to spreads or hedges between 2 assets.
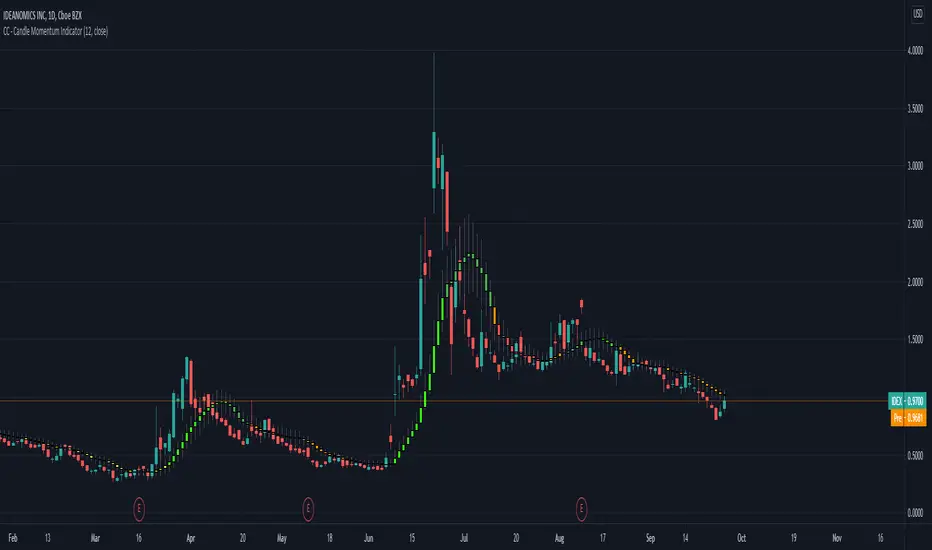
CC - Candle Momentum IndicatorA simple VWAP and SMA smoothing on the candles along with some momentum coloring. Basically, if the "slider" is slid all the way up and it turns red, moving down or losing volume t's probably going down. If it's all the way down and starts turning green, getting bigger and seeing volume, it's probably going up. this is a prototype indicator that I plan to extend using arrays and averages if it is seen as something useful.
CC - Array-meta Consolidated Interval Display (ACID)This script extends my other two Array examples (which I've also provided to you open source):
The Ticker-centric 5m,15m,45m,1h,4h,1d resolution labels using arrays:
And the more Macro VIX,GLD,TLT,QQQ,SPY,IWM 1d resolution labels using arrays:
This script aims to show how to use min/max/avg with Arrays easily. My next example after this will be exploring the usage of variance versus covariance ratios over different periodic interval resolutions. Currently, this is using the following intervals: 5m,15m,45m,1h,4h,1d. It takes these intervals, calculates the values at those resolutions and puts the absolute min and max from the 5 minute to the 1 day resolutions.
It's more of an example of the power that arrays can hold, as all this truly is right now is a min/max bound calculator. The real gem lies in the avg calculators for multiple resoltuions tied into a single label with readable data. Check out the code and let me know what you think. If you need more examples, the other two scripts I mentioned before are also open source.
Using this on intervals of less than 1D sometimes times out, the way I wrote it is memory intensive, may not work for non-pro users.
Thanks!
NONE OF THIS IS FOREWARD LOOKING STATEMENTS, THIS IS NOT A PREDECTIVE ANALYSIS TOOL. THIS IS A RESEARCH ATTEMPT AT A NOVEL INDICATOR. I am not responsible for outcomes using it.
Please use and give criticisms freely. I am experimenting with combining resolutions and comparing covariance values at different levels right now, so let me know your thoughts! The last indicator will likely not be open source, but may be depending on how complex I get.

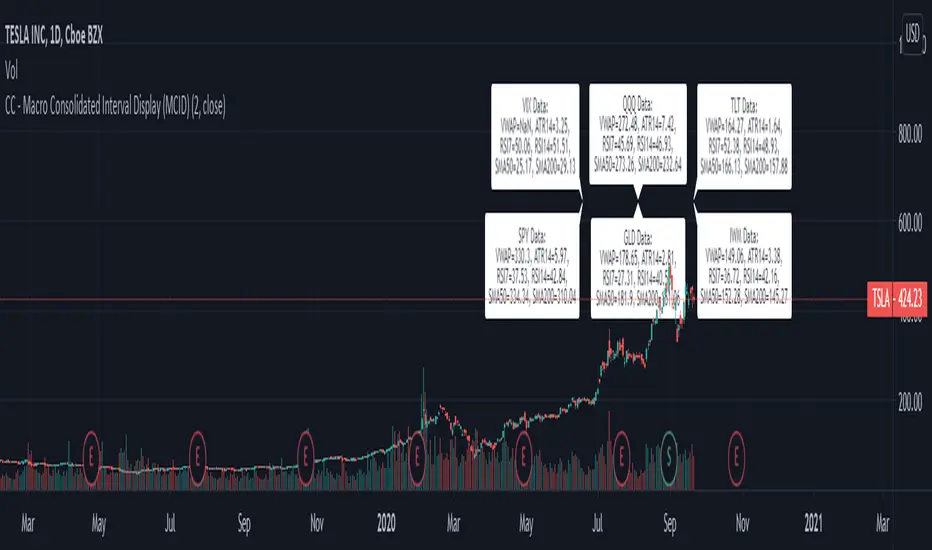
CC - Macro Consolidated Interval Display (MCID)Ever wish you didn't have to rapidly flip between 6 different tickers to get the full picture?
Yeah, me too. Do you also wish that you kind of understood how the shift / unshift function works for arrays?
Yeah, I did too. Both of those birds are taken care of with one stone!
The Macro Consolidated Interval Display uses the new Array structure and security to display data for VIX, GLD, TLT, QQQ, SPY and IWM (at a 1D interval) SIMUTANEOUSLY! Regardless of which ticker you're looking at you can get the full picture of macro futures data without flipping around to get it.
This is my first script trying to use arrays. It basically shows the following a 1d interval:
ATR14, RSI7, RSI14, SMA50, SMA200 and VWAP for VIX.
ATR14, RSI7, RSI14, SMA50, SMA200 and VWAP for GLD.
ATR14, RSI7, RSI14, SMA50, SMA200 and VWAP for TLT.
ATR14, RSI7, RSI14, SMA50, SMA200 and VWAP for QQQ.
ATR14, RSI7, RSI14, SMA50, SMA200 and VWAP for SPY.
ATR14, RSI7, RSI14, SMA50, SMA200 and VWAP for IWM
To make it more or less busy, I've allowed you to toggle off any of the levels you wish. I've also chosen to leave this as open source, as it's nothing too experimental, and I hope that it can gain some traction as an Array example that the public can use! If you don't like the different values that are shown, use this source code example as a spring-board to put values that you do care about onto the labels.
If this code has helped you at all please drop me a like or some constructive criticism if you do not think it's worth a like.
Good luck and happy trading friends. This should be compatible with my CID as well:
If this gets traction, I will post something similar for a dynamic combination of tickers and intervals that you can set yourself.
CC - Consolidated Interval Display (CID)Ever wish you didn't have to rapidly flip between 6 different intervals to get the full picture?
Yeah, me too. Do you also wish that you kind of understood how the shift / unshift function works for arrays?
Yeah, I did too. Both of those birds are taken care of with one stone!
The Consolidated Interval Display uses the new Array structure and security to display data for 5m, 15m, 45m, 1h, 4h and 1d intervals SIMUTANEOUSLY! Regardless of which interval you're looking at you can get the full picture of numerical data without flipping around to get it.
This is my first script trying to use arrays. It basically shows the following for the given ticker:
ATR14, RSI7, RSI14, SMA50, SMA200 and VWAP at the 5 minute level.
ATR14, RSI7, RSI14, SMA50, SMA200 and VWAP at the 15 minute level.
ATR14, RSI7, RSI14, SMA50, SMA200 and VWAP at the 45 minute level.
ATR14, RSI7, RSI14, SMA50, SMA200 and VWAP at the 1 hour level.
ATR14, RSI7, RSI14, SMA50, SMA200 and VWAP at the 4 hour level.
ATR14, RSI7, RSI14, SMA50, SMA200 and VWAP at the 1 day level.
To make it more or less busy, I've allowed you to toggle off any of the levels you wish. I've also chosen to leave this as open source, as it's nothing too experimental, and I hope that it can gain some traction as an Array example that the public can use! If you don't like the different values that are shown, use this source code example as a spring-board to put values that you do care about onto the labels.
If this code has helped you at all please drop me a like or some constructive criticism if you do not think it's worth a like.
Good luck and happy trading friends.
If this gets traction, I will post something similar for a combination of SPY, VIX, GOLD, QQQ, IWM and TLT.
