Correlation Trend Indicator - Dr. John EhlersHot off the press, I present this "Correlation Trend Indicator" employing PSv4.0, originally formulated by Dr . John Ehlers for TASC - May 2020 Traders Tips. John Ehlers might describe it's characteristics as being a mean reverting trend identification oscillator range bound to +/-1.0 irregardless of any timeframe or asset. I could have finessed this indicator with all kinds of bells and whistles, but I wanted to keep it simple and handy enough for novice Pine programmers or Tradingview newcomers to use. This algorithm, in a slightly modified form, is actually a small portion of the base code for John Ehlers' highly complex Autocorrelation Periodogram and his Convolution SwamiChart.
Some members may have notice that I published a very similar script last month. That is correct. It's sole intention was completely different, having more diverse versatility and complexity, but with slightly reduced computational performance. While they seem eerily similar, they are genetically different. This function only has only one required "series" parameter and the correlation is calculated using the period, not bar_index. Correlating with bar_index or period yields identical results either way. Bottom line, this indicator is elegantly simplistic, yet highly utilitarian and easy to use.
Features List Includes:
Dark Background - Easily disabled in indicator Settings->Style for "Light" charts or with Pine commenting
AND a few more... You have the source!
The comments section below is solely just for commenting and other remarks, ideas, compliments, etc... regarding only this indicator, not others. When available time provides itself, I will consider your inquiries, thoughts, and concepts presented below in the comments section, should you have any questions or comments regarding this indicator. When my indicators achieve more prevalent use by TV members, I may implement more ideas when they present themselves as worthy additions. As always, "Like" it if you simply just like it with a proper thumbs up, and also return to my scripts list occasionally for additional postings. Have a profitable future everyone!
Ehlers

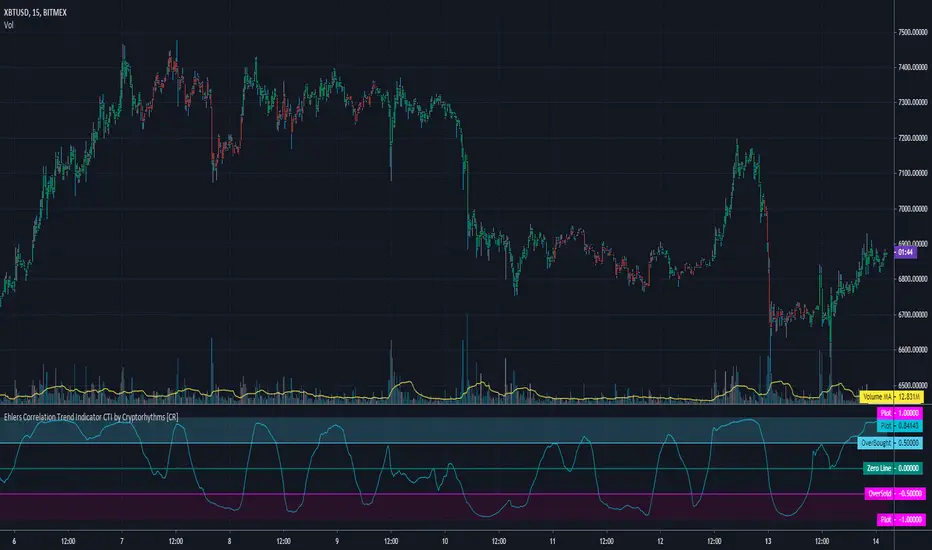
Ehlers Correlation Trend Indicator CTI by Cryptorhythms [CR]Ehlers Correlation Trend Indicator CTI by Cryptorhythms
📜Intro
In his article “Correlation As A Trend Indicator” in issue May 2020 of TASC, author John Ehlers introduces a new trend indicator that is based on the correlation between a security’s price history and the ideal trend: a straight line. He describes methods for using the indicator to not only identify the onset of new trends but to identify trend failures as well. He presents what looks like a simple and elegant idea for a trend-detection and mode-switching indicator.
📋Comments
Careful market selection may be the key to a correct application of the indicator. Even such barebone rules could shine with stocks like AAPL that tend to develop prolonged trends. But for others like CAT, which can keep oscillating in ranges for years, results will be much less impressive. They require a different approach. For example, you would want to buy when Correlation Trend falls significantly below zero and sell when it reaches positive values.
Therefore, it would be an interesting problem to research Correlation Trend’s ability to identify the switch to a cycle mode. That might help develop countertrend systems and
trade pullbacks. Another possible application might be to act as a system filter of change from trending mode to mean-reversion mode.
Extras
As usual when porting indicators to the library here on tradingview, I like to add some extra flare!
💠Customizable Overbought and Oversold Zones for Alert Creation
💠Bar coloration based on trade state for easy visual at a glance chart checking
💠Some basic example Entry and Exit conditions and a simple Trade State Engine to get you going creating your own strategy
Enjoy!
👍 We hope you enjoyed this indicator and find it useful! We post free crypto analysis, strategies and indicators regularly. This is our 81st script on Tradingview!
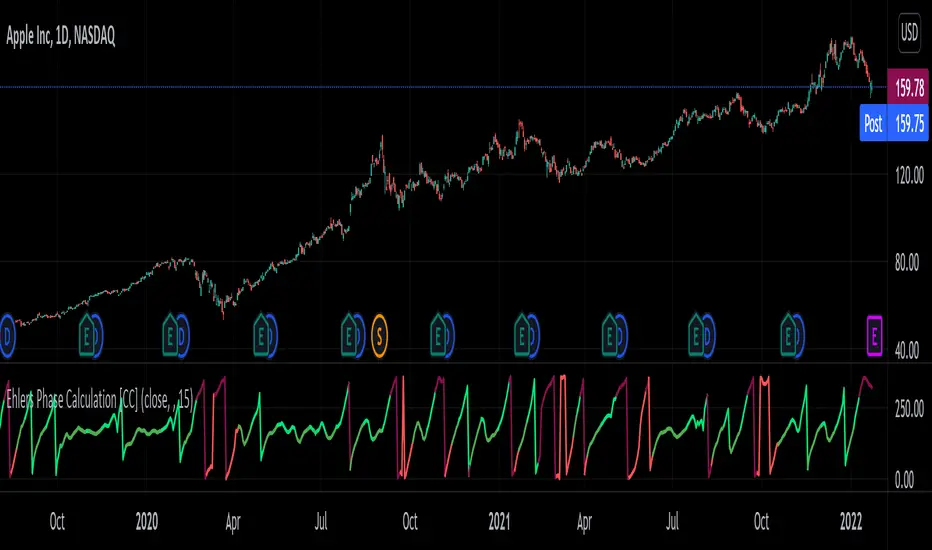
Phase CalculationPhase Calculation was authored by John F. Elders in the Stocks and Commodities Magazine 11/1996
This indicator will tell you if the stock is in a uptrend or downtrend. A phase number with a low number means it is in a uptrend and a phase number with a high number means it is in a downtrend.
Let me know if you want to see me write code for different indicators!
Laguerre RSILaguerre RSI is based on John EHLERS' Laguerre Filter to avoid the noise of RSI.
Change alpha coefficient to increase/decrease lag and smoothness.
Buy when Laguerre RSI crosses upwards above 20.
Sell when Laguerre RSI crosses down below 80.
While indicator runs flat above 80 level, it means that an uptrend is strong.
While indicator runs flat below 20 level, it means that a downtrend is strong.
Developer: John EHLERS
Author: KivancOzbilgic

Ehler's Ideal RSI with EMAThis is a modification of the 'Ehlers Ideal RSI' script to include an EMA of the RSI, which acts as a follower!
The idea was a user suggestion and if you would like your suggestion made into an indicator, check the FAQ!
If you've never encountered the iRSI before, then you're in for a treat. This RSI will calculate the best period to use by itself.
The theory behind this math is called "Instantaneous Frequency Measurement" and is a big component of making terrible indicators (see RSI, Stoch, ADX) into usable ones!
No longer will you have to swap between different periods for different Stocks, Pairs, or Cryptos.
Compare it to the normal RSI and you'll see the underlying calculation is the same, but the period changes automatically.
The EMA provides an earlier indicator of breakouts.
You don't need to wait for this RSI to become "overbought" or "oversold" by crossing the typical 80/20 levels.
Simply observing when the RSI crosses the EMA line can act as confirmation for your other indicators much faster than typical momentum-based indicators.
FAQ
Why is your script Protected?
Users like to take my open-source code and charge to use it without my permission.
How do I use this to trade?
Add it to your chart and see what stacks up with your current setup. I trade Forex, so what looks bad on my charts might look golden on yours.
How long have you been doing this?
I've been coding for about 8 years and actively trading for 2 years. My degree is in Robotics Engineering and I became obsessed with investing at 22.
How do you trade?
Hurst + SNR + MESA MAMA + ATR + LSTM + Pure Grid. You can't completely code this setup using Pinescript, but if you learn C++ or Python you're there!
Are your returns good?
I average 0.68% every weekday or 22.65% monthly, using the method above.
Can you build my indicator or strategy?
Absolutely! If it hasn't been done before and it improves our community, then consider it done.
But can you build an indicator or strategy for me ?
Citing the house rules, I cannot solicit for any purpose. So saying "PM me" would be a grievous violation of said rules, obviously.
Ehler's Reflex Indicator ( + MTF & Adaptive )Implementation of Ehler's Reflex Indicator from TASC Feb 2020.
Optional MTF and fixed/adaptive length based on one of Ehler's cycle measurements.
Optional settings for his recommended 2 bar averaging, can apply the averaging to either/and source ie (close + close ) / 2, the output of the smoothing filter portion of the calculation or the final indicator output.
Green/Red : Reflex/Cycle
Aqua/Purple : Trend
Reflex & Trendflex█ OVERVIEW
Reflex and Trendflex are zero-lag oscillators that decompose price into independent cycle and trend components using SuperSmoother filtering. These indicators isolate each component separately, providing clearer identification of cyclical reversals (Reflex) versus trending movements (Trendflex).
Based on Dr. John F. Ehlers' "Reflex: A New Zero-Lag Indicator" article (February 2020, TASC), both oscillators use normalized slope deviation analysis to minimize lag while maintaining signal clarity. The SuperSmoother filter removes high-frequency noise, then deviations from linear regression (Reflex) or current value (Trendflex) are measured and normalized by RMS for consistent amplitude across instruments and timeframes.
█ CONCEPTS
SuperSmoother Filter
Both oscillators begin with a two-pole Butterworth low-pass filter that smooths price data without the excessive lag of simple moving averages. The filter uses exponential decay coefficients and cosine modulation based on the cutoff period, providing aggressive smoothing while preserving signal timing.
Reflex: Cycle Component
Reflex isolates cyclical price behavior by measuring deviation from a linear regression line fitted through the SuperSmoother output. For each bar, the filter calculates a linear slope over the lookback period, then sums how much the smoothed price deviates from this trendline. These deviations represent pure cyclical movement - price oscillations around the dominant trend. The result is normalized by RMS (root mean square) to produce consistent amplitude regardless of volatility or timeframe.
Trendflex: Trend Component
Trendflex extracts trending behavior by measuring cumulative deviation from the current SuperSmoother value. Instead of comparing to a regression line, it simply sums the differences between the current smoothed value and all past values in the period. This captures sustained directional movement rather than oscillations. Like Reflex, normalization by RMS ensures comparable readings across different instruments.
RMS Normalization
Both oscillators normalize their raw deviation measurements using an exponentially weighted RMS calculation: `rms = 0.04 * deviation² + 0.96 * rms `. This adaptive normalization ensures the oscillator amplitude remains stable as volatility changes, making threshold levels meaningful across different market conditions.
█ INTERPRETATION
Reflex (Cycle Component)
Oscillates around zero representing cyclical price behavior isolated from trend:
• Above zero : Price is in upward phase of cycle
• Below zero : Price is in downward phase of cycle
• Zero crossings : Potential cycle reversal points
• Extremes : Indicate stretched cyclical condition, often precede mean reversion
Best used for identifying cyclical turning points in ranging or oscillating markets. More sensitive to reversals than Trendflex.
Trendflex (Trend Component)
Oscillates around zero representing trending behavior isolated from cycles:
• Above zero : Sustained upward trend
• Below zero : Sustained downward trend
• Zero crossings : Trend direction changes
• Magnitude : Strength of trend (larger absolute values = stronger trend)
Best used for confirming trend direction and identifying trend exhaustion. Less noisy than Reflex due to focus on directional movement rather than oscillations.
Combined Analysis
Using both oscillators together provides powerful signal confirmation:
• Both positive: Strong uptrend with positive cycle phase (high probability long setup)
• Both negative: Strong downtrend with negative cycle phase (high probability short setup)
• Divergent signals: Conflicting cycle and trend (choppy conditions, reduce position size)
• Reflex reversal with Trendflex agreement: Cyclical turn within established trend (entry/exit timing)
Dynamic Thresholds
Threshold bands identify statistically significant oscillator readings that warrant attention:
• Breach above +threshold : Strong bullish cycle (Reflex) or trend (Trendflex) behavior - potential overbought condition
• Breach below -threshold : Strong bearish cycle or trend behavior - potential oversold condition
• Return inside thresholds : Signal strength normalizing, potential reversal or consolidation ahead
• Threshold compression : During low volatility, thresholds narrow (especially with StdDev mode), making breaches more frequent
• Threshold expansion : During high volatility, thresholds widen, filtering out minor oscillations
Combine threshold breaches with zero-line position for stronger signals:
• Threshold breach + zero-line cross = high-conviction signal
• Threshold breach without zero-line support = monitor for confirmation
Alert Conditions
Six built-in alerts trigger on bar close (no repainting):
• Above +Threshold : Oscillator crossed above positive threshold (strong bullish behavior)
• Below -Threshold : Oscillator crossed below negative threshold (strong bearish behavior)
• Reflex Above Zero : Reflex crossed above zero (bullish cycle phase)
• Reflex Below Zero : Reflex crossed below zero (bearish cycle phase)
• Trendflex Above Zero : Trendflex crossed above zero (bullish trend shift)
• Trendflex Below Zero : Trendflex crossed below zero (bearish trend shift)
█ SETTINGS & PARAMETER TUNING
Oscillator Settings
• Source : Price series to decompose
• Reflex Period (5-50): SuperSmoother period for cycle component. Lower values increase responsiveness to cyclical turns but add noise. Default 20.
• Trendflex Period (5-50): SuperSmoother period for trend component. Lower values respond faster to trend changes. Default 20.
Display Settings
• Reflex/Trendflex Display : Toggle visibility and customize colors for each oscillator independently
• Zero Line : Reference line showing neutral oscillator position
Dynamic Thresholds
Optional significance bands that identify when oscillator readings indicate strong cyclical or trending behavior:
• Threshold Mode : Choose calculation method based on market characteristics
- MAD (Median Absolute Deviation) : Outlier-resistant, best for markets with occasional spikes (default)
- Standard Deviation : Volatility-sensitive, adapts quickly to regime changes
- Percentile Rank : Fixed probability bands (e.g., 90% = only 10% of values exceed threshold)
• Apply To : Select which oscillator (Reflex or Trendflex) to calculate thresholds for
• Period (2-200): Lookback window for threshold calculation. Default 50.
• Multiplier (k) : Scaling factor for MAD/StdDev modes. Higher values = fewer threshold breaches (default 1.5)
• Percentile (%) : For Percentile mode only. Higher percentile = more selective threshold (default 90%)
Parameter Interactions
• Shorter periods make both oscillators more sensitive but noisier
• Reflex typically more volatile than Trendflex at same period settings
• For ranging markets: shorter Reflex period (10-15) captures swings better
• For trending markets: shorter Trendflex period (10-15) follows trend shifts faster
█ LIMITATIONS
Inherent Characteristics
• Near-zero lag, not zero-lag : Despite the name, some lag remains from SuperSmoother filtering
• Normalization artifacts : RMS normalization can produce unusual readings during volatility regime changes
• Period dependency : Oscillator characteristics change significantly with different period settings - no "correct" universal parameter
Market Conditions to Avoid
• Very low volatility : Normalization amplifies noise in quiet markets, producing false signals
• Sudden gaps : SuperSmoother assumes continuous data; large gaps disrupt filter continuity requiring bars to stabilize
• Micro timeframes : Sub-minute charts contain microstructure noise that overwhelms signal quality
Parameter Selection Pitfalls
• Matching periods to dominant cycle : If period doesn't align with actual market cycle period, signals degrade
• Threshold over-tuning : Optimizing threshold parameters for past data often fails forward - use conservative defaults
• Ignoring component differences : Reflex and Trendflex measure different aspects - don't expect identical behavior
█ NOTES
Credits
These indicators are based on Dr. John F. Ehlers' "Reflex: A New Zero-Lag Indicator" published in the February 2020 issue of Technical Analysis of Stocks & Commodities (TASC) magazine. The article introduces a novel approach to isolating cycle and trend components using SuperSmoother filtering combined with normalized deviation analysis.
For those interested in the underlying mathematics and DSP concepts:
• Ehlers, J.F. (February 2020). "Reflex: A New Zero-Lag Indicator" - Technical Analysis of Stocks & Commodities magazine
• Ehlers, J.F. (2001). Rocket Science for Traders: Digital Signal Processing Applications . John Wiley & Sons
• Various TASC articles by John Ehlers on SuperSmoother filters and oscillator design
by ♚@e2e4

Voss Strategy (Filter + Trend Indicator) [Bitduke]Created strategy based on Voss Predictive Filter, implemented by TradingView user e2e4mfck.
Voss Predictive Filter
This is a relatively new filter from John F. Ehlers’ article, “A Peek Into The Future .” Ehlers describes the calculation of a new filter that could help signal cyclical turning points in markets.
But filter has a negative group delay and while an indicator based on it cannot actually see into the future, it may provide the trader with signals in advance of other indicators.
In mentioned article he tested filter on SPY and at one point in time "it went into a trend mode in January 2019, and the cycle signal failed miserably, signaling a short position during the runup. <...> The only way to minimize the impact of this condition is to employ an additional trend detector."
Thus I've added another Ehlers' based trend based indicator Instantaneous Trendline (thanks to LazyBear for implementation) to minimize the impact of the trend mode and got a good results on XBTUSD pair 4h.
Backtest :
> Range: 2016 - 2020
> XBTUSD
> 4h
> ~20% drawdown
> Sharpe (0.361, not too impressive)
I think it can be improved with Risk Management system and experimenting with various trend following indicators.

Market ModeThe Market Mode indicator seeks to identify trends and rebounds by identifying “phases” according to the principles of John Ehlers.
- When the oscillator passes above the top line, the market is in an uptrend.
- When the oscillator goes below the bottom line, the market is in a downtrend.
- Between these two levels, the market is calmer and could rebound in the direction of the initial trend and / or phase of trend change.


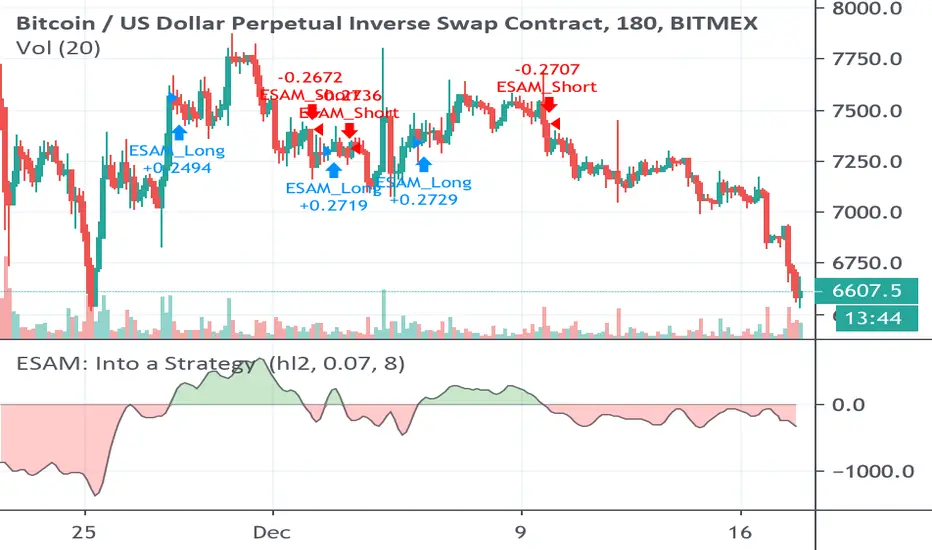
Strategy based on Ehlers Smoothed Adaptive Momentum [LazyBear]Strategy based on Ehlers Smoothed Adaptive Momentum (ESAM) indicator by LazyBear, slightly improved.
Indicator itself was developed and described by John F. Ehlers in his book "Cybernetic Analysis for Stocks and Futures" (2004, Chapter 12: Adapting to the Trend).
Backtesting: XBTUSD (Bitmex): 2h, 3h, 4h
Zentrading Trend Indicator v3.1This is a script for beta testing only.
Based on ichimoku, but with slightly different behaviour, with many added features such as : trend detection, momentum detection, multiple time frame support/resistance levels, exhaustion/reversal signals.
Used in conjunction with the other ZT indicators (ZT momentum, ZT CyclePhase, and ZT Volumebars) the strategy provides very distinct setups to trade for reversals, breakouts and pullbacks.

ZenTrading CyclePhaseThis is a script for beta testing only.
Used to mainly to spot (short-term) divergences
Roofing Filter [DW]This is an experimental study built on the concept of using roofing filters on price data proposed by John Ehlers.
Roofing filters are a type of bandpass filter conventionally used in HF radio receivers in the first IF stage to limit the frequency spectrum passed on to later stages in the receiver.
The goal in applying roofing filters to a price signal is to simultaneously attenuate high frequency noise and low frequency distortion to pass an oscillating signal with a nearly zero mean for analysis and/or further calculation.
In this study, there are three filter types to choose from:
-> Ehlers Roofing Filter, which passes data through a 2 pole high pass filter, then through a Super Smoother filter.
-> Gaussian Roofing Filter, which passes data through a 2 pole Gaussian high pass filter, then through a 2 pole Gaussian low pass filter.
-> Butterworth Roofing Filter, which passes data through a 2 pole Butterworth high pass filter, then through a 2 pole Butterworth low pass filter.
Each filter type has different amplitude and delay characteristics, so play around with each type and see which response suits your needs best.
There is an option to normalize the scale of the output as well. The normalization process in this script is computed by comparing positive and negative outputs to the filter's moving RMS value.
The resulting oscillator can be fed through numerous conventional indicators including Stochastic Oscillator, RSI, CCI, etc. to generate smoother, less distorted indicators for a clearer view of turning points.
Alternatively, it can also act as an indicator itself, as implied by the corresponding color scheme included in the script.
Although roofing filters are not conventionally used in the analysis of market data, applying such spectral analysis techniques may prove to be quite useful for the design of more efficient indicators and more reliable predictions.

Low Pass Channel [DW]This is an experimental study designed to attenuate higher frequency oscillations in price and volatility with minimal lag.
In this study, a single pole low pass filter is used. The low pass filter's cutoff period is determined either by a fixed user input, or by using an Instantaneous Frequency Measurement (IFM) algorithm.
Most radar warning, electronic countermeasures, and electronic intelligence systems employ IFM to identify threats, map the electronic battlefield, and implement deceptive countermeasures.
The IFM technique used for this study was devised by John Ehlers. It calculates In Phase and Quadrature (IQ) components using the Hilbert Transform and uses them to determine the dominant price cycle.
To generate the channel, the same filter approach is applied to true range then added to and subtracted from the price filter.
Custom bar colors are included for simple wave and trend indication.

Ehlers Super Passband FilterAs someone hidden my old script that is just what one guy copied from a book from John Ehlers. I rewrite what i read in the book.
I also found this. So i rewrite this to the guys that was using it. If it hiddes again i will just keep it to myself and downgrade my plan in this TV
// Ehlers Super Passband Filter script may be freely distributed under the MIT license.
// Ehlers Super Passband Filter script may be freely distributed under the MIT license.
// Ehlers Super Passband Filter script may be freely distributed under the MIT license.
// Ehlers Super Passband Filter script may be freely distributed under the MIT license.
// Ehlers Super Passband Filter script may be freely distributed under the MIT license.
I wrote 5 times to be clear. If you guys dont understand portuguese go to the translator to understand what i am explaining in // inside the code.
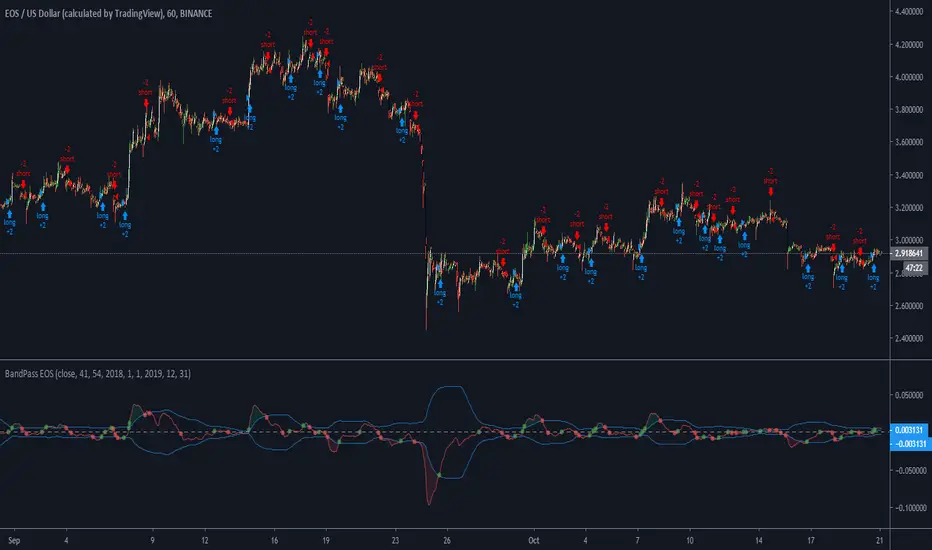
BandPass EOS - 1hThis is a strategy i made for EOS
Opens a long position if the PB line (the red line in the oscillator) crossover the low of the band, the zero line or the top of the band.
If the PB line makes a crossunder in the top of the band, the zero line or the bottom of the band it closes the long position and immediately opens a short position.
Also, the PB value must be higher than 5 candles before if it is a long position and PB must be lower than 5 candles before to open a short position
I got the BandPass Script from www.tradingview.com and made some changes in the configs to adapt the strategy.
If someone has any doubt i can answer below
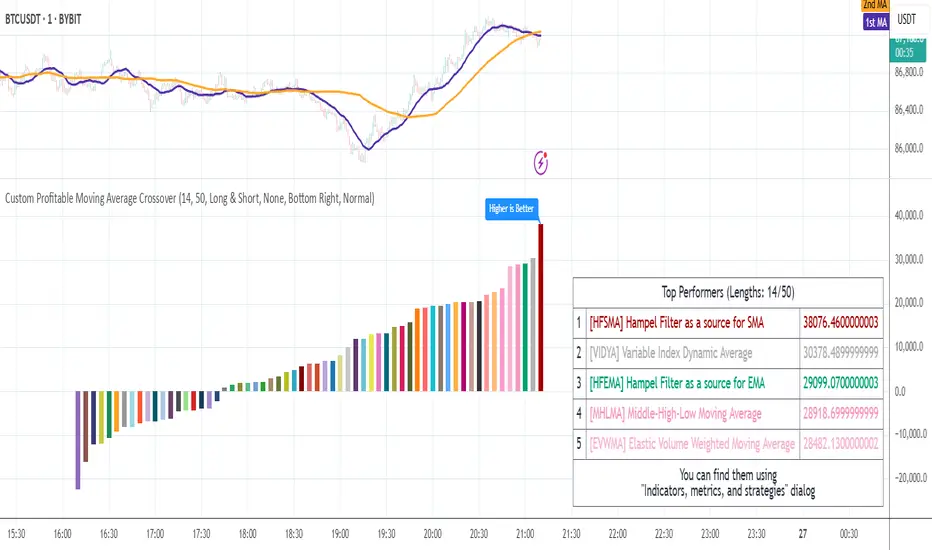
Compact Profitable Moving Average CrossoverHello friends,
I'm pleased to introduce this advanced evolution of the original Profitable Moving Average Crossover tool. This version offers complete control over the analysis range and delivers detailed real-time profitability metrics for every moving average crossover type directly on your chart.
🛠 How It Works
The script evaluates 61 moving average crossover systems across a customizable date range , allowing you to focus on specific historical windows for optimization or validation. It calculates each crossover's net profit performance and automatically ranks all results, displaying the top 5 performers in a summary table. Results are visualized through a color-coded column chart, making it easy to identify which crossover types have historically delivered the strongest outcomes.
🔥 Key Features
Pine Script V6 — built on the latest and most efficient version
Tests 61 moving average types , including those developed by Jurik, Kaufman, Ehlers, Apirine, and others
Custom Backtest Window — analyze any date range with start and end parameters
Automatic Results Table — displays the top 5 crossovers ranked by profit
Color-Coded Chart — quick visual identification of performance by crossover type
Sorted column chart for clear visual comparison of profit metrics
Fully compatible with all symbols, timeframes, and market types
NOTE: Results will vary across different tickers and timeframes. Seeing strong performance in one preview does not imply similar profitability elsewhere — this variability is normal due to differing market structures.
NOTE 2: You can experiment with the tool independently or request a full study, in which case I'll share a spreadsheet of all backtest results with you.
👋 Good luck and happy trading!
Bezahltes Script
MTF IQ IFM Moving AverageMTF ready adaptive MA using Ehler's IQ IFM ( In Phase - Quadrature Instantaneous Frequency Measurement ).
Ehler's formula is a method of quantitatively measuring the length of a market cycle. In this case it is used to calculate the "optimal" adaptive EMA.
Theoretically the length generated by Ehler's formula could be used in many indicators and it's been placed within it's own function so you should be able to simply copy/paste it. HOWEVER pine will not accept series variables for the length input used in built-in functions. You will have to manually code (or find) a version of your indicator that doesn't use the pine built in.
Options :
type : optionally add volume weighting
range : historical range used in IQ IFM
cycle length mult : method to create faster/slower MAs. eg 0.5 is half the length of a cycle and a faster EMA ie EMA10 vs EMA20
low sat fix : some cryptocurrencies with low satoshi values cause an issue with the calculation, if you get no/nonsensical lines, enable this. Shouldn't affect other instruments, but can be disabled just in case.
MTF options: run the calculation on an alternative timeframe
--------------------------------------
If you find it useful please consider a tip/donation :
BTC - 3BMEXEDyWJ58eXUEALYPadbn1wwWKmf6sA

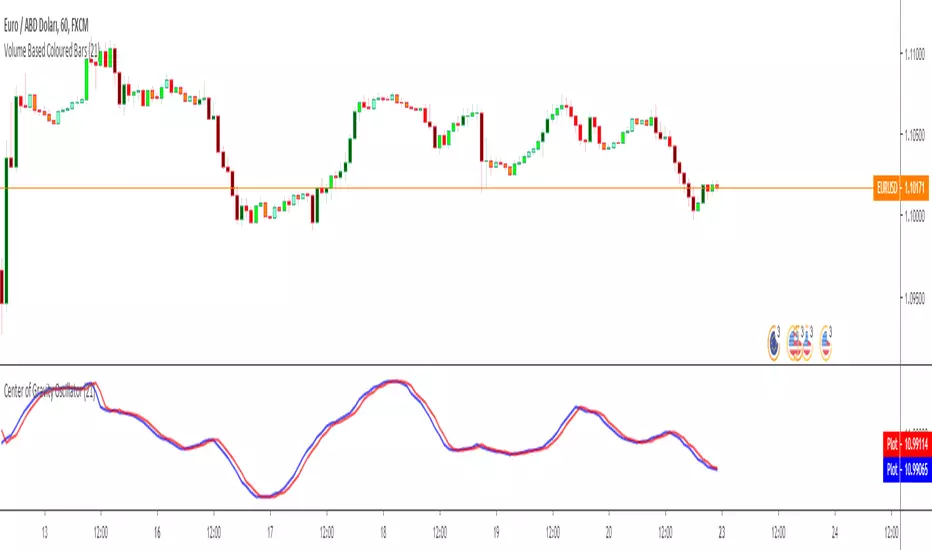
MTF Fisher Hilbert Stoch COGMTF version of dasanc's "Fisher Stochastic Center of Gravity". Only contains the Hilbert variant from the script.
You can find his original script here : link
Center of Gravity Oscillator - Ehlers by KIVANC fr3762Center of Gravity OSCILLATOR by JOHN EHLERS
Converted the original code from his book "Cybernetic Analysis for Stocks and Futures"
This article describes a new oscillator that is unique because it is both smoothed
and has essentially zero lag. The smoothing enables clear identification of turning
points and the zero lag aspect enables action to be taken early in the move. This
oscillator is the serendipitous result of my research into adaptive filters. While the filters
have not yet produced the result I seek, this oscillator has substantial advantages over
conventional oscillators used in technical analysis . The “CG” in the name of the
oscillator stands for the Center of Gravity of the prices over the window of observation.
The Center of Gravity ( CG ) of a physical object is its balance point. For example,
if you balance a 12 inch ruler on your finger, the CG will be at its 6 inch point. If you
change the weight distribution of the ruler by putting a paper clip on one end, then the
balance point (e.g. the CG ) shifts toward the paper clip. Moving from the physical world
to the trading world, we can substitute the prices over our window of observation for the
units of weight along the ruler. With this analogy, we see that the CG of the window
moves to the right when prices increase sharply. Correspondingly, the CG of the
window moves to the left when prices decrease.
For further information:
www.mesasoftware.com
Here's the link to a complete list of all my indicators:
t.co
Şimdiye kadar paylaştığım indikatörlerin tam listesi için: t.co
Ghosty's Modded Super Bandpass Filter [DasanC]Very cool Indicator from Ehlers and published originally by @DasanC
I made minor modifications, and added a zero line and changed some values. I use this indicator differently then it is intended to be used for scalping shorter time frames (15 min - 1 hour).
I use it like a cross over, either from the zeroline or when it passes the RMS, for 5-10 pips. While no indicator is 100% this one does a nice job for small scalps.
try it out on a demo and see if you like it.
enjoy.
original Indy -

Profitable MAMA & FAMA CrossoverIntroduction
The MESA Adaptive Moving Average (MAMA) was originally presented by John F. Ehlers. By design, it is a special kind of Exponential Moving Average with self-adjusting alpha. Its adaptation is based on the rate change of phase as measured by the Homodyne Discriminator and the alpha parameter is allowed to range between a maximum and minimum value (Fast Limit and Slow Limit).
Key Point: Ehlers suggested the maximum value to be 0.5 and the minimum to be 0.05 .
The variable alpha is computed as the Fast Limit divided by the phase rate of change. If the phase rate of change is large, the variable alpha is bounded at the SlowLimit. Then, this alpha is used to compute MAMA and FAMA (Following Adaptive Moving Average).
Should we rely on Ehlers' suggestions if we want to achieve the best result with MAMA & FAMA crossover system?
Well, he is a good specialist and widely recognized author, I respect him, but the answer is no and you can see results on the chart.
What is our goal?
We want to find the best configuration for MAMA & FAMA Crossover. To achieve that we need to analyze the MAMA's alpha parameter or, more specific, the bounds for this parameter, Fast and Slow Limits.
What is this tool?
This tool is a performance optimizer that uses decision tree-based algorithm under the hood to find the most profitable settings for the MAMA & FAMA Crossover. It analyzes a bunch of different Fast Limits (between 0.01 to 0.8 with step of 0.1 ) and Slow Limits (between 0.01 to 0.6 with step of 0.1 ) and backtests each combination across the entire history of an instrument. If the more profitable parameters were found, the indicator will switch its values to the found ones immediately.
So, instead of manually selecting and testing parameters just apply this indicator to your chart and
relax - the algorithm will find the best parameters for you
Alerts
It has a special alert that notifies when the more profitable settings were detected.
NOTE: It does not change what has already been plotted.
NOTE 2: This is not a strategy, but an algorithmic optimizer.
Reference: www.mesasoftware.com
MAMA & FAMA Crossover can be found here:
