Cycle
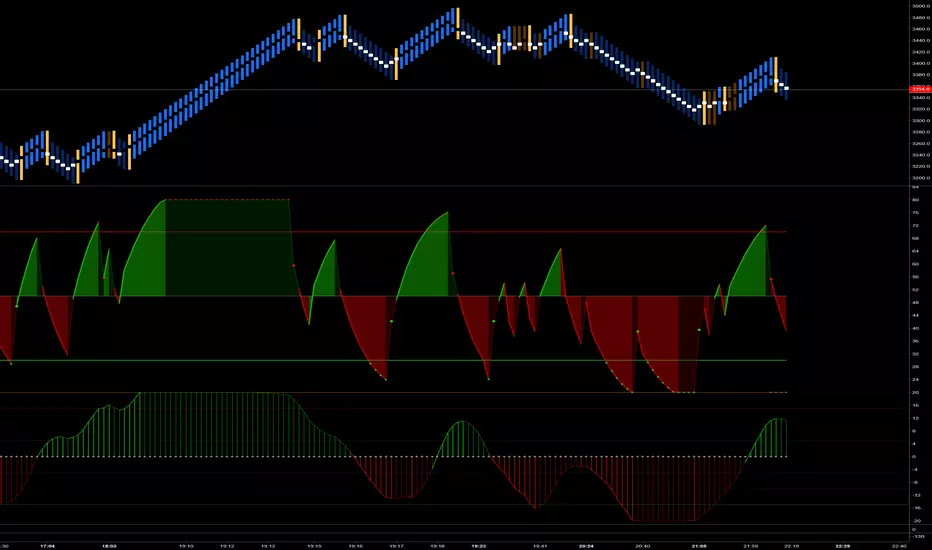
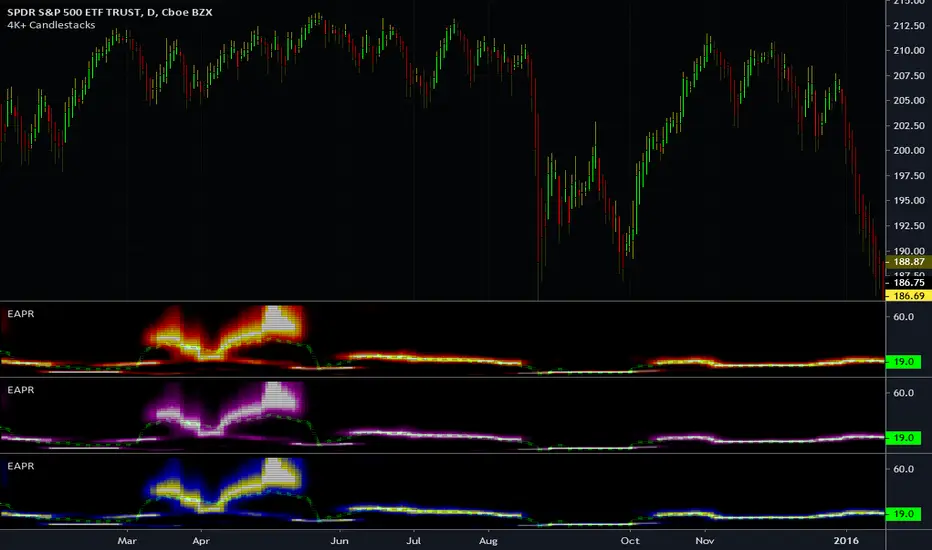
MTF Improved Schaff Trend Cycle IndicatorThis is my cutting edge "Improved Schaff Trend Cycle Indicator" that I radically modified for all assets, not just Forex. Just when you may have thought it was the end of the evolutionary line for Schaff trend cycle indicators, it's not! It's actually two different modified Schaff trend cycle tandem algorithms combined making this a very versatile multicator. Members obtaining Invite-Only access, I might suggest using two of these for increased situational awareness. The creator of "Schaff Trend Cycle", Doug Schaff, a pioneer in Forex analytic trading tools, was really on the right track decades ago when he created the original indicator. At the time of this release, my original free to use formulation shown on the very bottom above is highly popular with members on TV, and in my opinion, one of my most favored indicators I have published so far. Well, this is the NEW and IMPROVED version with reduced lag...
Modifications included are rescaling the range from 0/100 to +/-1.0, employing reversion to the mean principles Dr. John Ehlers elaborates about. The thresholds are set to +/-0.8, nothing significant about those numbers at all, be forewarned! One characteristic about these formulations is that I was able to reduce the lag in many cases. While both are more reactive than the original Schaff trend cycle indicator, often in downward trends, one has the ability to hug the -1.0 line more having an occasional propensity to anticipate false bottoms when significant divergences between the two occur. This is one capability in an indicator I have for so long tried to achieve without any success until now. Also in positive trends, these formulations are more effective when encountering detected peaks/tops without the inherent lag the original formulation had. Both are typically in agreement when an opportune selling exit point is commencing. These characteristics are displayed above on top of the original formulation shown on the bottom.
Another most notable feature I have been including recently is the multiple time frame (MTF) features in the indicator "Settings". The indicator accommodates selectable second-based time frames. This is my third PSv4.0 script to accommodate seconds in MTF adequately. Be forewarned, second-based time frames are currently for Premium subscribers only, until such time in the future when the prerogative of TV might change. I will continue adding second-based time frames to my other indicators where I feel it is beneficial to the indicator.
I.P.O.C.S.: "Initial Public Offering Clean Start" proprietary technology. I figured it's time to more accurately describe this tech starting with this novel indicator. Many of my other indicators already possess this capability. It allows suitable plotting from day one, minute one of IPO, remedying visually delayed signal analysis. It's basically accurate plotting from the very first bar (bar_index==0) on Tradingview. If you don't know what this is, most people don't, go back to the VERY beginning of any stock on the "All" chart and compare it to other similar indicators. What's so special about this? It is extremely difficult to get a healthy plot from bar_index==0 on any platform. However, I have become exceedingly talented performing this feat in most cases but not all depending on the algorithm. This indicator is a successful accomplishment implementing IPOCS. It's inherent value is predominantly for IPO traders who in the past have had to wait 20, 50, and 150 bars before they obtain a precise indicator measurement for the simplest of algorithms in order to make a properly informed decision to potentially invest in an asset. How is this achieved? It's a highly protected secret of mine... but I will say I rarely use Pine built-in functions at all. When I do, I use them scarcely due to currently existing Pine language limitations.
Anyhow, this supersedes my "Enhanced Schaff Trend Cycle Indicator" by far. For those of you who obtain this indicator, enjoy the POWER of Schaff renewed!
Features List Includes:
I.P.O.C.S.(Initial Public Offering Clean Start) Technology
Enable/disable dark background for enhanced visibility
MTF adjustments/selections
Typical Schaff adjustments
"Display Trends" selection to show both trends or each one independently
"Line Width" adjustment for increased line visibility
Ranges and thresholds are enable/disable capable
Upper threshold adjustment
Lower threshold adjustment
Adjustable centered medial zone
This is not a freely available indicator, FYI. To witness my Pine poetry in action, properly negotiated requests for unlimited access, per indicator, may ONLY be obtained by direct contact with me using TV's "Private Chats" or by "Message" hidden in my member name above. The comments section below is solely just for commenting and other remarks, ideas, compliments, etc... regarding only this indicator, not others. If you do have any questions or comments regarding this indicator, I will consider your inquiries, thoughts, and concepts presented below in the comments section, when time provides it. When my indicators achieve more prevalent use by TV members, I will implement more ideas when they present themselves as worthy additions. As always, "Like" it if you simply just like it with a proper thumbs up, and also return to my scripts list occasionally for additional postings. Have a profitable future everyone!
Enhanced Instantaneous Cycle Period - Dr. John EhlersThis is my first public release of detector code entitled "Enhanced Instantaneous Cycle Period" for PSv4.0 I built many months ago. Be forewarned, this is not an indicator, this is a detector to be used by ADVANCED developers to build futuristic indicators in Pine. The origins of this script come from a document by Dr. John Ehlers entitled "SIGNAL ANALYSIS CONCEPTS". You may find this using the NSA's reverse search engine "goggles", as I call it. John Ehlers' MESA used this measurement to establish the data window for analysis for MESA Cycle computations. So... does any developer wish to emulate MESA Cycle now??
I decided to take instantaneous cycle period to another level of novel attainability in this public release of source code with the following methods, if you are curious how I ENHANCED it. Firstly I reduced the delay of accurate measurement from bar_index==0 by quite a few bars closer to IPO. Secondarily, I provided a limit of 6 for a minimum instantaneous cycle period. At bar_index==0, it would provide a period of 0 wrecking many algorithms from the start. I also increased the instantaneous cycle period's maximum value to 80 from 50, providing a window of 6-80 for the instantaneous cycle period value window limits. Thirdly, I replaced the internal EMA with another algorithm. It reduces the lag while extracting a floating point number, for algorithms that will accept that, compared to a sluggish ordinary EMA return. You will see the excessive EMA delay with adding plot(ema(ICP,7)) as it was originally designed. Lastly it's in one simple function for reusability in a nice little package comprising of less than 40 lines of code. I hope I explained that adequately enough and gave you the reader a glimpse of the "Power of Pine" combined with ingenuity.
Be forewarned again, that most of Pine's built-in functions will not accept a floating-point number or dynamic integers for the "length" of it's calculation. You will have to emulate the built-in functions by creating Pine based custom functions, and I assure you, this is very possible in many cases, but not all without array support. You may use int(ICP) to extract an integer from the smoothICP return variable, which may be favorable compared to the choppiness/ringing if ICP alone.
This is commonly what my dense intricate code looks like behind the veil. If you are wondering why there is barely any notation, that's because the notation is in the variable naming and this is intended primarily for ADVANCED developers too. It does contain lines of code that explore techniques in Pine that may be applicable in other Pine projects for those learning or wishing to excel with Pine.
Showcased in the chart below is my free to use "Enhanced Schaff Trend Cycle Indicator", having a common appeal to TV users frequently. If you do have any questions or comments regarding this indicator, I will consider your inquiries, thoughts, and ideas presented below in the comments section, when time provides it. As always, "Like" it if you simply just like it with a proper thumbs up, and also return to my scripts list occasionally for additional postings. Have a profitable future everyone!
NOTICE: Copy pasting bandits who may be having nefarious thoughts, DO NOT attempt this, because this may violate Tradingview's terms, conditions and/or house rules. "WE" are always watching the TV community vigilantly for mischievous behaviors and actions that exploit well intended authors for the purpose of increasing brownie points in reputation scores. Hiding behind a "protected" wall may not protect you from investigation and account penalization by TV staff. Be respectful, and don't just throw an ma() in there branding it as "your" gizmo. Fair enough? Alrighty then... I firmly believe in "innovating" future state-of-the-art indicators, and please contact me if you wish to do so.
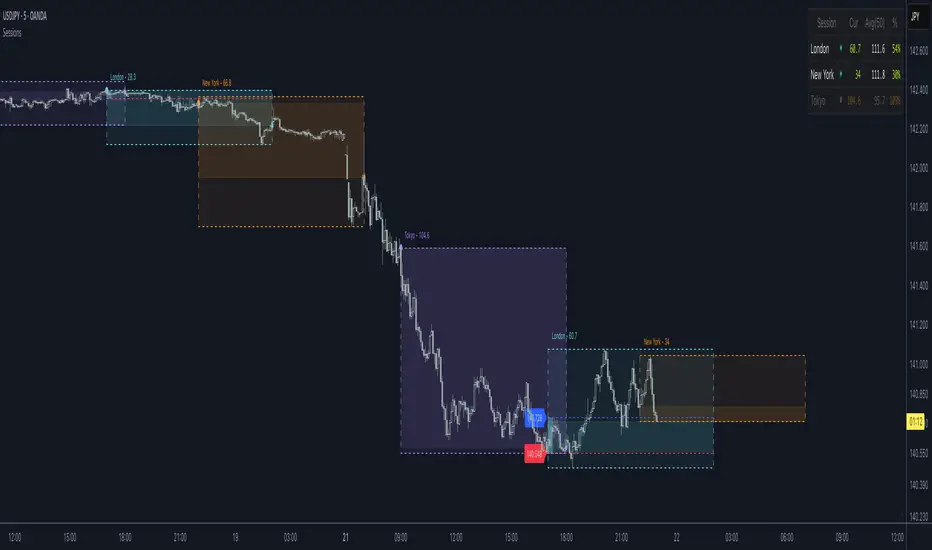
Market Cycle & Scalping entry / exitCycle indicator is an oscillator commonly used to identify market trends and provide buy and sell signals to traders. The Cyle indicator is based on the assumption that currency trends accelerate and decelerate in cyclical patterns that may reflect the dominant price cycle of any stock, during any time frame. It works best on a 1 min chart for quick scalp plays.

Enhanced Autocorrelation Periodogram RasterChart - EhlersFirstly, this is NOT an indicator. It's an advanced cycle period detector for advanced developers OR scripts providing a "Period Source" they may have developed that can utilize this detector. Be forewarned! I would only recommend this for advanced developers, not novice. If you are up to the challenge of manually altering period adjustments on the daily chart of an indicator by hand in real time, you may still obtain this indicator after negotiating a proper request for access, but I will say this, it is NOT suitable for all indicators.
Understand all of the above aforementioned? Proceed...
For those of you wondering how I did it without Pine support for arrays, I had to emulate them, totaling over 600+ lines of code. This was a formidable task to achieve. This may be the hardest task I have ever accomplished, as of yet, in Pine.
Now, on to the Description...
This is my enhanced and heavily* modified version of Dr. John Ehlers' autocorellation periodogram for detecting dominant cycles(frequencies) in an asset using Pine Script version 4.0. The original concept comes from chapter 8 of his book "Cycle Analytics for Traders" and may also be found in TASC magazine in the September 2016 issue. I did heavily modify the original computations for the purpose of providing the "maximum" amount of adjustability there is to possibly offer, but left the original settings intact. I also provided an assortment of vibrant color changing techniques to choose from for anyone who may have vision impairments. This also displays that color scheming is VERY possible in Pine ...if only I could get "chart.theme" for auto-detection.
I once again would personally like to thank the talented individuals at TV for providing a platform that embraces an initial free membership, which I first obtained myself, for individuals like me to freely code in Pine with mathemagical ideas and mental wizardry, creating ultimately, inventions like this eye candy display above.
Features List Includes:
"Source" Selection
Color schemes (displayed above)
Transparency for the heat map to reduce or intensify color brightness ( Thank you TV! For this feature...)
The detected dominant cycle can be 'Sourced' by another specially** modified script providing an integer, float, or a rounded float.
Resolution enhancement has 3 settings
Smoother period control
Highpass period control
Pearson correlation period control
Minimal Power Threshold Tweak(Experimental***)
Adjustment for the smoothing coefficients of the Fourier Transforms(Experimental!)
This is not a freely available indicator, FYI. To witness my Pine poetry in action, properly negotiated requests for unlimited access, per indicator, may ONLY be obtained by direct contact with me using TV's "Private Chats" or by "Message" in my member name above. The comments section below is solely just for commenting and other remarks, ideas, compliments, etc... If you do have any questions or comments regarding this indicator, I will consider your inquiries, thoughts, and ideas presented below in the comments section, when time provides it. As always, "Like" it if you simply just like it, and also return to my scripts list occasionally for additional postings. Have a profitable future everyone!
* This has additional features/tweaks not included in the original.
** Many Pine built-in functions WILL NOT support the use of this detector if 'Sourced' to control a period setting. You have to totally rewrite those built-in Pine functions in Pine script. Yes, it is very possible! BUT ...in many cases, not all.
*** This "modification" reduces large spikes in the detected dominant cycle period with increased adjustment. Increasing this value may reduce dominant cycle spikes around 0.3-ish
Financial Freedom WaveRider - Cycling MulticatorIn the Spirit of '76 commemorating this day on July 4th, this is my second indicator released using Pine Script version 4.0, something I contributed to often in a small role, and will continue to do, in my free time. Without revealing my secret sauce , this indicator resembles what appears to look like multi Hilbert complex traces combined with Fourier transforms, but i assure you it uses neither technique of extrapolation. It's characteristics display tendencies portraying blatant cycles and strengths in an asset. Regarding the use of this script, the bright yellow line has a period of 4 and the longest adjustable period is 65.
My idea initially was, while there is great "one liner indicators" to use, I thought, why not multi-line "multicators" with little to adjust concerning dominant cycle fluctuations in the market. And voila, a random experiment, turned visually compelling similar to ocean waves. This was followed by adding some colorized banding later to add separation to the color, and I realized this looks like a flag rippling in the wind. Living in America, I then was determined to attain a replica of "Old Glory" in an actual multicator. It's embedded artwork, making it an articator too. Which is why I waited to release it appropriately on July 4th, a day of celebration of freedom, an empowering idea that has reached dessimenation world wide to so many other nations and peoples.
I would personally like to thank the talented individuals at TV for providing a platform that embraces an initial free membership, which I first obtained myself, for people like me to freely code in Pine with mathemagical ideas and mental wizardry, creating ultimately, inventions like this eye candy display above.
Features List Includes:
Enable/disable dark background for enhanced visibility
Longest period adjustment providing any adjustable period setting
A small adjustment tweak for the underlying linear regression
Minimalized enable/disable adjustment for the theme
This is not a freely available indicator, FYI. To witness my Pine poetry in action, properly negotiated requests for unlimited access, per indicator, may ONLY be obtained by direct contact with me using TV's "Private Chats" or by "Message" in my member name above. The comments section below is solely just for commenting and other remarks, ideas, compliments, etc... If you do have any questions or comments regarding this indicator, I will consider your inquiries, thoughts, and ideas presented below in the comments section, when time provides it. As always, "Like" it if you like it, and also return to my scripts list occasionally for additional postings. Have a profitable future everyone!

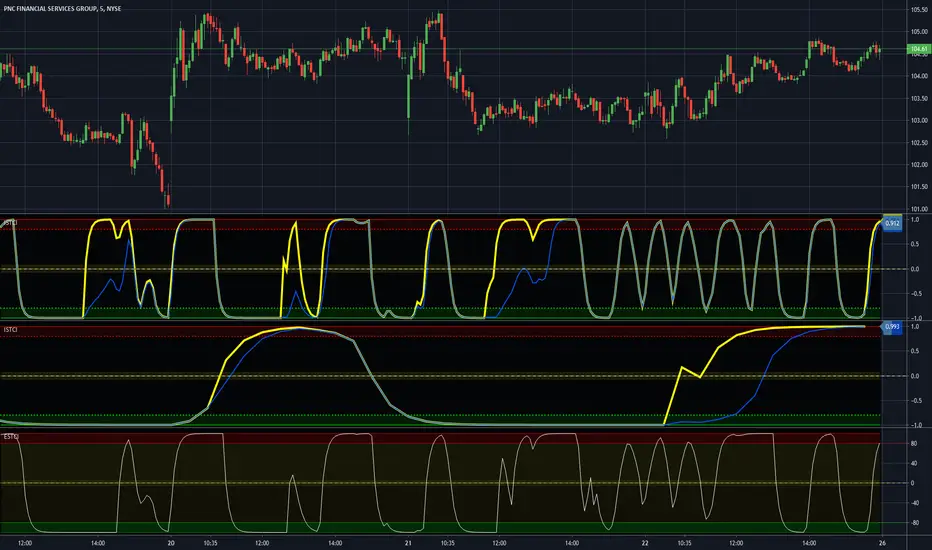
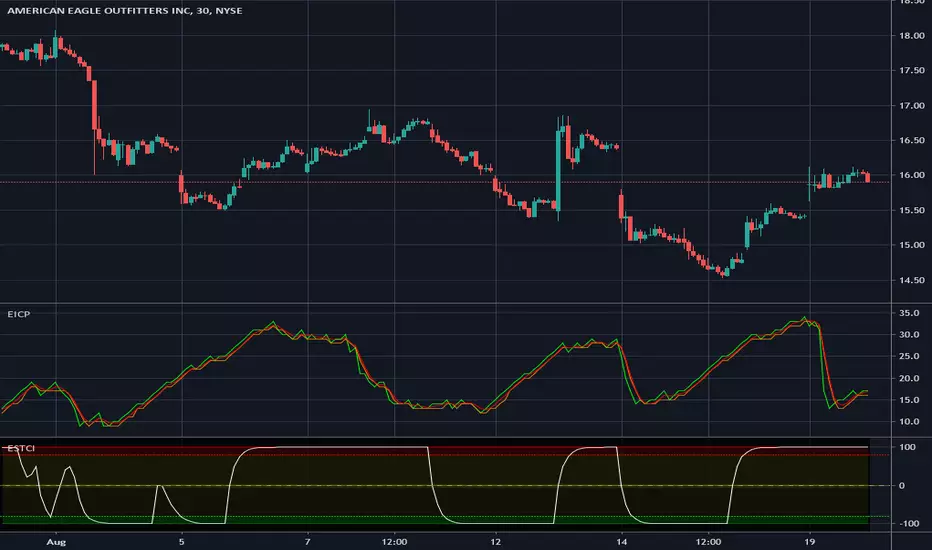
Enhanced Commodity Channel Index(CCI) Cycle Indicator - MTFThis is a heavily modified and enhanced version of CCI Cycle and my first indicator released using Pine Script version 4.0, something I contributed to often in a small role, and will continue to do, in my free time. This indicator is highly reactive and does a magnificent job of identifying fluctuations in market cycles when they are not trending. Compared to my free "Enhanced Schaff Trend Cycle Indicator" presented above along side this indicator, CCI Cycle is superior in it's own way, but a superb companion for providing a more accurate signals analysis. I packed as much tech as I could into this indicator along with astounding color and agility, and I'm unsure if there is any room for major improvements in the near future.
Features List Includes:
I.P.O.C.S.(Initial Public Offering Clean Start) Technology - plotting from day one, minute one of IPO
Fully adjustable M.T.F. ( Multiple Time Frame ) is enable/disable capable
Enable/disable dark background for enhanced visibility
"Source" Selection
Multiple CCI Cycle adjustments
Moving average selection
Ranges and thresholds are enable/disable capable
Upper threshold adjustment
Red/green secondary range that adjusts +/- from the upper/lower thresholds
Lower threshold adjustment
Adjustable centered medial zone
Highlighting is enable/disable capable
Normalized zero mean to +/-1
This is not a freely available indicator, FYI. To witness my Pine poetry in action, properly negotiated requests for unlimited access, per indicator, may ONLY be obtained by direct contact with me using TV's "Private Chats" or by "Message" in my member name above. The comments section below is solely just for commenting and other remarks, ideas, compliments, etc... If you do have any questions or comments regarding this indicator, I will consider your inquiries, thoughts, and ideas presented below in the comments section, when time provides it. As always, "Like" it if you like it, and also return to my scripts list occasionally for additional postings. Have a profitable future everyone!

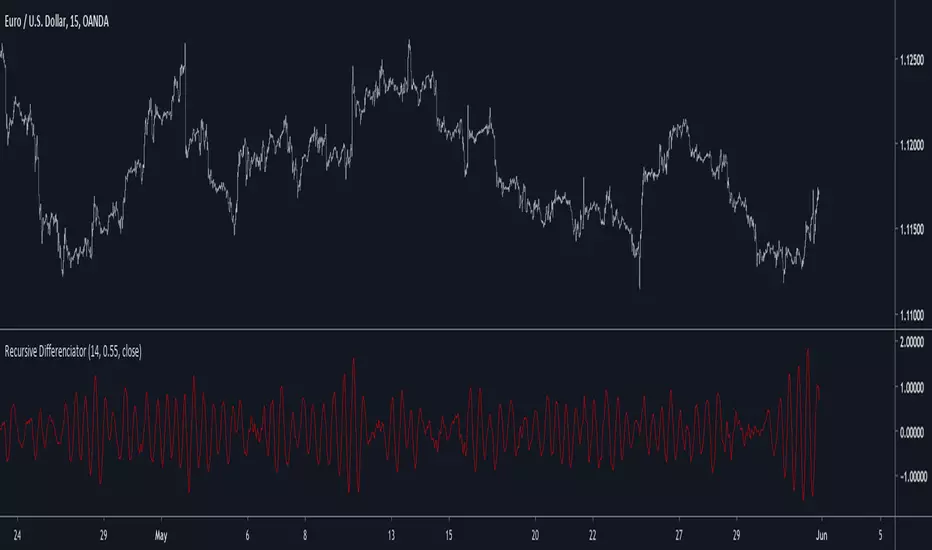
Recursive DifferenciatorIntroduction
Cycles can be spotted by using a wide range of methods, most of them will involve bandpass filtering, here i will show a method using recursion with the change() function.
The Indicator
As i explained in other indicators using recursion i posted rescaling the input is important, i will use the rsi of an exponential moving average as input. alpha control the amount of output the indicator will use as input, values closer to 0.5 will use more input resulting in more periodic results.
Lowering alpha when length is higher can help get more periodic results.
Conclusion
I have showed a new cycle indicator using recursion. Recursion with oscillators can highlights cycles in price thus being easier to predict.
Thanks for reading !
Zero-Lag Smoothed CycleOld indicator ! But its a simple trick to have a zero-lag smoothing effect, i think i did it because the smoothing was kinda asymmetrical with the detrended line. So even if the result appear quite good take into account that the detrended line isn't always correlated with the price.

🔗Blockchain Fundamentals - Bitcoin's Stock to Flow Ratio🔗Blockchain Fundamentals - Bitcoin's Stock to Flow Ratio by Cryptorhythms
Intro
What is a stock to flow ratio and why is it important? The stock-to-flow ratio of a commodity is the amount of the asset that is held in reserves divided by the amount produced every year.
The higher the stock-to-flow ratio the reduced inflation occurs on the asset annually. Commodities with a higher stock-to-flow ratio are preferred for their scarcity.
How does it relate to Bitcoin?
Today, Bitcoin has a considerable lower stock-to-flow ratio than gold and this is where the opportunity presents itself. Bitcoin’s software has a core component cooked into the protocol in the form of an event called “the halvening”
‘The halving’ is an event that happens every 210,000 blocks or roughly every 4 years where the block reward given to the miners for securing the network gets halved. For example in 2009 the block reward was 50 BTC and today in 2019 it currently sits at 12.5 BTC with the ETA for next halving happening on Mon, 25 May 2020 which will take reward down to 6.25 BTC.
The idea that Bitcoin is the first ever truly verifiable, non-confiscatable fixed asset to exist is an extremely powerful concept. Without its strong and non-inflatable monetary policy Bitcoin would have a futile attempt of being able to disrupt gold and even accrue value in the first place.
Over the next several decades we will see Bitcoin’s stock-to-flow ratio increase significantly into never before seen water. No other asset will have anywhere near the scarcity of bitcoin.
With the incredible influx of talent coming into the industry to build out the infrastructure (custodial, ETF’s, futures) needed to allow legacy financial institutions to dip their toes in the soon smooth and regulated crypto asset waters. The next few years will be very interesting.
You might say "where will all this capital come from to propel bitcoin to new all time highs?"
1. Well asteroid mining is coming which could well eliminate golds scarcity. Your garden variety metallic asteroid could contain as much gold as half the gold humanity has ever mined!
2. Countries/economies with negative interest rate monetary policy and /or heavy quantitative easing. Their currency supply and debt just keep increasing...
3. Countries looking for ways around the USD dominated and US controlled financial systems (Iran, Russia, Venezuela, North Korea, etc)
4. There's tons more I just wanted to highlight a few.
Usage
You can compare Bitcoin with various other precious metals and commodities from the settings panel. I suggest a logarithmic scale for this indicator, other wise most assets are clumped at the bottom:
There's also plots for the forecasted (estimated) SFR ratios after the 2020 and 2024 Halvings.
👍 Enjoying this indicator or find it useful? Please give me a like and follow! I post crypto analysis, price action strategies and free indicators regularly.
💬 Questions? Comments? Want to get access to an entire suite of proven trading indicators? Come visit us on telegram and chat, or just soak up some knowledge. We make timely posts about the market, news, and strategy everyday. Our community isn't open only to subscribers - everyone is welcome to join.
For Trialers & Chat: t.me

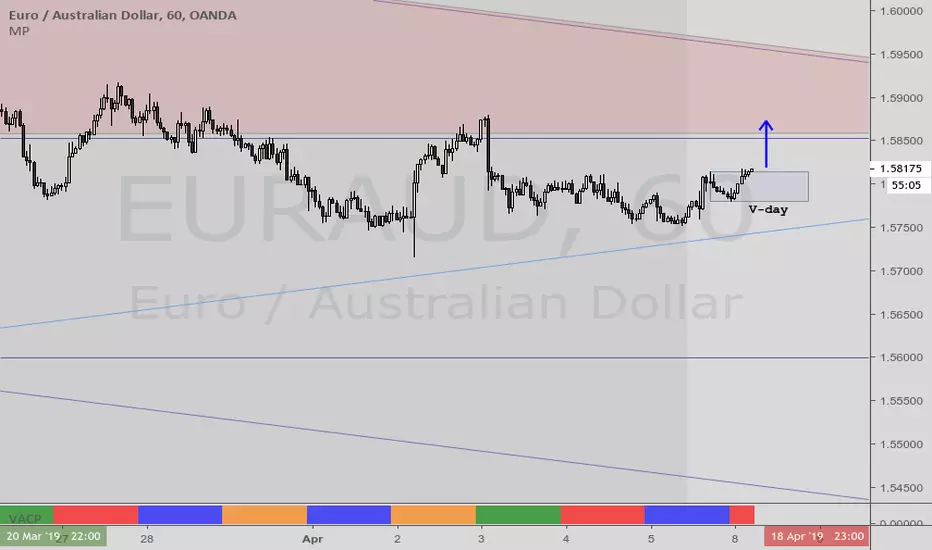
VACPWelles Wilder (delta phenomenon) a 4-day rotation indicator
PVAC is the acronym Alan uses for a four-day rotation cycle. The cycle itself is circularly continuous every days of the week, forever, including every holiday. Thus if, for instance, Monday was a P, Tuesday is V, Wednesday is A, Thursday is C. At this point the cycle repeats, with Friday being P, Saturday being V, Sunday being A, and the following Monday being C.
Having started, the cycle never changes. While each day tends to have the characteristics shown below, like all cycle tools, there are inversions, which will last a cycle or at times even more, and have reasonable odds of inverting regularly.
A trader who wants to incorporate a four-day rotation cycle into their work is encouraged to study for themselves whether this adds value.
Day: V-day Color: Red Characteristics: Closes well for bulls; Use your fleece bars Bar8 and Bar11; Bar8 open often a V-day return target; 'V' return comes early in day in bear moves, late in day in bullish moves
Day: A-day Color: Blue Characteristics: Closes poorly for bulls; Use your fleece bars 8 and 11; Generally 'A' shaped, but may have a kick-leg after 3pm
Day: C-day Color: Orange Characteristics: Consolidation day, aka 'consoly' day. It may not chop, but it may have an
accumulation or distribution quality to the action; Trade often and trade fast; Pattern traders fade 4HHs and 4LLs with backfill/pullbacks 3 bars later; Apexes and angulars tend to have less importance; Numerical traders trade after Bar8 open and use support one horizontal below, resistance one horizontal above; C-day opens often at the 25%; The afternoon action tends to be opposite to the morning action
Day: P-day Color: Green Characteristics: Often a trend day. Find the trend and enter it; Often opens at the 75%; Trade P-days against a quartile; Watch for price to be above/below the first apex: buy above or sell below ; Do not fade dead zone, minimal trading
Multi-Instantaneous Frequency MeasurementI compiled all of Ehlers' IFM methods into one script - all written as functional blocks so you can simply add them to your own scripts.
Bonus! I also dropped in the Super Smoother, which is a much more efficient and low lag averaging method. I used it to clean the data before feeding it into other indicators.

Robust Cycle Measurement [Ehlers]The last of Ehlers Instantaneous Frequency Measurement methods.
This is a more robust version of this script.
I wrote it as a function, so you can simply copy and paste it into any script to add an adaptive period setting capability.
Cheers,
DasanC
Trader Set - Volume CycleThis is the cycle oscillator for the volume candle indicator. It supports all subt ypes but not 4 and 6 because how they are calculated (sub type 4 and 6 does not provide any cycle or any other type of possible calculation based on them by nature of the sub type)

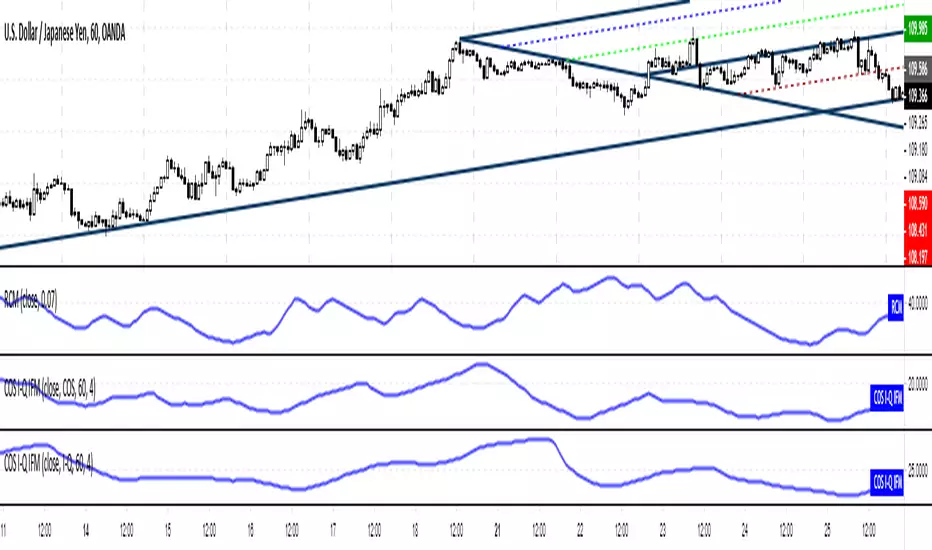
Cosine, In-Phase & Quadrature IFM [Ehlers]Yet another method for determining the cycle of a market: this time, you have access to the two fastest and most accurate methods
as well as the option to average these methods together.
The controls are pretty straight forward:
Source lets you select the price data to perform calculations on (close, open, etc..)
Max Period is simply the cap for the algorithm when it's checking the validity of Periods.
-> If you notice your plots have a flat top, then increase this value to accept a wider range of Periods.
-> This setting has a min. value of 8 to reduce noise and a max of 100 to ignore waves from higher time frames.
Average? simply averages the two methods of calculation.
-> You may want to do this if you notice the two plots diverging a lot.
-> Cosine IFM tends to favor shorter periods; I-Q IFM tends to favor longer.
Cheers,
- DasanC

Adaptive Bandpass Filter [Ehlers]This is my latest bandpass filter - used to determine if a security is in a trend or cycle.
Now with an adaptive period setting! I use Ehlers in-phase & quadrature dominant cycle measurement (IQ IFM) method to set the period dynamically.
This method favors longer periods which tend to produce smoother, albeit laggier bandpass oscillator plots. From my quick tests, I tend to have lag between 4 and 8 bars, depending on the Timeframe.
The lower timeframes tend to have more noise and thus produce more interfering frequencies that may cause lag.
>Settings
Source: Select the data source to perform calc's on (close, open, etc...)
Period: Select the period to tune. Periods outside of this value will be attenuated (reduced)
Adaptive: Enable to have the I-Q IFM set the period for you (disables Period setting)
Bandpass Tolerance: Allow periods that are plus/minus the chosen period to pass.
Cycle Tolerance: Sensitivity of cycle mode. Lower values consider trends more frequent, higher values consider cycles more frequent.
Bandpass tolerance example: for instance, if this setting is 0.1 (10%) and Period is set to 20, then waves with a period of 18 - 22 will pass.
>How to read
Red line is the bandpass output, showing a lagged version of the dominant cycle representing the
Black lines are the upper and lower bounds for a cycle
Green Background indicates an uptrend
Red background indicates a downtrend

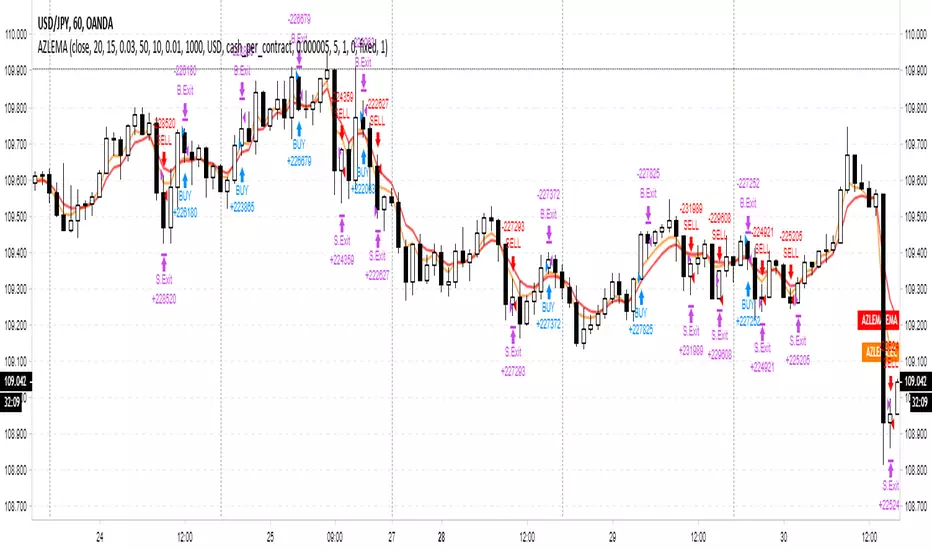
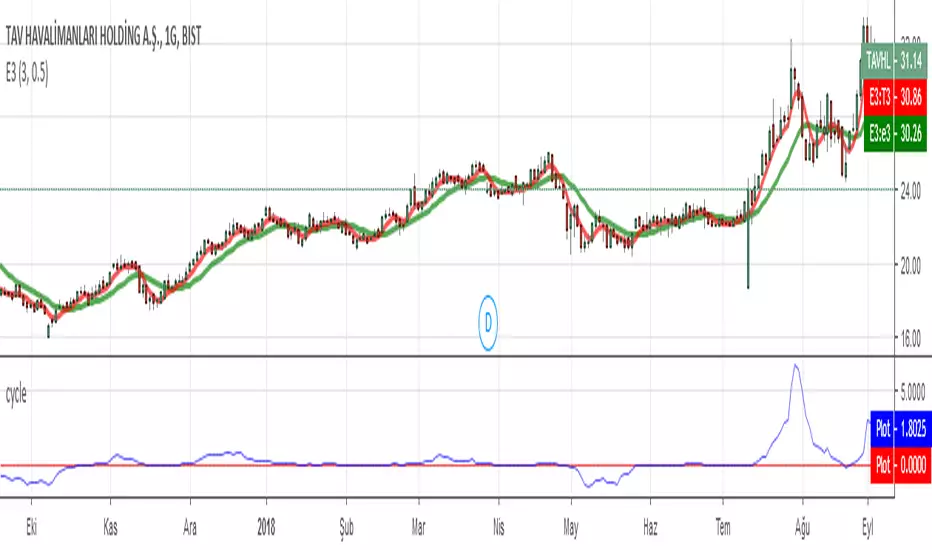
Adaptive Zero Lag EMA Strategy [Ehlers + Ric]Behold! A strategy that makes use of Ehlers research into the field of signal processing and wins so consistently, on multiple time frames AND on multiple currency pairs.
The Adaptive Zero Lag EMA (AZLEMA) is based on an informative report by Ehlers and Ric .
I've modified it by using Cosine IFM, a method by Ehlers on determining the dominant cycle period without using fast-Fourier transforms
Instead, we use some basic differential equations that are simplified to approximate the cycle period over a 100 bar sample size.
The settings for this strategy allow you to scalp or swing trade! High versatility!
Since this strategy is frequency based, you can run it on any timeframe (M1 is untested) and even have the option of using adaptive settings for a best-fit.
>Settings
Source : Choose the value for calculations (close, open, high + low / 2, etc...)
Period : Choose the dominant cycle for the ZLEMA (typically under 100)
Adaptive? : Allow the strategy to continuously update the Period for you (disables Period setting)
Gain Limit : Higher = faster response. Lower = smoother response. See for more information.
Threshold : Provides a bit more control over entering a trade. Lower = less selective. Higher = More selective. (range from 0 to 1)
SL Points : Stop Poss level in points (10 points = 1 pip)
TP Points : Take Profit level in points
Risk : Percent of current balance to risk on each trade (0.01 = 1%)
www.mesasoftware.com
www.jamesgoulding.com(Measuring%20Cycles).doc
In-Phase & Quadrature IFMThis indicator provides a continuous measurement of a securities' dominant cycle period, based on Ehlers ever-impressive reports and analysis tools.
This method uses in-phase and quadrature analysis, making use of the imaginary domain. This method is prone to favor longer periods and can
allow noise to greatly affect the end result.
>What does that even mean?
Essentially, you get a real-time (low lag) plot of the cycle period in bars. If the I-Q IFM reads "16" then you can expect the distance between swing highs and swing lows to be approx. 16 bars.
>How is this useful?
When you throw an RSI or MACD on your chart, you can now set the "Period" or "Length" value with confidence.
Knowing the dominant cycle period tells you that price reversal will occur around these intervals.
>Extending.
The better way to use this tool is by extending the script into any indicators that use a length or period that is set manually.
Simply use the "len" variable in your custom script to replace your input values.
Now you have a way to adaptively set the period value, using signal processing theory instead of just intuition ;)
PM if you have questions.

Cosine IFM [Ehlers]This indicator provides a continuous measurement of a securities' dominant cycle period, based on Ehlers ever-impressive reports and analysis tools.
>What does that even mean?
Essentially, you get a real-time (low lag) plot of the cycle period in bars. If the COS IFM reads "16" then you can expect the distance between swing highs and swing lows to be approx. 16 bars.
>How is this useful?
When you throw an RSI or MACD on your chart, you can now set the "Period" or "Length" value with confidence.
Knowing the dominant cycle period tells you that price reversal will occur around these intervals.
>Extending.
The better way to use this tool is by extending the script into any indicators that use a length or period that is set manually.
Simply use the "len" variable in your custom script to replace your input values.
Now you have a way to adaptively set the period value, using signal processing theory instead of just intuition ;)
PM if you have questions.

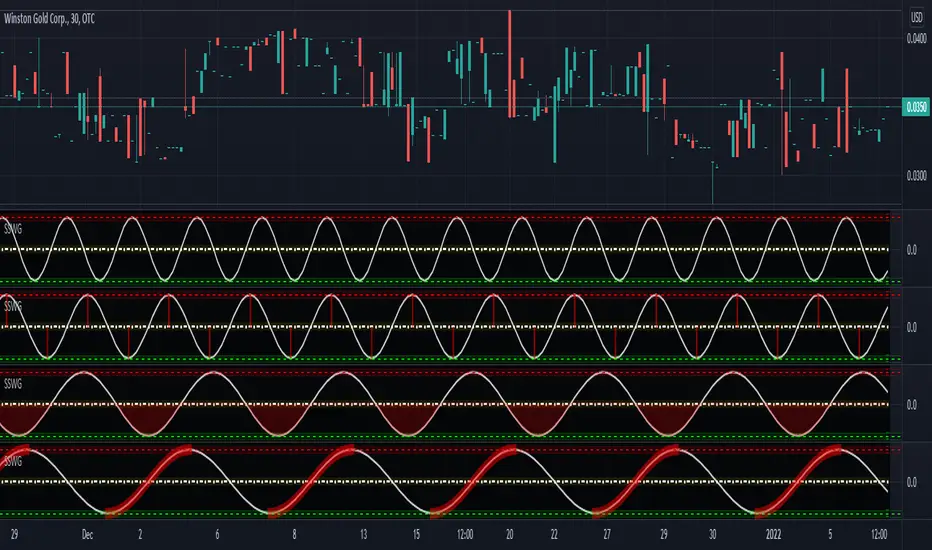
Simple Sine Wave GeneratorThe title pretty much sums up what purpose this tool serves. It is NOT an indicator, just a simple sine wave generator. You may use it to attempt to measure cycle periods occurring in the markets using "Wave Length (Bars)" setting in the "Format" panel. Other features include the sine wave phase is shift-able to the left and the right, and there is also an amplitude adjustment as well.
Recursive StochasticThe Self Referencing Stochastic Oscillator
The stochastic oscillator bring values in range of (0,100). This process is called Feature scaling or Unity-Based Normalization
When a function use recursion you can highlights cycles or create smoother results depending on various factors, this is the goal of a recursive stochastic.
For example : k = s(alpha*st+(1-alpha)*nz(k )) where st is the target source.
Using inputs with different scale level can modify the result of the indicator depending on which instrument it is applied, therefore the input must be normalized, here the price is first passed through a stochastic, then this result is used for the recursion.
In order to control the level of the recursion, weights are distributed using the alpha parameter. This parameter is in a range of (0,1), if alpha = 1, then the indicator act as a normal stochastic oscillator, if alpha = 0, then the indicator return na since the initial value for k = 0. The smaller the alpha parameter, the lower the correlation between the price and the indicator, but the indicator will look more periodic.
Comparison
Recursive Stochastic oscillator with alpha = 0.1 and bellow a classic oscillator (alpha = 1)
The use of recursion can both smooth the result and make it more reactive as well.
Filter As Source
It is possible to stabilize the indicator and make it less affected by outliers using a filter as input.
Lower alpha can be used in order to recover some reactivity, this will also lead to more periodic results (which are not inevitably correlated with price)
Hope you enjoy
For any questions/demands feel free to pm me, i would be happy to help you

Trader Set - Modified RSI MTFThis is a modified version of RSI MTF, a similar indicator can be found in public library if anyone is interested, mine, is fabricated to work with my methology with all the addition i will add to this (just like others when i added the ability to change the moving types in critical places of formula) so that students can experiment with them (it will come in next version). also, I normalize both sections for better visualization.
Please don't ask me for getting access. "CM Modified RSI MFI" search it for the base and almost similar indicator without my additions. This script will be available only for my students at the time being. like other scripts, if the learning material will be ready i will be announce in comment section, and like others, again, if i decide to sell this separated from courses i will announce in the comment section too.