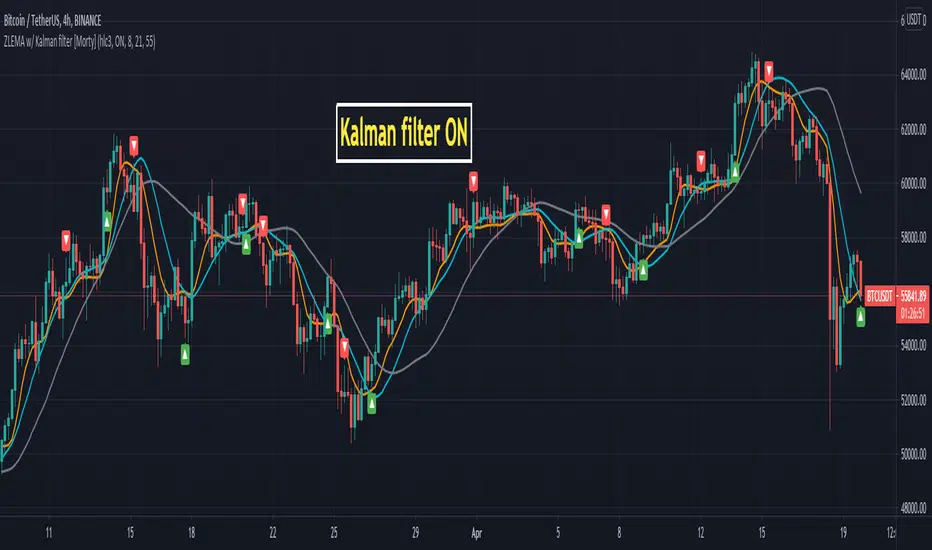
ZLEMA Zero lag EMA with Kalman filter [Morty]This indicator plot 3 Kalman filter zero lag EMA lines. It has less lag and is also smoother than the original EMA.
It also has an option to show the crossover of two EMAs.
Kryptowährung
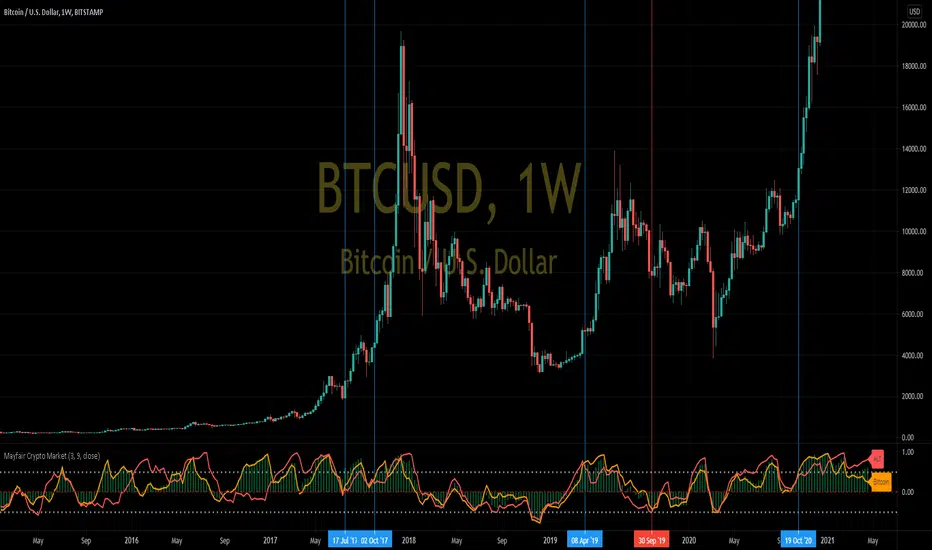
Mayfair Crypto Market 1.0In this indicator, we compare the market capitalisation of Bitcoin(in gold colour) with the market cap of all the other cryptocurrencies (in red), and the market cap of the whole cryptocoin market (the green histogram).
As you may be able to see, when Bitcoin (gold colour) crosses over the Others (red colour) in the indicator, it signifies a swing in popularity towards Bitcoin, and it appears to have predicted some of the recent large rallies (blue Vertical lines) and pull-backs (red vertical lines)
Like all indicators, it is not perfect, and you should never rely on one indicator in any situation.
(IK) Base Break BuyThis strategy first calculates areas of support (bases), and then enters trades if that support is broken. The idea is to profit off of retracement. Dollar-cost-averaging safety orders are key here. This strategy takes into account a .1% commission, and tests are done with an initial capital of 100.00 USD. This only goes long.
The strategy is highly customizable. I've set the default values to suit ETH/USD 15m. If you're trading this on another ticker or timeframe, make sure to play around with the settings. There is an explanation of each input in the script comments. I found this to be profitable across most 'common sense' values for settings, but tweaking led to some pretty promising results. I leaned more towards high risk/high trade volume.
Always remember though: historical performance is no guarantee of future behavior . Keep settings within your personal risk tolerance, even if it promises better profit. Anyone can write a 100% profitable script if they assume price always eventually goes up.
Check the script comments for more details, but, briefly, you can customize:
-How many bases to keep track of at once
-How those bases are calculated
-What defines a 'base break'
-Order amounts
-Safety order count
-Stop loss
Here's the basic algorithm:
-Identify support.
--Have previous candles found bottoms in the same area of the current candle bottom?
--Is this support unique enough from other areas of support?
-Determine if support is broken.
--Has the price crossed under support quickly and with certainty?
-Enter trade with a percentage of initial capital.
-Execute safety orders if price continues to drop.
-Exit trade at profit target or stop loss.
Take profit is dynamic and calculated on order entry. The bigger the 'break', the higher your take profit percentage. This target percentage is based on average position size, so as safety orders are filled, and average position size comes down, the target profit becomes easier to reach.
Stop loss can be calculated one of two ways, either a static level based on initial entry, or a dynamic level based on average position size. If you use the latter (default), be aware, your real losses will be greater than your stated stop loss percentage . For example:
-stop loss = 15%, capital = 100.00, safety order threshold = 10%
-you buy $50 worth of shares at $1 - price average is $1
-you safety $25 worth of shares at $0.9 - price average is $0.966
-you safety $25 worth of shares at $0.8. - price average is $0.925
-you get stopped out at 0.925 * (1-.15) = $0.78625, and you're left with $78.62.
This is a realized loss of ~21.4% with a stop loss set to 15%. The larger your safety order threshold, the larger your real loss in comparison to your stop loss percentage, and vice versa.
Indicator plots show the calculated bases in white. The closest base below price is yellow. If that base is broken, it turns purple. Once a trade is entered, profit target is shown in silver and stop loss in red.

ParaEyeThis indicator compares the movement of a longer term moving average with the difference of a shorter term moving average minus a longer term moving average. The indicator uses standard deviation enabling it to focus on just change/variance overtime. This aspect will allow ParaEye the ability to survive the test of time and continue to produce reliable insights into the future. One essential takeaway you must be aware of though is the ParaEye is only able to provide insight into parabolic movements in price that occur on a log price chart. However, there is a hidden golden aspect to this indicator though that is universal and able to provide insights not only into parabolic movements but others still across many asset classes. I will be sharing that sometime in the future.

Crypto Fox Alert of Ann Strategy No RepaintHello traders
This is (( sirolf's ANN Indicator)) i updated it to (( No Repaint Version )) and it still have very good results
The new in strategy : -
1 - The Indicatoris no repaint now in any time frame
2- Now Indicatorhave two time frames which make you control strategy in entry and exit positions and you can change it as you want .
3- I recommended so much working in 5 min time frame and 15 min time frame to get the best results
but in the same time the Indicator is working in all time frames this just my advice for traders
4- I recommend so much using take profit and stop loss to avoid huge movements in markets
Notes.
--This Indicator Never Ever Repaint so it based on no repaint parameters.
--When using this alert you must notice this points :
1 - when you but the alert in the chart you will get this message :
( this indicator may be repaint ) and this for using time frame but this normal and dont worry of that
the indicator will never repaint .
2 - ( BUY) this the choice for enter long position .
3 - ( SELL) this the second choice you can use it to enter short position or exit long position .
4 - ( per bar close ) you must always use this option in alert conditions page .

Market analysis panel MAP DejaVuTradesThe market analysis dashboard allows you to view multiple markets simultaneously to make a quick and timely decision.
You can add up to 6 markets per panel between Forex, Cryptos, Stocks, Futures, CFDs, Indices, and comparing their current state in any different timeframe in which you are currently, selecting it from its configuration.
Below is the explanation of each column of the panel.
►Title: Select the name of your panel grouping by type of market.
►Bullish or bearish market: Reference of the selected time frame indicating a green progress bar when the market trend is bullish, and red when the market is bearish, with the strength percentage.
►Variation by temporality: Current relationship with the close of the previous candle, depending on the selected temporality. indicating you in a green progress bar when the variation is positive, and red when the variation is negative, with their respective percentage.
►Nominal volume: it is a multiplication of the current volume with the current price, its immediate relationship is from the marketcap of the selected market with its respective value.
To view the values, simply put the mouse over the progress bar.

Moritsz's Customized RSIBasically just your standard RSI with a twist. Key differences:
1. Overbought and Oversold levels are moved to a higher and lower level following the nature of cryptocurrency.
2. Added a middle trendline at 50. Above is usually an uptrend, below is a downtrend.
3. Better looking than your typical RSI.
4. Nice pretty colors to please your eyes :)
Enjoy.

(IK) Grid ScriptThis is my take on a grid trading strategy. From Investopedia:
"Grid trading is most commonly associated with the foreign exchange market. Overall the technique seeks to capitalize on normal price volatility in an asset by placing buy and sell orders at certain regular intervals above and below a predefined base price."
This strategy is best used on sideways markets, without a definitive up or down major trend. Because it doesn't rely on huge vertical movement, this strategy is great for small timeframes. It only goes long. I've set initial_capital to 100 USD. default_qty_value should be your initial capital divided by your amount of grid lines. I'm also assuming a 0.1% commission per trade.
Here's the basic algorithm:
- Create a grid based on an upper-bound (strong resistance) and a lower-bound (strong support)
- Grid lines are spaced evenly between these two bounds. (I recommend anywhere between 5-10 grid lines, but this script lets you use up to 15. More gridlines = more/smaller trades)
- Identify nearest gridline above and below current price (ignoring the very closest grid line)
- If price crosses under a near gridline, buy and recalculate near gridlines
- If price crosses over a near gridline, sell and recalculate near gridlines
- Trades are entered and exited based on a FIFO system. So if price falls 3 grid lines (buy-1, buy-2, buy-3), and subsequently crosses above one grid line, only the first trade will exit (sell-1). If it falls again, it will enter a new trade (buy-4), and if it crosses above again it will sell the original second trade (sell-2). The amount of trades you can be in at once are based on the amount of grid lines you have.
This strategy has no built-in stop loss! This is not a 'set-it-and-forget-it" script. Make sure that price remains within the bounds of your grid. If prices exits above the grid, you're in the money, but you won't be making any more trades. If price exits below the grid, you're 100% staked in whatever you happen to be trading.
This script is more complicated than my last one, but should be more user friendly. Make sure to correctly set your lower-bound and upper-bound based on strong support and resistance (the default values for these are probably going to be meaningless). If you change your "Grid Quantity" (amount of grid lines) make sure to also change your 'Order Size' property under settings for proper test results (or default_qty_value in the strategy() declaration).

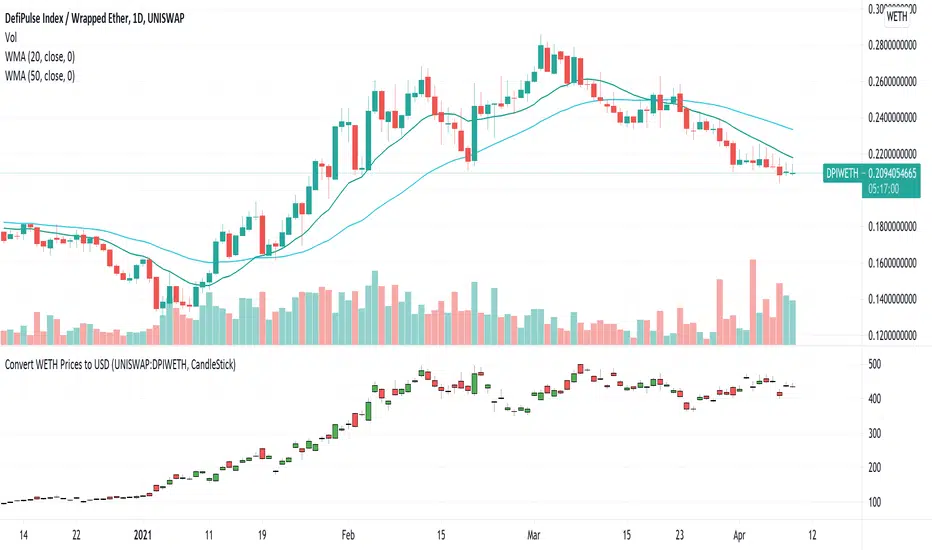
USD Prices for Uniswap Token/WETHUniswap instrument prices are in WETH. This indicator translates the series to USD prices and plots the series as candles or as a line. Data is translated by using corresponding series data for ETHUSD. The reference ETHUSD price is from Coinbase.
Any token listed as a ETH/WETH pair could be specified as an input parameter. The default instrument value is set to UNISWAP: DPIWETH, an index created by indexcoop and tracking the DEFI basket.
The script is simple and easy to understand. It allows for quick conversion and comparisons and something we had to do in a custom way prior to this script. The crypto and DEFI community would benefit from it immensely. There is even a feature request for something like this on the tradingview subreddit.
Trend Surfers - Premium Breakout + AlertsTrend Surfers - Premium Breakout Strategy with Alerts
I am happy today to release the first free Trend Surfers complete Breakout Strategy!
The strategy includes:
Entry for Long and Short
Stoploss
Position Size
Exit Signal
Risk Management Feature
How the strategy works
This is a Trend Following strategy. The strategy will have drawdowns, but they will be way smaller than what you would go through with buy and old.
As a Trend Following strategy, we will buy on strength, when a breakout occurs. And sell on weakness.
The strategy includes a FIX Stoploss determined by an ATR multiple and a trailing Stoploss/Takeprofit also determined by an ATR multiple.
You can also manage your risk by entering the maximum % you are willing to risk on every trade. Additionally, there is an option to enter how many pairs you will be trading with the strategy. This will change your position size in order to make sure that you have enough funds to trade all your favorite pairs.
Use the strategy with alerts
This strategy is alert-ready. All you have to do is:
Go on a pair you would like to trade
Create an alert
Select the strategy as a Trigger
Wait for new orders to be sent to you
Every Entry (Long/Short) will include:
Market Entry (Enter position NOW!)
Stoploss price
Position Size
Leverage
* If you do not wish to use leverage, you can multiply the Position Size by the Leverage. But doing that, you might end up with a position greater than your equity. Trading on Futures is better in order to have accurate risk management.
Exit signals:
When you receive an exit signal, you need to close the position ASAP. If you want to keep your results as close as possible to the backtest results, you need to execute quickly and follow what the strategy is telling you.
Do not try to outsmart the strategy
Leave your emotion out of trading! If you trust the strategy, you will have way better returns than if you try to outsmart it. Follow each signal you receive even if it doesn't seem logical at the moment.
Become a machine that executes. Don't look at fundamentals. Follow the trend! Trust the strategy!
I hope you enjoy it!

ELIA MULTI INDICATORS STRATEGYExperimental multi indicators strategy, to catch right entry and avoid noise.
Each indicator included in the strategy, assume a value based on its status and because is a trend-follow strategy, some indicator value are higher then the other
Backtested on ETHUSDTPERP
BINANCE:ETHUSDTPERP

BitcoinNinjas NINJASIGNALS V4 (Script)BitcoinNinjas NINJASIGNALS V4 (Script)
(for Cryptocurrencies, Forex, GunBot, ProfitTrailer, Autoview, CryptoHopper, manual or automated trading, and more)
This is version 4 of our Ninja Signals trading script, with accompanying backtesting strategy.
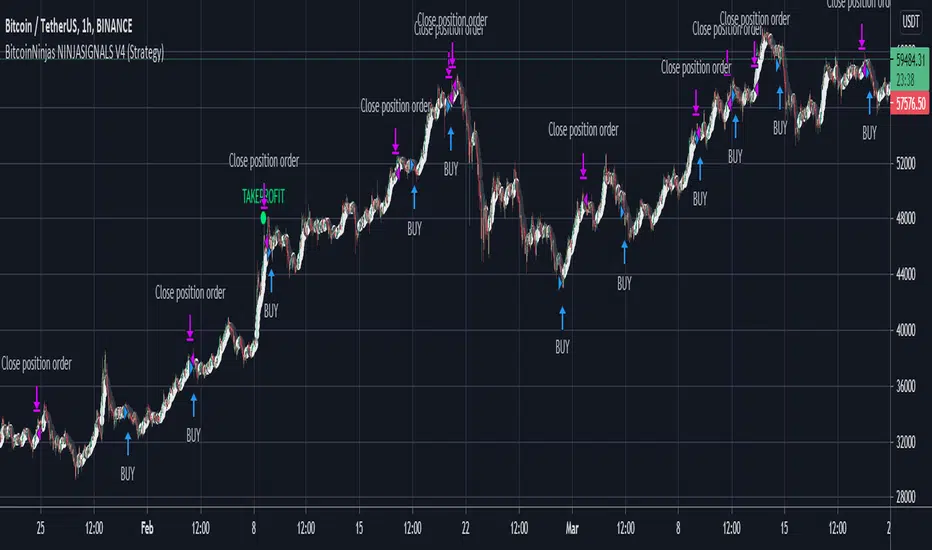
BitcoinNinjas NINJASIGNALS V4 (Strategy)
•Allows users to easily set automated buy/long and sell/short alerts on TradingView for use with automatic and manual trading of cryptocurrencies, Forex securities, and more (alerts are compatible with automatic trading software such as GunBot, ProfitTrailer, Autoview, CryptoHopper, and more).
•Synthesizes many powerful indicators [e.g., Relative Strength Index (RSI), Stochastic RSI, Money Flow Index (MFI), Moving Average Convergence Divergence (MACD), etc.) into one powerful script to generate very precise buy and sell signals in virtually all market conditions.
•Features user-defined adjustable calibration settings, allowing traders to customize the script to fit any currency / security on any exchange available through TradingView.com, simply by adjusting settings.
•Buy/Long arrows, Sell/Short arrows, & EMA trendline can be customized or hidden, if desired.
•Complete with backtesting strategy version of script which allows users to test various trading strategies based on the alerts the script generates (see information and screenshots below).
•Backtesting strategy features a user-defined adjustable date range, so traders can estimate performance of the script over specific periods of time, such as the last week, month, or year.
•Script and backtesting strategy feature many user-adjustable settings including stop loss and take profit alerts, an ‘only sell for profit’ option (Gunbot-specific), many different buy and sell filters, and more. Simply adjust the script settings and the backtesting results will automatically refresh.
•Backtesting strategy allows for pyramid buying to test various average down / dollar cost average trading strategies. Simply adjust the number of pyramid buys and the quantity of each buy.
•Fully compatible with margin and futures trading for any currency / security on TradingView.com.
DISCLAIMER: By using our BitcoinNinjas ‘Ninja Signals’ planning script, you agree to the BitcoinNinjas 'Terms of Use'. No sharing, copying, reselling, modifying, or any other forms of use are authorized for our documents, script / strategy, and the information published with them. This informational planning script / strategy is strictly for individual use and educational purposes only. This is not financial or investment advice. Investments are always made at your own risk and are based on your personal judgement. BitcoinNinjas is not responsible for any losses you may incur. Please invest wisely.

BitcoinNinjas NINJASIGNALS V4 (Strategy)BitcoinNinjas NINJASIGNALS V4 (Strategy)
(for Cryptocurrencies, Forex, GunBot, ProfitTrailer, Autoview, CryptoHopper, manual or automated trading, and more)
This is version 4 of our Ninja Signals trading script, with accompanying backtesting strategy.
BitcoinNinjas NINJASIGNALS V4 (Script)
•Allows users to easily set automated buy/long and sell/short alerts on TradingView for use with automatic and manual trading of cryptocurrencies, Forex securities, and more (alerts are compatible with automatic trading software such as GunBot, ProfitTrailer, Autoview, CryptoHopper, and more).
•Synthesizes many powerful indicators [e.g., Relative Strength Index (RSI), Stochastic RSI, Money Flow Index (MFI), Moving Average Convergence Divergence (MACD), etc.) into one powerful script to generate very precise buy and sell signals in virtually all market conditions.
•Features user-defined adjustable calibration settings, allowing traders to customize the script to fit any currency / security on any exchange available through TradingView.com, simply by adjusting settings.
•Buy/Long arrows, Sell/Short arrows, & EMA trendline can be customized or hidden, if desired.
•Complete with backtesting strategy version of script which allows users to test various trading strategies based on the alerts the script generates (see information and screenshots below).
•Backtesting strategy features a user-defined adjustable date range, so traders can estimate performance of the script over specific periods of time, such as the last week, month, or year.
•Script and backtesting strategy feature many user-adjustable settings including stop loss and take profit alerts, an ‘only sell for profit’ option (Gunbot-specific), many different buy and sell filters, and more. Simply adjust the script settings and the backtesting results will automatically refresh.
•Backtesting strategy allows for pyramid buying to test various average down / dollar cost average trading strategies. Simply adjust the number of pyramid buys and the quantity of each buy.
•Fully compatible with margin and futures trading for any currency / security on TradingView.com.
DISCLAIMER: By using our BitcoinNinjas ‘Ninja Signals’ planning script, you agree to the BitcoinNinjas 'Terms of Use'. No sharing, copying, reselling, modifying, or any other forms of use are authorized for our documents, script / strategy, and the information published with them. This informational planning script / strategy is strictly for individual use and educational purposes only. This is not financial or investment advice. Investments are always made at your own risk and are based on your personal judgement. BitcoinNinjas is not responsible for any losses you may incur. Please invest wisely.
RSI PRECISIONRSI PRECISION
By Giorgos Protonotarios, Financial Analyst
(March 2021)
--------
■ SHORT DESCRIPTION
RSI PRECISION is an oscillator designed to enhance RSI with price volatility and make it much more accurate on longer time frames. The oscillator aims to identify overbought/oversold market levels, and it is ideal for analyzing volatile markets such as the cryptocurrency market.
RSI PRECISION is extensively tested and optimized to work properly with any financial-traded asset. However, there is the option to customize settings, in order to match any out-of-the-ordinary market conditions.
■ RSI PRECISION MISSION
To enhance RSI and make it more accurate on longer time frames, and especially during market tops/bottoms.
■ RSI PRECISION OBJECTIVES
The RSI PRECISION formula combines RSI readings with the periodic measurement of market volatility. The main objectives are:
(1) identify overbought/oversold market levels in a simple and user-friendly manner
(2) make precise calculations near market tops and bottoms, where price volatility is always booming
(3) make precise calculations on longer time frames (monthly, weekly) where RSI readings are hardly readable
(4) allowing traders to experiment by offering a plethora of different settings
■ RSI PRECISION CALCULATIONS
The RSI PRECISION consists of 3 components:
(a) Relative Strength Index readings
(b) Price Volatility measurement (on a periodic base and according to the selected time frame)
(c) RSI Volatility measurement (optional)
■ BASIC SETTINGS
There are plenty of parameters. Negative values are allowed in order to enhance user experimentation:
--RSI PERIODS:
The RSI is most typically used on a 14-period timeframe. However, you can perfectly use RSI PRECISION on a 21-period timeframe. By default, it is 14.
--RSI FACTOR (%)
You can adjust the weight of RSI readings in the formula. By default, it is 100%.
--PERIODIC PRICE VOLATILITY (%)
You can adjust the weight of Periodic Price Volatility in the formula. If you enter the value=0, then the formula becomes the classic RSI. By default, it is 100%.
--ADD PERIODIC RSI VOLATILITY (%)
This is an extra measurement of volatility. This time the focus is exclusively on periodic RSI volatility, not on price volatility. By default, it is 0%.
--CROSSOVER/CROSSUNDER LEVELS
You can create visual signals on any significant RSI PRECISION crossover/crossunder.
--BASE LEVEL
The base level is the level of RSI PRECISION equilibrium. Below the level of equilibrium, RSI PRECISION readings are colored in red. By default, it is 50.
Happy trading!
□ Giorgos Protonotarios
(March 2021)

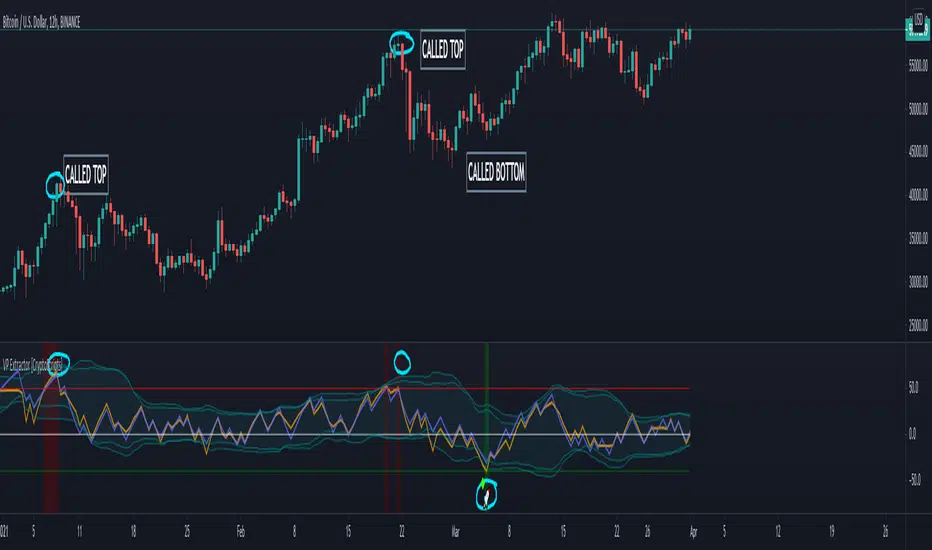
VP Extractor By CryptoScriptsThe VP Extractor is a combination of the Volume Extractor and Price Extractor. There was a lot of coding involved in this one and it involves a Volume/Price Oscillator derived from various volume/price metrics combined with Bollinger Bands and Overbought/Oversold levels. This indicator is unique because it not only measures the standard deviations whenever the oscillator crosses outside the BBs but it does so at ranges that are most advantageous for the trader to identify KEY buy/sell levels (as shown above). I'll break down each signal below and how to best take advantage of them so you can get the best entries and capture the most profit per trade.
*This indicator works best on the Binance or Bybit exchange for crypto but also works for stocks and forex. It's best used on small-medium timeframes such as the 5min, 15m, 1h, 4h, 8hr, or 12h. It tends to give more false signals on the 1D timeframes and higher.
Red Alarm - this signal indicates that the volume and/or price oscillators are overbought and/or crossing outside of the bollinger bands . This is a STRONG sell signal but should still be combined with support/resistance levels and confirmed with other indicators.
Red Diamond - this signal indicates that the volume and price oscillators are crossing outside of the bollinger bands above the 20 level but is not yet overbought. This is a potential sell signal but should still be combined with support/resistance levels and confirmed with other indicators.
Red Shaded Area - this indicates the volume and price oscillators are overbought. This is a potential sell signal but should still be combined with support/resistance levels and confirmed with other indicators.
Rocket - this signal indicates that the volume and/or price oscillators are oversold and/or crossing outside of the bollinger bands . This is a STRONG buy signal but should still be combined with support/resistance levels and confirmed with other indicators.
Green Diamond - this signal indicates that the volume and price oscillators are crossing outside of the bollinger bands below the 20 level but is not yet oversold. This is a potential buy signal but should still be combined with support/resistance levels and confirmed with other indicators.
Green Shaded Area - this indicates the volume and price oscillators are oversold. This is a potential buy signal but should still be combined with support/resistance levels and confirmed with other indicators.
Input Options
Show 80 Levels - This checkbox will create a red zone and green zone for the 60-80 levels on the indicator. This is useful if the volume and price oscillators reaches one of these levels, you can be sure it's going to reverse soon and can have more confidence if it crosses outside of the BBs in addition to that.
VEO Length - This changes the height of the oscillator and will change how your signals flash (more or less often). Use this if you find you're getting too many signals or not enough. I find this is best at 21 but feel free to test out what works for you depending on your timeframe.
PEO Length - This changes the height of the oscillator and will change how your signals flash (more or less often). Use this if you find you're getting too many signals or not enough. I find this is best at 21 but feel free to test out what works for you depending on your timeframe.
Moving Average Volume Source - This is currently set to None but you can change it to Exponential, Hull, or Simple moving average . I found that None works best but feel free to test out the different options.
Moving Average Length - Changing this length will do nothing to your chart if None is selected for the Moving Average Volume Source, therefore you will most likely keep this setting default at 9.
Alerts
I've set alerts on this indicator for each icon (Red Alarm, Red Diamond, Overbought, Rocket, Green Diamond, Oversold). I HIGHLY recommend setting the alerts for Candle Close so that you can be sure the signal is confirmed.
You may notice that the indicator can give multiple signals back-to-back or be overbought/oversold for multiple candles. When this happens, it's best to look at other indicators such as the RSI , MFI Pro, etc to nail the best entry and have confluence with your decision. With that said, having multiple signals back-to-back can also be an indication that the move is close to happening.
This indicator is a strong indicator by itself but works best when combined with my other indicators just as the Whales Buy-Sell and the MFI Pro as well as the RSI, and MACD i.e taking a trade when all indicators are showing overbought, "Buy", "Sell", etc. Measuring volume and price action is an extremely important aspect of trading and one I believe should not be overlooked. I hope I made everything as clear as possible and please let me know if I didn't.
PM me to obtain access and please let me know if you have any questions!
Bollinger Bands Trending Reverse StrategyWelcome to yet another script. This script was a lot easier since I was stuck for so long on the Donchian Channels one and learned so much from that one that I could use in this one.
This code should be a lot cleaner compared to the Donchian Channels, but we'll leave that up to the pro's.
This strategy has two entry signals, long = when price hits lower band, while above EMA, previous candle was bearish and current candle is bullish.
Short = when price hits upper band, while below EMA, previous candle was bullish and current candle is bearish.
Take profits are the opposite side's band(lower band for long signals, upper band for short signals). This means our take profit price will change per bar.
Our stop loss doesn't change, it's the difference between entry price and the take profit target divided by the input risk reward.

3Commas Bollinger StrategyThis strategy is intended for use as a way of backtesting various parameters available on 3commas.io composite bot using a bollinger band type trading strategy. While it's primary intention is to provide users a way of backtesting bot parameters, it can also be used to trigger a deal start by either using the {{strategy.open.alert_message}} field in your alert and providing the bot details in the configuration screen for the strategy or by including the usual deal start message provided by 3commas. You can find more information about how to do this from help.3commas.io
The primary inputs for the strategy are:
// USER INPUTS
Short MA Window - The length of the Short moving average
Long MA Window - The length of the Long moving average
Upper Band Offset - The offset to use for the upper bollinger offset
Lower Band Offset - The offset to use for the lower bollinger offset
Long Stop Loss % - The stop loss percentage to test
Long Take Profit % - The Take profit percentage to test
Initial SO Deviation % - The price deviation percentage required to place to first safety order
Safety Order Vol Step % - The volume scale to test
3Commas Bot ID - (self explanatory)
Bot Email Token - Found in the deal start message for your bot (see link in previous section for details)
3Commas Bot Trading Pair - The pair to include for composite bot start deals (should match format of 3commas, not TradingView IE. USDT_BTC not BTCUSDT)
Start Date, Month, Year and End Date, Month and Year all apply to the backtesting window. By default it will use as much data as it can given the current period select (there is less historical data available for periods below 1H) back as far as 2016 (there appears to be no historical data on Trading view much before this). If you would like to test a different period of time, just change these values accordingly.
Known Issues
Currently there are a couple of issues with this strategy that you should be aware of. I may fix them at some point in the future but they don't really bug me so this is more for informational purposes than a promise that they may one day be fixed.
Does not test trailing take profit
Number of safety orders and Safety Order Step Scale are currently not user configurable (must edit source code)
Using the user configuration to generate deal start message assumes you are triggering a composite bot, not a simple bot.

TemaI have found that such simple crossover can show good results. Basically it has only 2 TEMA and nothing more. I don't know what else to write here. The code is simplest and has only one filter, which take into consideration the direction of chart.

Donchian Channels Trending Breakout StrategyThis script looks for two entry signals. Long is when the previous breakout of the donchian channels was a low, price is above the input EMA, current price is equal or higher than the upper band and we're not in a position yet. Short is the other way around, so previous breakout of the donchian channels was a high, price is below the input EMA, current price is equal or lower than the lower band.
I haven't found a script that does take the previous highs and lows into consideration. Works for any markets in any conditions because the stop loss and profit targets are based on the upper and lower band of the donchian channels, which means the stop loss and profit targets move with the trend.
For more details see the script itself, I wrote a ton of comments.

HatiKO Envelopes v3Published source code is subject to the terms of the GNU Affero General Public License v3.0
Old flaws have been resolved.
This script describes and provides backtesting functionality to internal strategy of algorithmic crypto trading software "HatiKO bot".
Suitable for backtesting any Cryptocurrency Pair on any Exchange/Platform, any Timeframe.
Core Mechanics of this strategy are based on theory of price always returning to Moving Average + Envelopes indicator (Moving_average_envelope from Wiki)
Developement of this script and trading software is inspired by:
"Essential Technical Analysis: Tools and Techniques to Spot Market Trends" by Leigh Stevens (published on 12th of April 2002)
"Moving Average Envelopes" by ChartSchool, StockCharts platform (published on 13th of April 2015 or earlier)
"Коля Колеснік" from Crypto Times channel ("Метод сетка", published on 19th of August 2018)
"3 ways to use Moving Average Envelopes" by Rich Fitton, published on Trader's Nest (published on 28st of November 2018 or earlier)
noro's "Robot WhiteBox ShiftMA" strategy v1 script, published on TradingView platform (published on 29th of August 2018)
"Moving Average Envelopes: A Popular Trading Tool" Investopedia article (published 25th of June 2019)
and KROOL1980's blogpost on Argolabs ("Гридерство или Сетка как источник прибыли на форекс", published on 27th of February 2015)
Core Features:
1) Up to 9 Envelopes in each direction (Long/Short)
2) Use any of 6 different basis MAs, optionally use different MAs for Opening and Closure
3) Use different Timeframes for MA calculation, without any repainting and lookahead bias.
4) Fixed order size, not Martingale strategy
5) Close open position earlier by using Deviation parameter
6) PineScript v4 code
7) Anti-Spire (protection against situations like LTCUSD (Bitmex) 12/26/2020)
9) Lottery for each level
10) Total profit for the day. When activated, a histogram is drawn.
Options description:
Lot - % from your initial balance to use for order size calculation
Timeframe Short - Timeframe to use for Short Opening MA calculation, can be chosen from dropdown list, default is Current Graph Timeframe
MA Type Short - Type of MA to use for Short Opening MA calculation, can be chosen from dropdown list, default is SMA
Data Short - Source of Price for Short Opening MA calculation, can be chosen from dropdown list, default is OHLC4
MA Length Short - Period used for Short Opening MA calculation, should be >=1, default is 3
MA offset Short - Offset for MA value used for Short Envelopes calculation, should be >= 0, default is 0
Timeframe Long - Timeframe to use for Long Opening MA calculation, can be chosen from dropdown list, default is Current Graph Timeframe
MA Type Long - Type of MA to use for Long Opening MA calculation, can be chosen from dropdown list, default is SMA
Data Long - Source of Price for Long Opening MA calculation, can be chosen from dropdown list, default is OHLC4
MA Length Long - Period used for Long Opening MA calculation, should be >=1, default is 3
MA offset Long - Offset for MA value used for Long Envelopes calculation, should be >= 0, default is 0
Mode close MA Short - Enable different MA for Short position Closure, default is "false". If false, Closure MA = Opening MA
Timeframe Short Close - Timeframe to use for Short Position Closure MA calculation, can be chosen from dropdown list, default is Current Graph Timeframe
MA Type Close Short - Type of MA to use for Short Position Closure MA calculation, can be chosen from dropdown list, default is SMA
Data Short Close - Source of Price for Short Closure MA calculation, can be chosen from dropdown list, default is OHLC4
MA Length Short Close - Period used for Short Opening MA calculation, should be >=1, default is 3
Short Deviation - % to move from MA value, used to close position above or beyond MA, can be negative, default is 0
MA offset Short Close - Offset for MA value used for Short Position Closure calculation, should be >= 0, default is 0
Mode close MA Long - Enable different MA for Long position Closure, default is "false". If false, Closure MA = Opening MA
Timeframe Long Close - Timeframe to use for Long Position Closure MA calculation, can be chosen from dropdown list, default is Current Graph Timeframe
MA Type Close Long - Type of MA to use for Long Position Closure MA calculation, can be chosen from dropdown list, default is SMA
Data Long Close - Source of Price for Long Closure MA calculation, can be chosen from dropdown list, default is OHLC4
MA Length Long Close - Period used for Long Opening MA calculation, should be >=1, default is 3
Long Deviation - % to move from MA value, used to close position above or beyond MA, can be negative, default is 0
MA offset Long Close - Offset for MA value used for Long Position Closure calculation, should be >= 0, default is 0
Short 1..9 - % from MA value to put Envelopes at, for Shorts numbers should be positive, the higher is number, the higher should be Short n position, example: "Short 1 = 1, Short 2 = 2, etc."
Long 1..9 - % from MA value to put Envelopes at, for Longs numbers should be negative, the lower is number, the lower should be Long n position, example: "Long 1 = -1, Long 2 = -2, etc."
Graph notes:
Green lines - Long Envelopes .
Red lines - Short Envelopes .
Orange line - MA for closing of Short positions.
Lime line - MA for closing of Long positions.
Histogram - Profit for the last day. Black = 0, Green> 0, Red <0.
Old flaws have been resolved.
At the moment, there is one bug - if the closing and opening occurs on the same candle, then there is no close on the same candle. The situation is possible with small values of Envelope.
**************************************************************************************************************************************************************************************************************
Опубликованный исходный код регулируется Условиями Стандартной Общественной Лицензии GNU Affero v3.0
Старые недоработки были решены.
Этот скрипт описывает и предоставляет функции бектеста для внутренней стратегии алгоритмического программного обеспечения "HatiKO bot".
Подходит для тестирования любой криптовалютной пары на любой бирже/платформе, на любом таймфрейме.
Кор-механика этой стратегии основана на теории всегда возвращающейся к значению МА цены с использованием индикатора Envelopes (Moving_average_envelope from Wiki)
Разработка этого скрипта и программного обеспечения для торговли вдохновлена следующими источниками:
Книга "Essential Technical Analysis: Tools and Techniques to Spot Market Trends" Ли Стивенса (опубликовано 12 апреля 2002 года)
«Moving Average Envelopes» от ChartSchool, платформа StockCharts (опубликовано 13 апреля 2015 года или раньше)
«Коля Колеснік» с канала Crypto Times («Метод сетка», опубликовано 19 августа 2018 года)
«Moving Average Envelopes: A Popular Trading Tool», статья Investopedia (опубликовано 25 июня 2019 года)
Блог KROOL1980 из Argolabs («Гридерство или Сетка как источник прибыли на форекс», опубликовано 27 февраля 2015 года)
Основные особенности:
1) До 9-х Ордеров в каждом из направлении (Лонг / Шорт)
2) Выбор из 6-ти разных базовых МА, опционально используйте разные МА для открытия и закрытия.
3) Используйте разные таймфреймы для расчета MA, без перерисовки и "эффекта стеклянного шара".
4) Фиксированный размер ордера, а не стратегия Мартингейла
5) Возможность закрытия открытой позиции заблаговременно, используя параметр Deviation
6) Код реализован на PineScript v4
7) Антишпиль ( защита от ситуаций типа LTCUSD ( Bitmex ) 26.12.2020 )
9) Лотность для каждого уровня
10) Суммарный профит за день. При активации рисуется гистограмма.
Описание параметров:
Lot - % от вашего первоначального баланса, используется при расчете размера Ордера
Timeframe Short - таймфрейм, используемый для расчета МА Открытия Шорт позиций, может быть выбран из списка, по умолчанию - таймфрейм текущего графика
MA Type Short - тип MA, используемый для расчета МА Открытия Шорт позиций, может быть выбран из списка, по умолчанию SMA
Data Short - источник цены для расчета МА Открытия Шорт позиций, может быть выбран из списка, по умолчанию OHLC4
MA Length Short - период, используемый для расчета МА Открытия Шорт позиций, должен быть >= 1, по умолчанию 3
MA Offset Short - смещение значения MA, используемого для расчета Шорт Ордеров, должно быть >= 0, по умолчанию 0
Timeframe Long - таймфрейм, используемый для расчета МА Открытия Лонг позиций, может быть выбран из списка, по умолчанию - таймфрейм текущего графика
MA Type Long - тип MA, используемый для расчета МА Открытия Лонг позиций, может быть выбран из списка, по умолчанию SMA
Data Long - источник цены для расчета МА Открытия Лонг позиций, может быть выбран из списка, по умолчанию OHLC4
MA Length Long - период, используемый для расчета МА Открытия Лонг позиций, должен быть >= 1, по умолчанию 3
MA Offset Long - смещение значения MA, используемого для расчета Лонг Ордеров, должно быть >= 0, по умолчанию 0
Mode close MA Short - Включает отдельное MA для закрытия Шорт позиции, по умолчанию «false». Если false, MA Закрытия = MA Открытия
Timeframe Short Close - таймфрейм, используемый для расчета МА Закрытия Шорт позиций, может быть выбран из списка, по умолчанию - таймфрейм текущего графика
MA Type Close Short - тип MA, используемый при расчете МА Закрытия Шорт позиции. Mожно выбрать из списка, по умолчанию SMA
Data Short Close - источник цены для расчета МА Закрытия Шорт позиций, может быть выбран из списка, по умолчанию OHLC4
MA Length Short Close - период, используемый для расчета МА Закрытия Шорт позиции, должен быть >= 1, по умолчанию 3
Short Deviation - % отклонения от значения MA, используется для закрытия позиции выше или ниже рассчитанного значения MA, может быть отрицательным, по умолчанию 0
MA Offset Short Close - смещение значения MA, используемого для расчета закрытия Шорт позиции, должно быть >= 0, по умолчанию 0
Mode close MA Long - Включает разные MA для закрытия Лонг позиции, по умолчанию «false». Если false, MA Закрытия = MA Открытия
Timeframe Long Close - таймфрейм, используемый для расчета МА Закрытия Лонг позиций, может быть выбран из списка, по умолчанию - таймфрейм текущего графика
MA Type Close Long - тип MA, используемый при расчете МА Закрытия Лонг позиции. Mожно выбрать из списка, по умолчанию SMA
Data Long Close - источник цены для расчета МА Закрытия Лонг позиций, может быть выбран из списка, по умолчанию OHLC4
MA Length Long Close - период, используемый для расчета МА Закрытия Лонг позиции, должен быть >= 1, по умолчанию 3
Long Deviation -% для перехода от значения MA, используется для закрытия позиции выше или ниже рассчитанного значения MA, может быть отрицательным, по умолчанию 0
MA Offset Long Close - смещение значения MA, используемого для расчета закрытия Лонг позиции, должно быть >= 0, по умолчанию 0
Short 1..9 - % от значения MA для размещения Ордеров, для Шорт Ордеров должен быть положительным, чем выше номер, тем выше должна располагаться позиция Short n, например: « Short 1 = 1, Short 2 = 2 и т.д. "
Long 1..9 - % от значения MA для размещения Ордеров, для Лонг Ордеров должно быть отрицательным, чем ниже число, тем ниже должна располагаться позиция Long n, например: « Long 1 = -1, Long 2 = -2, и т.д."
Пояснения к графику:
Зеленые линии - Лонг Ордера.
Красные линии - Шорт Ордера.
Оранжевая линия - MA Закрытия Шорт позиций.
Лаймовая линия - MA Закрытия Лонг позиций.
Гистограмма - Профит за последние сутки.Черная = 0, Зеленая > 0, красная < 0.
Старые недоработки были решены.
На данный момент есть один баг - если закрытие и открытие происходит на одной свече, то на этой же свече нет закрытия. Ситуация возможна при небольших значениях Envelope.
Published source code is subject to the terms of the GNU Affero General Public License v3.0
Old flaws have been resolved.
This script describes and provides backtesting functionality to internal strategy of algorithmic crypto trading software "HatiKO bot".
Suitable for backtesting any Cryptocurrency Pair on any Exchange/Platform, any Timeframe.
Core Mechanics of this strategy are based on theory of price always returning to Moving Average + Envelopes indicator (Moving_average_envelope from Wiki)
Developement of this script and trading software is inspired by:
"Essential Technical Analysis: Tools and Techniques to Spot Market Trends" by Leigh Stevens (published on 12th of April 2002)
"Moving Average Envelopes" by ChartSchool, StockCharts platform (published on 13th of April 2015 or earlier)
"Коля Колеснік" from Crypto Times channel ("Метод сетка", published on 19th of August 2018)
"3 ways to use Moving Average Envelopes" by Rich Fitton, published on Trader's Nest (published on 28st of November 2018 or earlier)
noro's "Robot WhiteBox ShiftMA" strategy v1 script, published on TradingView platform (published on 29th of August 2018)
"Moving Average Envelopes: A Popular Trading Tool" Investopedia article (published 25th of June 2019)
and KROOL1980's blogpost on Argolabs ("Гридерство или Сетка как источник прибыли на форекс", published on 27th of February 2015)
Core Features:
1) Up to 9 Envelopes in each direction (Long/Short)
2) Use any of 6 different basis MAs, optionally use different MAs for Opening and Closure
3) Use different Timeframes for MA calculation, without any repainting and lookahead bias.
4) Fixed order size, not Martingale strategy
5) Close open position earlier by using Deviation parameter
6) PineScript v4 code
7) Anti-Spire (protection against situations like LTCUSD (Bitmex) 12/26/2020)
9) Lottery for each level
10) Total profit for the day. When activated, a histogram is drawn.
Options description:
Lot - % from your initial balance to use for order size calculation
Timeframe Short - Timeframe to use for Short Opening MA calculation, can be chosen from dropdown list, default is Current Graph Timeframe
MA Type Short - Type of MA to use for Short Opening MA calculation, can be chosen from dropdown list, default is SMA
Data Short - Source of Price for Short Opening MA calculation, can be chosen from dropdown list, default is OHLC4
MA Length Short - Period used for Short Opening MA calculation, should be >=1, default is 3
MA offset Short - Offset for MA value used for Short Envelopes calculation, should be >= 0, default is 0
Timeframe Long - Timeframe to use for Long Opening MA calculation, can be chosen from dropdown list, default is Current Graph Timeframe
MA Type Long - Type of MA to use for Long Opening MA calculation, can be chosen from dropdown list, default is SMA
Data Long - Source of Price for Long Opening MA calculation, can be chosen from dropdown list, default is OHLC4
MA Length Long - Period used for Long Opening MA calculation, should be >=1, default is 3
MA offset Long - Offset for MA value used for Long Envelopes calculation, should be >= 0, default is 0
Mode close MA Short - Enable different MA for Short position Closure, default is "false". If false, Closure MA = Opening MA
Timeframe Short Close - Timeframe to use for Short Position Closure MA calculation, can be chosen from dropdown list, default is Current Graph Timeframe
MA Type Close Short - Type of MA to use for Short Position Closure MA calculation, can be chosen from dropdown list, default is SMA
Data Short Close - Source of Price for Short Closure MA calculation, can be chosen from dropdown list, default is OHLC4
MA Length Short Close - Period used for Short Opening MA calculation, should be >=1, default is 3
Short Deviation - % to move from MA value, used to close position above or beyond MA, can be negative, default is 0
MA offset Short Close - Offset for MA value used for Short Position Closure calculation, should be >= 0, default is 0
Mode close MA Long - Enable different MA for Long position Closure, default is "false". If false, Closure MA = Opening MA
Timeframe Long Close - Timeframe to use for Long Position Closure MA calculation, can be chosen from dropdown list, default is Current Graph Timeframe
MA Type Close Long - Type of MA to use for Long Position Closure MA calculation, can be chosen from dropdown list, default is SMA
Data Long Close - Source of Price for Long Closure MA calculation, can be chosen from dropdown list, default is OHLC4
MA Length Long Close - Period used for Long Opening MA calculation, should be >=1, default is 3
Long Deviation - % to move from MA value, used to close position above or beyond MA, can be negative, default is 0
MA offset Long Close - Offset for MA value used for Long Position Closure calculation, should be >= 0, default is 0
Short 1..9 - % from MA value to put Envelopes at, for Shorts numbers should be positive, the higher is number, the higher should be Short n position, example: "Short 1 = 1, Short 2 = 2, etc."
Long 1..9 - % from MA value to put Envelopes at, for Longs numbers should be negative, the lower is number, the lower should be Long n position, example: "Long 1 = -1, Long 2 = -2, etc."
Graph notes:
Green lines - Long Envelopes .
Red lines - Short Envelopes .
Orange line - MA for closing of Short positions.
Lime line - MA for closing of Long positions.
Histogram - Profit for the last day. Black = 0, Green> 0, Red <0.
Old flaws have been resolved.
At the moment, there is one bug - if the closing and opening occurs on the same candle, then there is no close on the same candle. The situation is possible with small values of Envelope.
**************************************************************************************************************************************************************************************************************
Опубликованный исходный код регулируется Условиями Стандартной Общественной Лицензии GNU Affero v3.0
Старые недоработки были решены.
Этот скрипт описывает и предоставляет функции бектеста для внутренней стратегии алгоритмического программного обеспечения "HatiKO bot".
Подходит для тестирования любой криптовалютной пары на любой бирже/платформе, на любом таймфрейме.
Кор-механика этой стратегии основана на теории всегда возвращающейся к значению МА цены с использованием индикатора Envelopes (Moving_average_envelope from Wiki)
Разработка этого скрипта и программного обеспечения для торговли вдохновлена следующими источниками:
Книга "Essential Technical Analysis: Tools and Techniques to Spot Market Trends" Ли Стивенса (опубликовано 12 апреля 2002 года)
«Moving Average Envelopes» от ChartSchool, платформа StockCharts (опубликовано 13 апреля 2015 года или раньше)
«Коля Колеснік» с канала Crypto Times («Метод сетка», опубликовано 19 августа 2018 года)
«Moving Average Envelopes: A Popular Trading Tool», статья Investopedia (опубликовано 25 июня 2019 года)
Блог KROOL1980 из Argolabs («Гридерство или Сетка как источник прибыли на форекс», опубликовано 27 февраля 2015 года)
Основные особенности:
1) До 9-х Ордеров в каждом из направлении (Лонг / Шорт)
2) Выбор из 6-ти разных базовых МА, опционально используйте разные МА для открытия и закрытия.
3) Используйте разные таймфреймы для расчета MA, без перерисовки и "эффекта стеклянного шара".
4) Фиксированный размер ордера, а не стратегия Мартингейла
5) Возможность закрытия открытой позиции заблаговременно, используя параметр Deviation
6) Код реализован на PineScript v4
7) Антишпиль ( защита от ситуаций типа LTCUSD ( Bitmex ) 26.12.2020 )
9) Лотность для каждого уровня
10) Суммарный профит за день. При активации рисуется гистограмма.
Описание параметров:
Lot - % от вашего первоначального баланса, используется при расчете размера Ордера
Timeframe Short - таймфрейм, используемый для расчета МА Открытия Шорт позиций, может быть выбран из списка, по умолчанию - таймфрейм текущего графика
MA Type Short - тип MA, используемый для расчета МА Открытия Шорт позиций, может быть выбран из списка, по умолчанию SMA
Data Short - источник цены для расчета МА Открытия Шорт позиций, может быть выбран из списка, по умолчанию OHLC4
MA Length Short - период, используемый для расчета МА Открытия Шорт позиций, должен быть >= 1, по умолчанию 3
MA Offset Short - смещение значения MA, используемого для расчета Шорт Ордеров, должно быть >= 0, по умолчанию 0
Timeframe Long - таймфрейм, используемый для расчета МА Открытия Лонг позиций, может быть выбран из списка, по умолчанию - таймфрейм текущего графика
MA Type Long - тип MA, используемый для расчета МА Открытия Лонг позиций, может быть выбран из списка, по умолчанию SMA
Data Long - источник цены для расчета МА Открытия Лонг позиций, может быть выбран из списка, по умолчанию OHLC4
MA Length Long - период, используемый для расчета МА Открытия Лонг позиций, должен быть >= 1, по умолчанию 3
MA Offset Long - смещение значения MA, используемого для расчета Лонг Ордеров, должно быть >= 0, по умолчанию 0
Mode close MA Short - Включает отдельное MA для закрытия Шорт позиции, по умолчанию «false». Если false, MA Закрытия = MA Открытия
Timeframe Short Close - таймфрейм, используемый для расчета МА Закрытия Шорт позиций, может быть выбран из списка, по умолчанию - таймфрейм текущего графика
MA Type Close Short - тип MA, используемый при расчете МА Закрытия Шорт позиции. Mожно выбрать из списка, по умолчанию SMA
Data Short Close - источник цены для расчета МА Закрытия Шорт позиций, может быть выбран из списка, по умолчанию OHLC4
MA Length Short Close - период, используемый для расчета МА Закрытия Шорт позиции, должен быть >= 1, по умолчанию 3
Short Deviation - % отклонения от значения MA, используется для закрытия позиции выше или ниже рассчитанного значения MA, может быть отрицательным, по умолчанию 0
MA Offset Short Close - смещение значения MA, используемого для расчета закрытия Шорт позиции, должно быть >= 0, по умолчанию 0
Mode close MA Long - Включает разные MA для закрытия Лонг позиции, по умолчанию «false». Если false, MA Закрытия = MA Открытия
Timeframe Long Close - таймфрейм, используемый для расчета МА Закрытия Лонг позиций, может быть выбран из списка, по умолчанию - таймфрейм текущего графика
MA Type Close Long - тип MA, используемый при расчете МА Закрытия Лонг позиции. Mожно выбрать из списка, по умолчанию SMA
Data Long Close - источник цены для расчета МА Закрытия Лонг позиций, может быть выбран из списка, по умолчанию OHLC4
MA Length Long Close - период, используемый для расчета МА Закрытия Лонг позиции, должен быть >= 1, по умолчанию 3
Long Deviation -% для перехода от значения MA, используется для закрытия позиции выше или ниже рассчитанного значения MA, может быть отрицательным, по умолчанию 0
MA Offset Long Close - смещение значения MA, используемого для расчета закрытия Лонг позиции, должно быть >= 0, по умолчанию 0
Short 1..9 - % от значения MA для размещения Ордеров, для Шорт Ордеров должен быть положительным, чем выше номер, тем выше должна располагаться позиция Short n, например: « Short 1 = 1, Short 2 = 2 и т.д. "
Long 1..9 - % от значения MA для размещения Ордеров, для Лонг Ордеров должно быть отрицательным, чем ниже число, тем ниже должна располагаться позиция Long n, например: « Long 1 = -1, Long 2 = -2, и т.д."
Пояснения к графику:
Зеленые линии - Лонг Ордера.
Красные линии - Шорт Ордера.
Оранжевая линия - MA Закрытия Шорт позиций.
Лаймовая линия - MA Закрытия Лонг позиций.
Гистограмма - Профит за последние сутки.Черная = 0, Зеленая > 0, красная < 0.
Старые недоработки были решены.
На данный момент есть один баг - если закрытие и открытие происходит на одной свече, то на этой же свече нет закрытия. Ситуация возможна при небольших значениях Envelope.

Volume Extractor By CryptoScriptsThe Volume Extractor is an indicator I've been working on for awhile that involves a Volume Oscillator derived from various volume metrics combined with Bollinger Bands and Overbought/Oversold levels. This indicator is unique because it not only measures the standard deviations whenever the oscillator crosses outside the BBs but it does so at ranges that are most advantageous for the trader to identify KEY buy/sell levels (as shown above). I'll break down each signal below and how to best take advantage of them so you can get the best entries and capture the most profit per trade.
*This indicator works best on the Binance or Bybit exchange for crypto but also works for stocks and forex. It's best used on small-medium timeframes such as the 15m, 1h, 4h, 8hr, or 12h. It tends to give more false signals on the 1D timeframes and higher.
Red Alarm - this signal indicates that the volume oscillator is overbought AND is crossing outside of the bollinger bands . This is a STRONG sell signal but should still be combined with support/resistance levels and confirmed with other indicators.
Red Diamond - this signal indicates that the volume oscillator is crossing outside of the bollinger bands above the 20 level but is not yet overbought. This is a potential sell signal but should still be combined with support/resistance levels and confirmed with other indicators.
Red Shaded Area - this indicates the volume oscillator is overbought. This is a potential sell signal but should still be combined with support/resistance levels and confirmed with other indicators.
Rocket - this signal indicates that the volume oscillator is oversold AND is crossing outside of the bollinger bands . This is a STRONG buy signal but should still be combined with support/resistance levels and confirmed with other indicators.
Green Diamond - this signal indicates that the volume oscillator is crossing outside of the bollinger bands below the 20 level but is not yet oversold. This is a potential buy signal but should still be combined with support/resistance levels and confirmed with other indicators.
Green Shaded Area - this indicates the volume oscillator is oversold. This is a potential buy signal but should still be combined with support/resistance levels and confirmed with other indicators.
Input Options
Show 80 Levels - This checkbox will create a red zone and green zone for the 60-80 levels on the indicator. This is useful if the volume oscillator reaches one of these levels, you can be sure it's going to reverse soon and can have more confidence if it crosses outside of the BBs in addition to that.
VEO Length - This changes the height of the oscillator and will change how your signals flash (more or less often). Use this if you find you're getting too many signals or not enough. I find this is best at 21 but feel free to test out what works for you depending on your timeframe.
Moving Average Volume Source - This is currently set to None but you can change it to Exponential, Hull, or Simple moving average . I found that None works best but feel free to test out the different options.
Moving Average Length - Changing this length will do nothing to your chart if None is selected for the Moving Average Volume Source, therefore you will most likely keep this setting default at 9.
Alerts
I've set alerts on this indicator for each icon (Red Alarm, Red Diamond, Overbought, Rocket, Green Diamond, Oversold). I HIGHLY recommend setting the alerts for Candle Close so that you can be sure the signal is confirmed.
You may notice that the indicator can give multiple signals back-to-back or be overbought/oversold for multiple candles. When this happens, it's best to look at other indicators such as the RSI , MFI Pro, etc to nail the best entry and have confluence with your decision. With that said, having multiple signals back-to-back can also be an indication that the move is close to happening.
This indicator is a strong indicator by itself but works best when paired with my Price Extractor indicator i.e taking a trade when both indicators are displaying overbought/oversold or crossing outside of the bollinger bands . Measuring price action is an extremely important aspect of trading and one I believe should not be overlooked. I hope I made everything as clear as possible and please let me know if I didn't.
PM me to obtain access and please let me know if you have any questions!

Lash Out OscillatorPurpose of this Script
The Lash Out Oscillator (LOO) is designed to indicate local tops and bottoms of the considered asset when the price considerably 'lashes out', based on normalized price deltas. It also features divergences that can be used for trading. The LOO is mainly used for Ethereum (ETH) and Bitcoin (BTC), but can in theory be used for every asset. Customization of the input settings is then needed to match the boundaries well to the historic price data. The default parameters are tuned for Ethereum.
Settings
Default input settings are tuned for Ethereum (ETH/USD) on Kraken on daily (D) timeframe.
Generally best used on daily (D) timeframe. You might also want to test the 4-hourly (4H) timeframe.
After applying the indicator to the chart, one typically has to zoom into the oscillator as the raw price delta is also plotted (in blue) which often overshadows the oscillator in magnitude.
For all other assets besides Ethereum, the oscillator and boundary values have (very likely) to be adjusted.
All individual pieces can be hidden from the chart (especially important as one might want to hide the blue raw price delta as it could disturb the process of tuning the oscillator due to automatic zoom-outs).
Input Settings for Bitcoin
Aside from Ethereum (default settings), I provide the following settings which can be used for Bitcoin (BNC:BLX) on daily (D) timeframe:
Averaging Length: 20
Donchian Length: 40
Donchian Scaling: 0.2
Fixed Red High: 6.1
Fixed Red Low: 2.3
Fixed Green High: -2.3
Fixed Green Low: -6.1
Still, feel free to tune the LOO to your liking.
Differences to Classic Oscillators as e.g. Relative Strength Index (RSI)
Classic oscillators as the RSI feature fixed limit values (e.g. 0 to 100 for the RSI) and are therefore (as the name says) very relative (you cannot reliably guess tops or bottoms just from the RSI value). The LOO features non-fixed limit values (they can theoretically go to infinity, but are in practice very well contained within some range), leading to less relativity and more absolute behaviour, which is beneficial in spotting local tops and bottoms. Just as the RSI, the LOO shows (bullish and bearish) divergences on the chart, which can be used for refined trading.
Interpretation
Given are two boundary types:
Fixed boundary areas
Donchian channels
Normally one should look out for the LOO to hit the red or green fixed boundary areas. Although the range is in theory infinite, the fixed areas give good hints when a local top could be hit, at least for the Ethereum case. For additional trades one can look for the LOO to hit the Donchian channels. Note that these areas/channels have to be adjusted by hand for all other assets besides Ethereum. General trading ideas are:
After the red (green) area is hit, a short- to mid-term (depends on market phase) short/hedge (long) trade might be in order.
During full bullruns (bearmarkets), the LOO can extend a bit more into the red (green) area. Here look out for bearish (bullish) divergences to possibly enter mid-term trades.
After the upper (lower) Donchian channel is hit, a short/hedge (long) trade could be wagered.
Alerts
Alerts are built-in that trigger when the LOO crosses into the red or green fixed boundary regions.
Access
For access to this indicator please contact me via DM on TradingView or on Twitter (linked on my TradingView profile and in my signature).
