Previous Daily Open/High/Low/CloseThis indicator plots the previous day's open, high, low and close levels on the chart
Published by Luke (DisciplinedTrader.co.uk)
Close

MTF Previous Open/Close/RangeThis indicator will simply plot on your chart the Daily/Weekly/Monthly previous candle levels.
The "Auto" mode will allow automatic adjustment of timeframe displayed according to your chart.
Otherwise you can select manually.
Indicator plots the open/close and colors the high-low range area in the background.
Hope this simple indicator will help you !
You can check my indicators via my TradingView's Profile : @PRO_Indicators

[M]HLC PlotsHLC Plots
Draws points (lines) to high low and close. In some trading situations, this method is more convenient than candles or bars.
--------------------------------------
Рисует точки(линии) по high low и close. В некоторых ситуациях торговли такой способ бывает удобней, чем свечи или бары. На вкус и цвет все фломастеры разные =)

Close of relevant previous periodThis indicator puts the previous close value of a higher relevant time frame on the chart, it adepts to the period of the chart. Relevant means that it puts:
Close of previous year in monthly chart
Close of previous month in weekly chart
Close of either previous month of week in daily chart, default setting is week
Close of previous week in 4hourly and 3hourly charts
Close of previous day in 30minute and higher intraday charts
Not bother the user below 30 minutes.

Weekly closeIt turned out not to be that easy to plot the close of the previous week in hourly or daily charts. In my first experiments things went wrong on Friday or intraday if you simply use the security function. So here is the thing with an algorithm that guaranties the correct value.

Open/Close Vertical Line by WiscoDishOpen and close lines. I used a 4 minute timeframe, so the open price goes on 08:28-08:32 central time for the 8:30 open. You can change those times if you want, just copy/paste the script and edit.

Open Close Cross Alert R6 by JustUncleLThis revision of this indicator is an Open Public release. The indicator alert based on JayRogers "Open Close Cross Strategy R2" and is used in conjunction with the revised "Open Close Cross Strategy R5".
Description:
This indicator alert created for TradingView alarm sub-system (via the alertcondition() function, which currently does not work in a "Strategy" script). Also this indicator plots the Difference Factor between the Close and Open Moving Averages, this gives a good indication of strength of move. Also included in this release is optional Divergence finder with variable width channel.

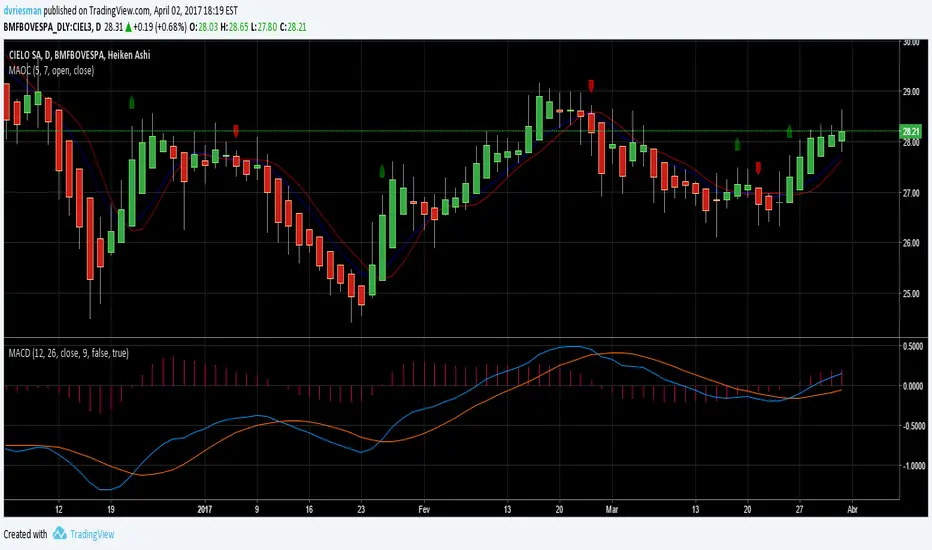
HEIKIN ASHI COLOUR CHANGE ALERTThis can be used to trigger an alert if Heikin Ashi bar changes color :)


EMA_ConvergenceFirst I have to give kudos to my son who I asked to take a shot at creating this little indicator. Nice work son!
While trading, one of the things I look for is when price or certain EMA's approach another EMA. The example that I use on this 1 minute SPY chart is an 8 EMA and 20 EMA. I am looking for when the 8 and 20 are within' 3 cents of each other. Many times when they are getting close, price is approaching a top or bottom. I am looking for a candlestick reversal around that area. You may want to know when PRICE is near the 50 EMA: Use EMA 1 and 50 for that. Having it light up on top of the page, or elsewhere, makes it easier to look for the convergence when it occurs. If it lights up for a long period, price may be going sideways. I don't enter into a trade until the EMA starts separating, usually with another candlestick formation.
You are able to change the distance for convergence and two EMA's. Unfortunately you will have to adjust the convergence number up as you increase in time frames. This is designed to see when they are close, not when they cross.
The bars on top of this example are lit up purple due to the 8 and 20 EMA are within' 3 cents of each other.
If you want to overlay the price bars, instead of having it separate, just change overlay to "true"
Enjoy.

Open Close Daily LineThis will place circles on your chart for the opening daily price. If price is above, the circles are green. If price is below, the circles are red. I wanted to be able to see the opening price a bit easier while in smaller time frames.
I decided to add the previous daily closing line to the original script. Basically looking for good support / resistance

_CM_High_Low_Open_Close_Weekly-IntradayUpdated Indicator - Plots High, Low Open, Close
For Weekly, Daily, 4 Hour, 2 Hour, 1 Hour Current and Previous Sessions Levels.
Updated Adds 4 Hour, 2 Hour, 1 Hour levels for Forex and Intra-Day Traders.

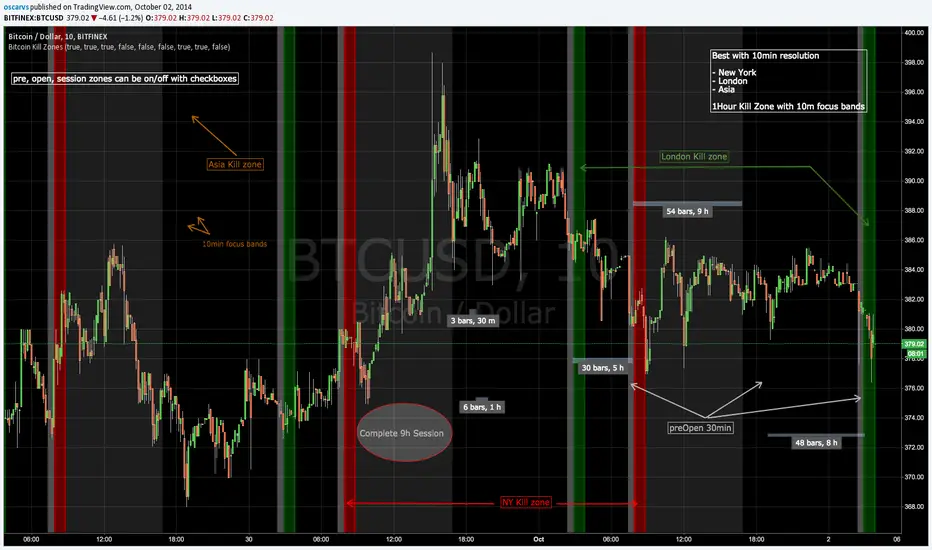
Bitcoin Kill ZonesGRAB THE LASTEST VERSION HERE:
*********************
This indicator shows when the candle is entering New York, London or Asia Kill Zone (open market).
gray: 30min before market opens.
red, green, orange: First 1 hour with 10min focus bands.
silver: complete 30min session market until close.
FIX NOTE:
Set this hours for Asia to fix the 1 hour difference:
2330-0000
0000-0010
0010-0050
0050-0100
0100-0900
* this is beta, in planning to mark dynamically ranges before/after open/close session and use some Fibs to have some ripple effect indicator
Updated code: github.com