Breakout ScannerThis is a Breakout Scanner that shows you the immediate trend across 4 higher timeframes for up to 10 different tickers. It calculates a score from 1 to 3 for bullish and -1 to -3 for bearish based on where price is currently at compared to the previous higher timeframe’s candle levels.
When price is breaking out of the previous higher timeframe candle’s range, then it will have a score of 3 for bullish breakout or -3 for bearish breakout. When price is above the high or below the low of multiple different higher timeframe candles, you can expect price to continue the breakout and move to a new area of price range.
The brighter red or green the color is, the stronger the trend is on that timeframe. When it shows a bright green or red box on the far right side of a ticker, it is notifying you that the ticker is bullish or bearish on all timeframes and trending strongly, so switch over to that chart and look to trade in the direction of that trend.
The tickers, colors and time frames can be customized to suit your preference and you can also turn off as many tickers or time frames as you’d like if you want less tickers or time frames to show up on the indicator. It also includes alerts for when all timeframes are bullish or all timeframes are bearish for one ticker.
Make sure to keep each timeframe set to a timeframe that is higher than your chart timeframe.
Bullish Scoring & Colors
If the current candle close is above the midline of the higher time frame candle, it is given a score of 1 and a dark green background. If the current candle close is above the higher timeframe candle body, then it is given a score of 2 and a medium green background. If the current candle close is above the high of the higher time frame candle, it is given a score of 3 and a bright green background.
The higher the score the stronger the bullish trend and the brighter green the color will be.
Bearish Scoring & Colors
If the current candle close is below the midline of the higher timeframe candle, it is given a score of -1 and a dark red background. If the current candle close is below the higher timeframe candle body, then it is given a score of -2 and a medium red background. If the current candle close is below the low of the higher timeframe candle, it is given a score of -3 and a bright red background.
The lower the score, the stronger the bearish trend and the brighter red the color will be.
Total Score Display
On the right side of the indicator table, there is a column that displays the total score by adding all the scores together so you can easily tell the overall strength of the trend across all timeframes. Wait for the trend score to be at least 75% of the possible score to trade so you can ensure you are only trading very strong trends and increase your probability of winning your trade. The total score will update according to how many time frames you have enabled in the settings. You can also turn on or off the total score count if you prefer. The default setting is off.
All Timeframe Trends Agree
When all of the timeframes that you have turned on are in the same direction at the same time, a green or red box will appear on the far right side of the scanner. This is a visual cue that lets you know the strongest trending markets without having to read any of the numbers. Make sure to check out the charts for the markets that have a green or red box on the far right side and look for potential trend trading opportunities.
Alerts
You can set alerts for when all time frames for a certain ticker are bullish or bearish. If you have some time frames turned off at the time of creating your alerts, then it will only require all time frames that are on to be all bullish or bearish to generate an alert. Make sure to set your alerts to once per bar close to ensure you don’t get premature alerts that aren’t yet valid.
Best Way To Use The Scanner
For best results, make sure you wait for the trend to show all bullish or all bearish at the same time and then look to trade in the direction of the strong trend. If you can be patient enough to do that, you will increase the probability of winning your trade because you are trading with the direction of the overall higher timeframe trend when the market is trending strongly and making new highs or lows.
When one of the markets in the scanner shows all timeframes trending, go to that chart and see how price action is reacting to the previous higher timeframe candle levels. You can see those levels easily by adding our Higher Timeframe Candle Levels indicator to your chart and using the same timeframes as your Breakout Scanner is using.
If price is holding the higher timeframe candle levels well, then look to place trades in the direction of the trend that the Breakout Scanner is showing.
Other Indicators To Pair This With
Use this in combination with our Higher Timeframe Candle Levels indicator so you can see all of these levels being used to calculate the trend strength scores and watch how price reacts to those levels. You should also use our Trend Strength Indicator to easily read the historical trends of price compared to the higher timeframes and use those trends to guide you on when to trade and which direction to trade.
Trend Strength Indicator, Higher Timeframe Candle Levels and the Breakout Scanner all use the same levels to calculate the trend scores so they are designed to work all together to help you quickly be able to read a chart and find what direction to trade in.
Candlestick-Analysen

3D Cube Projection - √3 Diagonal3D Cube Projection - √3 Diagonal
OVERVIEW
This indicator implements Bradley F. Cowan's cube projection methodology from his "Four Dimensional Stock Market Structures & Cycles" work. It visualizes a 3D cube projected onto the 2D price-time chart, using the √3 (square root of 3) body diagonal as the primary analytical tool for identifying market structure and potential cycle termination points.
METHODOLOGY
The cube is constructed by selecting two pivot points (A and E) which form the body diagonal - the longest diagonal running through the cube's interior from one corner to the diagonally opposite corner. According to Cowan's geometric approach:
- Point A = Starting pivot (low or high)
- Point E = Ending pivot (opposite extreme)
- Body Diagonal (A→E) = √3 × cube side length
- Face Diagonal (A→C) = √2 × cube side length
The script calculates the cube dimensions by:
1. Measuring the total price range from A to E
2. Dividing by √3 to determine the cube side length in price
3. Distributing the time component across three equal segments
4. Projecting the 3D structure onto the 2D chart plane
FEATURES
✓ Interactive date selection for points A and E
✓ Automatic UPLEG/DOWNLEG detection
✓ All 8 cube vertices labeled (A-H)
✓ All 6 cube faces with independent color/opacity controls
✓ √3 body diagonal (red line by default)
✓ √2 face diagonal (orange line by default)
✓ Customizable cube lines, fills, and labels
✓ Information table showing key measurements
VISUAL CUSTOMIZATION
- Front & Back faces: Box fills for the two square faces
- Side faces: Left and right vertical faces
- Top & Bottom faces: Horizontal connecting faces
- Each group has independent color and opacity settings
- Label size and transparency fully adjustable
- Cube line styles (solid, dashed, dotted) for depth perception
IMPORTANT LIMITATIONS & DISCLOSURES
This indicator works within the inherent constraints of projecting 3D geometry onto a 2D price-time chart:
⚠️ VISUAL APPROXIMATION: This is a visual projection tool, not a mathematically perfect 3D cube. True 3D geometry cannot be accurately represented on a 2D plane without distortion.
⚠️ TIME DISTRIBUTION: The script divides the time axis into three equal segments (total bars ÷ 3) for practical visualization. This is an approximation that prioritizes visual coherence over strict geometric accuracy.
⚠️ UNIT SCALING: Price and time use different units (dollars vs. bars), making true isometric projection impossible. The cube appears proportional on screen but the dimensions are not directly comparable.
⚠️ 2D CONSTRAINT: We only have X (time) and Y (price) axes available. The Z-axis (depth) is simulated through visual projection techniques (line styles, shading).
INTENDED USE
This tool is designed for traders and analysts who study Bradley Cowan's geometric market analysis methods. It helps visualize:
- Market structure in geometric terms
- Potential support/resistance zones at cube edges
- Cycle timing relationships using √2 and √3 ratios
- Harmonic price-time relationships
The cube projection should be used as one component of a comprehensive analysis approach, combined with other technical tools and fundamental analysis.
MATHEMATICAL FOUNDATION
While the visual representation involves approximations, the core √3 relationship is mathematically sound:
- For any cube, the body diagonal = √3 × side length
- The face diagonal = √2 × side length
- These ratios are preserved in the price dimension calculations
HOW TO USE
1. Select your starting date (Point A) - typically a significant low or high
2. Select your ending date (Point E) - the opposite extreme pivot
3. The indicator automatically constructs the cube geometry
4. Analyze the cube edges, diagonals, and faces for market structure insights
5. Adjust colors and opacity to suit your chart aesthetic
TECHNICAL NOTES
- Works on all timeframes and instruments
- Best viewed on charts with sufficient historical data
- Cube updates in real-time as new bars form
- Range selection is marked with vertical lines and shading
- Calculator table shows Point A, Point E, side length, and bar measurements
ACKNOWLEDGMENT
This indicator is based on the geometric market analysis principles developed by Bradley F. Cowan. Users are encouraged to study Cowan's original works for deeper understanding of the theoretical framework.
DISCLAIMER
This indicator is for educational and analytical purposes only. It does not constitute financial advice. Past performance does not guarantee future results. Always conduct your own research and risk management before making trading decisions.

Quantura - Supply & Demand Zone DetectionIntroduction
“Quantura – Supply & Demand Zone Detection” is an advanced indicator designed to automatically detect and visualize institutional supply and demand zones, as well as breaker blocks, directly on the chart. The tool helps traders identify key areas of market imbalance and potential reversal or continuation zones, based on price structure, volume, and ATR dynamics.
Originality & Value
This indicator provides a unique and adaptive method of zone detection that goes beyond simple pivot or candle-based logic. It merges multiple layers of confirmation—volume sensitivity, ATR filters, and swing structure—while dynamically tracking how zones evolve as the market progresses. Unlike traditional supply and demand indicators, this script also detects and plots Breaker Zones when previous imbalances are violated, giving traders an extra layer of market context.
The key values of this tool include:
Automated detection of high-probability supply and demand zones.
Integration of both volume and ATR filters for precision and adaptability.
Dynamic zone merging and updating based on price evolution.
Identification of breaker blocks (invalidated zones) to visualize market structure shifts.
Optional bullish and bearish trade signals when zones are retested.
Clear, visually optimized plotting for efficient chart interpretation.
Functionality & Core Logic
The indicator continuously scans recent price data for swing highs/lows and combines them with optional volume and ATR conditions to validate potential zones.
Demand Zones are formed when price action indicates accumulation or a strong bullish rejection from a low area.
Supply Zones are created when distribution or strong bearish rejection occurs near local highs.
Breaker Blocks appear when existing zones are invalidated by price, helping traders visualize potential market structure shifts.
Bullish and bearish signals appear when price re-enters an active zone or breaks through a breaker block.
Parameters & Customization
Demand Zones / Supply Zones: Enable or disable each individually.
Breaker Zones: Activate breaker block detection for invalidated zones.
Volume Filter: Optional filter to only confirm zones when volume exceeds its long-term average by a user-defined multiplier.
ATR Filter: Optional filter for volatility confirmation, ensuring zones form under strong momentum conditions.
Swing Length: Controls the number of bars used to detect structural pivots.
Sensitivity Controls: Adjustable ATR and volume multipliers to fine-tune detection responsiveness.
Signals: Toggle for on-chart bullish (▲) and bearish (▼) signal plotting when price interacts with zones.
Color Customization: User-defined bullish and bearish colors for both standard and breaker zones.
Core Calculations
Zones are detected using pivot highs and lows with a defined lookback and lookahead period.
Additional filters apply if ATR and volume are enabled, requiring conditions like “ATR > average * multiplier” and “Volume > average * multiplier.”
Detected zones are merged if overlapping, keeping the chart clean and logical.
When price breaks through a zone, the original box is closed, and a new breaker zone is plotted automatically.
Bullish and bearish markers appear when zones are retested from the opposite side.
Visualization & Display
Demand zones are shaded in semi-transparent bullish color (default: blue).
Supply zones are shaded in semi-transparent bearish color (default: red).
Breaker zones appear when previous imbalances are broken, helping to spot structural shifts.
Optional arrows (▲ / ▼) indicate potential buy or sell reactions on zone interaction.
Use Cases
Identify institutional areas of accumulation (demand) or distribution (supply).
Detect potential breakout traps and market structure shifts using breaker zones.
Combine with other tools such as volume profile, EMA, or liquidity indicators for deeper confirmation.
Observe retests and reactions of zones to anticipate possible reversals or continuations.
Apply multi-timeframe analysis to align higher timeframe zones with lower timeframe entries.
Limitations & Recommendations
The indicator does not predict future price movement; it highlights structural imbalances only.
Performance depends on chosen swing length and sensitivity—users should optimize parameters for each market.
Works best in volatile markets where supply and demand imbalances are clearly expressed.
Should be used as part of a broader trading framework, not as a standalone signal generator.
Markets & Timeframes
The “Quantura – Supply & Demand Zone Detection” indicator is suitable for all asset classes including cryptocurrencies, Forex, indices, commodities, and equities. It performs reliably across multiple timeframes, from intraday scalping to higher timeframe swing analysis.
Author & Access
Developed 100% by Quantura. Published as a Open-source script indicator. Access is free.
Important
This description complies with TradingView’s Script Publishing and House Rules. It clearly explains the indicator’s originality, underlying logic, functionality, and intended use without unrealistic claims or performance guarantees.

SMC ORB vs Pre-Market SPY/IWMStacks institutional confluences such as Smart Money Concepts, Inner Circle Trading, volatility, and structure.
Plots Premarket high/low and 15 minute Opening range
Plots the first sweep of Premarket high/low and any subsequent orb breaks

SMC ORB vs PM ALPHADesigned to stack institutional confluences such as Smart Money Concepts, Inner Circle Trading, volatility, and market structure.
Plots pre-market high/low and 15 Opening Range.
Plots first sweep of Pre-market high/low as well as orb break/holds.
TP of Previous high/low & SL optional

REJECTION DETECTOR🔥 CTR (Candle Terjepit - Rejection)
This indicator is specifically designed to detect Rejection Candles, which are moments when the price rejects a certain level and has the potential to form a strong reversal or rapid reaction — an important signal for scalpers and price action traders.
💡 Key Concept:
Rejection is a form of market reaction to areas of liquidity, support-resistance, or order block zones. Candles with long tails and small bodies indicate an imbalance between buyers and sellers, providing an early indication that the price may soon reverse.
⚙️ Key Features
🔍 Automatic Rejection Candle Detection (Buy & Sell)
🧠 Body-to-tail ratio filter for more precise signal validation
🎨 Customizable candle colors and appearance
📊 Suitable for all pairs and timeframes

Geometric Price-Time Triangle Calculator═══════════════════════════════════════════════════
GEOMETRIC PRICE-TIME TRIANGLE CALCULATOR
═══════════════════════════════════════════════════
Calculates Point C of a geometric triangle using different rotation angles from any selected price swing. Based on Bradley F. Cowan's Price-Time Vector (PTV) methods from "Four-Dimensional Stock Market Structures and Cycles."
📐 WHAT IT DOES
────────────────────────────────────────────────────
Select two points (A and B) on any swing, choose an angle, and the indicator calculates where Point C would be mathematically. It's just vector rotation applied to price charts.
This shows you where Point C lands in both price AND time based on pure geometry - not a prediction, just a calculation.
🎯 FEATURES
────────────────────────────────────────────────────
✓ 10 Different Angles
• Gann ratios: 18.435° (1x3), 26.565° (1x2), 45° (1x1), 63.435° (2x1), 71.565° (3x1)
• Other angles: 30°, 60°, 90°, 120°, 150°
✓ Visual Triangle
• Adjustable colors and opacity for points A, B, C
• Line styles: Solid, Dashed, Dotted
• Extend lines: None, Left, Right, Both
✓ Crosshair at Point C
• Shows where Point C is located
• Vertical line = bar position
• Horizontal line = price level
✓ Data Table
• Shows all calculations
• Price-to-Bar ratio
• Point C location (price and bars from A/B)
• Toggle on/off
🔧 HOW TO USE
────────────────────────────────────────────────────
1. Pick your swing start date (Point A)
2. Pick your swing end date (Point B) - make sure these dates capture the actual high/low of your swing
3. Choose an angle from the dropdown
4. Look at Point C - that's where the geometry puts it
Different angles = different Point C locations. Whether price actually goes there is up to the market.
📊 THE ANGLES
────────────────────────────────────────────────────
- 18.435° (1x3) - Shallow rotation
- 26.565° (1x2) - Moderate rotation
- 45° (1x1) - Gann's balanced ratio
- 60° - Equilateral triangle (default)
- 63.435° (2x1) - Steeper rotation
- 71.565° (3x1) - Very steep rotation
- 90° - Right angle
- 120°-150° - Obtuse angles
💡 PRACTICAL USE
────────────────────────────────────────────────────
→ See where geometric patterns would complete
→ Test if your market respects certain angles
→ Find where multiple angles converge
→ Compare projected Point C to actual price action
→ Use 90° to see symmetrical price/time relationships
→ Backtest historical swings to see what worked
⚙️ HOW IT WORKS
────────────────────────────────────────────────────
1. Takes your AB swing
2. Calculates the BA vector (reverse direction)
3. Normalizes price and time using Price-to-Bar ratio
4. Rotates the vector by your selected angle
5. Converts back to chart coordinates
Basic trigonometry. That's all it is.
📚 BACKGROUND
────────────────────────────────────────────────────
Based on Bradley F. Cowan's Price-Time Vector (PTV) concept from "Four-Dimensional Stock Market Structures and Cycles" and W.D. Gann's geometric angle analysis. Cowan observed that markets sometimes complete geometric patterns. This tool calculates where those patterns would complete mathematically. Whether price actually respects these geometric relationships is something you need to test yourself.
⚠️ IMPORTANT
────────────────────────────────────────────────────
- This is geometric calculation, not prediction
- Point C shows where the math puts it, not where price will go
- Some angles might work for your market, some won't
- Test it yourself on historical data
- Price-to-Bar Ratio stays constant regardless of angle
- Don't trade based on this alone
- Works on all timeframes and assets
🎨 CUSTOMIZATION
────────────────────────────────────────────────────
- Show/hide triangle
- Individual colors for A, B, C points
- Adjust opacity (0-100)
- Line styles for each triangle side
- Extend lines left/right/both/none
- Show/hide data table
- Crosshair color and width
- Customizable table colors
═══════════════════════════════════════════════════

Higher Timeframe Box & Divider - All Candles [GoldnHunt]The Higher Timeframe Box & Divider – All Candles indicator visually maps higher timeframe candles onto lower timeframe charts.
It highlights the open and close range of each higher timeframe candle as a box, along with a vertical divider marking the start of each new period.
This helps traders clearly see higher timeframe structure and momentum flow without switching charts.
Features:
Draws a box showing only the body (open to close) of each higher timeframe candle.
Uses candle color to represent bullish and bearish momentum.
Adds a divider line for each new higher timeframe candle.
Works across all symbols and timeframes.
Lightweight and optimized for performance.
Use case:
Perfect for traders using multi-timeframe (MTF) analysis who want to visualize higher timeframe candle progression while observing lower timeframe price action.

Opposing Candle V2🟩 OC (Opposing Candle) Multi–Timeframe Framework
🔍 Overview
The OC Indicator automatically detects and displays Opposing Candles (OCs) across up to three timeframes.
An Opposing Candle is a candle that fully engulfs the previous one, signaling a potential shift in control — either a trend continuation or a trend reversal.
This multi–timeframe framework gives traders a structured way to visualize displacement, pullbacks, and momentum shifts between timeframes.
⚙️ How It Works
Each OC is drawn as a box showing:
High & Low → The candle’s full range
Open Line (black) → Key control level
Midline (white) → Candle equilibrium
Optional labels for timeframe and session
You can enable up to 3 timeframes (e.g., 30m / 1H / 4H) and adjust how many OCs to display for each.
📈 Trading Framework
🔹 Continuation Setup (Trend Following)
1. 4H Bias → Bullish or Bearish
Identify clear trend structure (HH/HL = bullish, LH/LL = bearish).
Confirm strong displacement and visible gaps between OCs — signs of momentum and healthy trend continuation.
2. 1H Confirmation OC
OC forms in the direction of the 4H bias, confirming control.
3. 30min Pullback OC
Opposite–colored OC appears → represents the pullback.
4. Entry Trigger
A yellow candle closes beyond the 30min OC open line, confirming the end of the pullback.
→ Enter in trend direction.
🎯 Targets
Target 1: Next 1H OC high or low (in trend direction)
Target 2: Next 4H OC high or low
🛑 Stop: Beyond the 30min OC’s opposite wick
🔹 Reversal Setup (Trend Shift)
1. 4H Structure → Extended or Losing Momentum
When there are no higher–timeframe gaps and no displacement, momentum weakens — often a sign of potential reversal.
2. Opposing OC Forms on HTF
A strong engulfing OC appears against the previous trend at a key structural level.
3. Lower–Timeframe Alignment
1H and 30min OCs begin forming in the new direction, confirming control shift.
4. Entry Trigger
Break of the lower–timeframe OC open line signals the reversal confirmation.
🟢 Example: Bullish Reversal
4H downtrend shows compression (no displacement)
4H bullish OC forms at support
30min breaks above a bearish OC’s open line → Go long
🔴 Example: Bearish Reversal
4H uptrend stalls at resistance
4H bearish OC forms
30min breaks below a bullish OC’s open line → Go short
🎯 Targets
Target 1: Nearest opposing 1H OC high/low
Target 2: Major 4H structural high/low
🛑 Stop: Beyond the reversal OC wick
🧠 Key Concepts
Displacement = Strength. Strong, impulsive moves with clear gaps between OCs show continuation.
Compression = Weakness. Overlapping candles and no HTF displacement often hint at reversal.
OC = Control Candle. The open line is the “line in the sand” — when price breaks it, control flips.
Multi–TF Confluence = Precision. 4H → 1H → 30m gives you structure → confirmation → entry accuracy.
🎨 Features
✅ Multi–Timeframe OC detection (default: 30m / 1H / 4H)
✅ Bullish & Bearish boxes with open and midlines
✅ Break candles highlighted yellow
✅ Optional labels (timeframe + session)
✅ Session filters (Asia, London, NYAM, NYPM)
✅ Fully customizable visuals and extension lengths

Volatility Resonance CandlesVolatility Resonance Candles visualize the dynamic interaction between price acceleration, volatility, and volume energy.
They’re designed to reveal moments when volatility expansion and directional momentum resonate — often preceding strong directional moves or reversals.
🔬 Concept
Traditional candles display direction and range, but they miss the energetic structure of volatility itself.
This indicator introduces a resonance model, where ATR ratio, price acceleration, and volume intensity combine to form a composite signal.
* ATR Resonance: compares short-term vs. long-term volatility
* Acceleration: captures the rate of price change
* Volume Energy: reinforces the move’s significance
When these components align, the candle color “resonates” — brighter, more intense candles signal stronger volatility–momentum coupling.
⚙️ Features
* Adaptive Scaling
Normalizes energy intensity dynamically across a user-defined lookback period, ensuring consistency in changing market conditions.
* Power-Law Transformation
Optional non-linear scaling (gamma) emphasizes higher-energy events while keeping low-intensity noise visually subdued.
* Divergence Mode
When enabled, colors can invert to highlight energy divergence from candle direction (e.g., bearish pressure during bullish closes).
* Customizable Styling
Full control over bullish/bearish base colors, transparency scaling, and threshold sensitivity.
🧠 Interpretation
* Bright / High-Intensity Candles → Strong alignment of volatility and directional energy.
Often signals the resonant phase of a move — acceleration backed by volatility expansion and volume participation.
* Dim / Low-Intensity Candles → Energy dispersion or consolidation.
These typically mark quiet zones, pauses, or inefficient volatility.
* Opposite-Colored Candles (if divergence mode on) → Potential inflection zones or hidden stress in the trend structure.
⚠️ Disclaimer
This script is for educational purposes only.
It does not constitute financial advice, and past performance is not indicative of future results. Always do your own research and test strategies before making trading decisions.


Up vs Down Volume Compared to PriceHi team,
I’ve put together a simple TradingView indicator that breaks down the last N candles into up-moves and down-moves, showing how much volume supported each side. It helps you quickly see whether the market is rallying on strong participation or just drifting higher on weak volume.
The tool tracks total up-volume versus down-volume, compares their ratios, and flags when pullbacks are happening with noticeably lower volume than the prior push up — a setup that often signals a healthy continuation rather than a reversal.
It also shows key metrics like total volume, price change, and up/down ratios directly on the chart for quick assessment. You’ll instantly know if you’re looking at a light-volume pullback or a heavy-volume sell-off.
Let’s test it out across a few symbols and discuss any tweaks we’d like — maybe layering an EMA or VWAP filter for cleaner trend confirmation.
Realtime RenkoI've been working on real-time renko for a while as a coding challenge. The interesting problem here is building renko bricks that form based on incoming tick data rather than waiting for bar closes. Every tick that comes through gets processed immediately, and when price moves enough to complete a brick, that brick closes and a new one opens right then. It's just neat because you can run it and it updates as you'd expect with renko, forming bricks based purely on price movement happening in real time rather than waiting for arbitrary time intervals to pass.
The three brick sizing methods give you flexibility in how you define "enough movement" to form a new brick. Traditional renko uses a fixed price range, so if you set it to 10 ticks, every brick represents exactly 10 ticks of movement. This works well for instruments with stable tick sizes and predictable volatility. ATR-based sizing calculates the average true range once at startup using a weighted average across all historical bars, then divides that by your brick value input. If you want bricks that are one full ATR in size, you'd use a brick value of 1. If you want half-ATR bricks, use 2. This inverted relationship exists because the calculation is ATR divided by your input, which lets you work with multiples and fractions intuitively. Percentage-based sizing makes each brick a fixed percentage move from the previous brick's close, which automatically scales with price level and works well for instruments that move proportionally rather than in absolute tick increments.
The best part about this implementation is how it uses varip for state management. When you first load the indicator, there's no history at all. Everything starts fresh from the moment you add it to your chart because varip variables only exist in real-time. This means you're watching actual renko bricks form from real tick data as it arrives. The indicator builds its own internal history as it runs, storing up to 250 completed bricks in memory, but that history only exists for the current session. Refresh the page or reload the indicator and it starts over from scratch.
The visual implementation uses boxes for brick bodies and lines for wicks, drawn at offset bar indices to create the appearance of a continuous renko chart in the indicator pane. Each brick occupies two bar index positions horizontally, which spaces them out and makes the chart readable. The current brick updates in real time as new ticks arrive, with its high, low, and close values adjusting continuously until it reaches the threshold to close and become finalized. Once a brick closes, it gets pushed into the history array and a new brick opens at the closing level of the previous one.
What makes this especially useful for debugging and analysis are the hover tooltips on each brick. Clicking on any brick brings up information showing when it opened with millisecond precision, how long it took to form from open to close, its internal bar index within the renko sequence, and the brick size being used. That time delta measurement is particularly valuable because it reveals the pace of price movement. A brick that forms in five seconds indicates very different market conditions than one that takes three minutes, even though both bricks represent the same amount of price movement. You can spot acceleration and deceleration in trend development by watching how quickly consecutive bricks form.
The pine logs that generate when bricks close serve as breadcrumbs back to the main chart. Every time a brick finalizes, the indicator writes a log entry with the same information shown in the tooltip. You can click that log entry and TradingView jumps your main chart to the exact timestamp when that brick closed. This lets you correlate renko brick formation with what was happening on the time-based chart, which is critical for understanding context. A brick that closed during a major news announcement or at a key support level tells a different story than one that closed during quiet drift, and the logs make it trivial to investigate those situations.
The internal bar indexing system maintains a separate count from the chart's bar_index, giving each renko brick its own sequential number starting from when the indicator begins running. This makes it easy to reference specific bricks in your analysis or when discussing patterns with others. The internal index increments only when a brick closes, so it's a pure measure of how many bricks have formed regardless of how much chart time has passed. You can match these indices between the visual bricks and the log entries, which helps when you're trying to track down the details of a specific brick that caught your attention.
Brick overshoot handling ensures that when price blows through the threshold level instead of just barely touching it, the brick closes at the threshold and the excess movement carries over to the next brick. This prevents gaps in the renko sequence and maintains the integrity of the brick sizing. If price shoots up through your bullish threshold and keeps going, the current brick closes at exactly the threshold level and the new brick opens there with the overshoot already baked into its initial high. Without this logic, you'd get renko bricks with irregular sizes whenever price moved aggressively, which would undermine the whole point of using fixed-range bricks.
The timezone setting lets you adjust timestamps to your local time or whatever reference you prefer, which matters when you're analyzing logs or comparing brick formation times across different sessions. The time delta formatter converts raw milliseconds into human-readable strings showing days, hours, minutes, and seconds with fractional precision. This makes it immediately clear whether a brick took 12.3 seconds or 2 minutes and 15 seconds to form, without having to parse millisecond values mentally.
This is the script version that will eventually be integrated into my real-time candles library. The library version had an issue with tooltips not displaying correctly, which this implementation fixes by using a different approach to label creation and positioning. Running it as a standalone indicator also gives you more control over the visual settings and makes it easier to experiment with different brick sizing methods without affecting other tools that might be using the library version.
What this really demonstrates is that real-time indicators in Pine Script require thinking about state management and tick processing differently than historical indicators. Most indicator code assumes bars are immutable once closed, so you can reference `close ` and know that value will never change. Real-time renko throws that assumption out because the current brick is constantly mutating with every tick until it closes. Using varip for state variables and carefully tracking what belongs to finalized bricks versus the developing brick makes it possible to maintain consistency while still updating smoothly in real-time. The fact that there's no historical reconstruction and everything starts fresh when you load it is actually a feature, not a limitation, because you're seeing genuine real-time brick formation rather than some approximation of what might have happened in the past.

Smart Inside Bar Zones by Dinkan🔹 How It Works
An Inside Bar is formed when a candle’s high and low are completely within the previous candle’s range.
The indicator detects this structure in real time, creates a visual box around it, and extends the zone until the pattern is broken.
Inside Bar candles can be optionally highlighted with a custom color to make them stand out clearly on the chart.
🔹 Features
✅ Automatic Inside Bar detection
✅ Dynamic Inside Bar zone boxes with custom fill & border color
✅ Inside candle body highlighting with user-defined color
✅ Adjustable transparency and border style
✅ Option to display only the latest Inside Bar zone for cleaner charts
🔹 Usage
Traders can use Inside Bar zones to:
Study price compression and breakout regions
Observe range behavior and trend continuation setups
Combine with other tools like volume or support/resistance analysis
🔹 Customization
Change box fill and border color
Adjust Inside Candle color for better visibility
Set transparency and choose whether to show all or only the latest box
⚠️ Disclaimer
This script is intended for market structure visualization and educational purposes only.
It does not generate trading signals or financial advice.
Always perform your own analysis and risk management before making trading decisions.

Previous Candle 50% line The intention of this is to mark the 50% mark of the previous candle. My use is to set stops and to spot reversals coming from the STRAT to see in real time 2's going 3

3D Candles (Zeiierman)█ Overview
3D Candles (Zeiierman) is a unique 3D take on classic candlesticks, offering a fresh, high-clarity way to visualize price action directly on your chart. Visualizing price in alternative ways can help traders interpret the same data differently and potentially gain a new perspective.
█ How It Works
⚪ 3D Body Construction
For each bar, the script computes the candle body (open/close bounds), then projects a top face offset by a depth amount. The depth is proportional to that candle’s high–low range, so it looks consistent across symbols with different prices/precisions.
rng = math.max(1e-10, high - low ) // candle range
depthMag = rng * depthPct * factorMag // % of range, shaped by tilt amount
depth = depthMag * factorSign // direction from dev (up/down)
depthPct → how “thick” the 3D effect is, as a % of each candle’s own range.
factorMag → scales the effect based on your tilt input (dev), with a smooth curve so small tilts still show.
factorSign → applies the direction of the tilt (up or down).
⚪ Tilt & Perspective
Tilt is controlled by dev and translated into a gentle perspective factor:
slope = (4.0 * math.abs(dev)) / width
factorMag = math.pow(math.min(1.0, slope), 0.5) // sqrt softens response
factorSign = dev == 0 ? 0.0 : math.sign(dev) // direction (up/down)
Larger dev → stronger 3D presence (up to a cap).
The square-root curve makes small dev values noticeable without overdoing it.
█ How to Use
Traders can use 3D Candles just like regular candlesticks. The difference is the 3D visualization, which can broaden your view and help you notice price behavior from a fresh perspective.
⚪ Quick setup (dual-view):
Split your TradingView layout into two synchronized charts.
Right pane: keep your standard candlestick or bar chart for live execution.
Left pane: add 3D Candles (Zeiierman) to compare the same symbol/timeframe.
Observe differences: the 3D rendering can make expansion/contraction and body emphasis easier to spot at a glance.
█ Go Full 3D
Take the experience further by pairing 3D Candles (Zeiierman) with Volume Profile 3D (Zeiierman) , a perfect complement that shows where activity is concentrated, while your 3D candles show how the price unfolded.
█ Settings
Candles — How many 3D candles to draw. Higher values draw more shapes and may impact performance on slower machines.
Block Width (bars) — Visual thickness of each 3D candle along the x-axis. Larger values look chunkier but can overlap more.
Up/Down — Controls the tilt and strength of the 3D top face.
3D depth (% of range) — Thickness of the 3D effect as a percentage of each candle’s own high–low range. Larger values exaggerate the depth.
-----------------
Disclaimer
The content provided in my scripts, indicators, ideas, algorithms, and systems is for educational and informational purposes only. It does not constitute financial advice, investment recommendations, or a solicitation to buy or sell any financial instruments. I will not accept liability for any loss or damage, including without limitation any loss of profit, which may arise directly or indirectly from the use of or reliance on such information.
All investments involve risk, and the past performance of a security, industry, sector, market, financial product, trading strategy, backtest, or individual's trading does not guarantee future results or returns. Investors are fully responsible for any investment decisions they make. Such decisions should be based solely on an evaluation of their financial circumstances, investment objectives, risk tolerance, and liquidity needs.

ICT Levels Breach Scanner (12M Timeframe)Detects and scans for breaches of key Inner Circle Trader (ICT) concepts on the yearly (12M) chart: Swing Lows (3-bar wick pivots), Rejection Blocks (3-bar body pivots), Fair Value Gaps (3-bar inefficiencies), and Volume Imbalances (bullish body gaps ≥0.15%, unmitigated).
Features:
Tracks active levels with arrays for real-time breach detection (price low below any level triggers alert).
Visuals: Blue solid lines (Swing Lows), orange dashed (Rejection Blocks), purple dotted (FVGs), green boxes (VIs)—all extending right.
Red triangle + bgcolor alert on breach bar; built-in alertcondition for notifications.
Optimized for Pine Screener: Filter stocks (e.g., US exchanges) showing symbols where price has traded below these levels on the latest 12M bar.
Usage: Apply to a 12M chart for viz, or add to Screener > Pine tab for multi-symbol scans. Customize gap % or add bearish variants via inputs. Ideal for spotting potential support in long-term trends.
ICT-inspired; test on liquid stocks like AAPL/TSLA. Not financial advice.

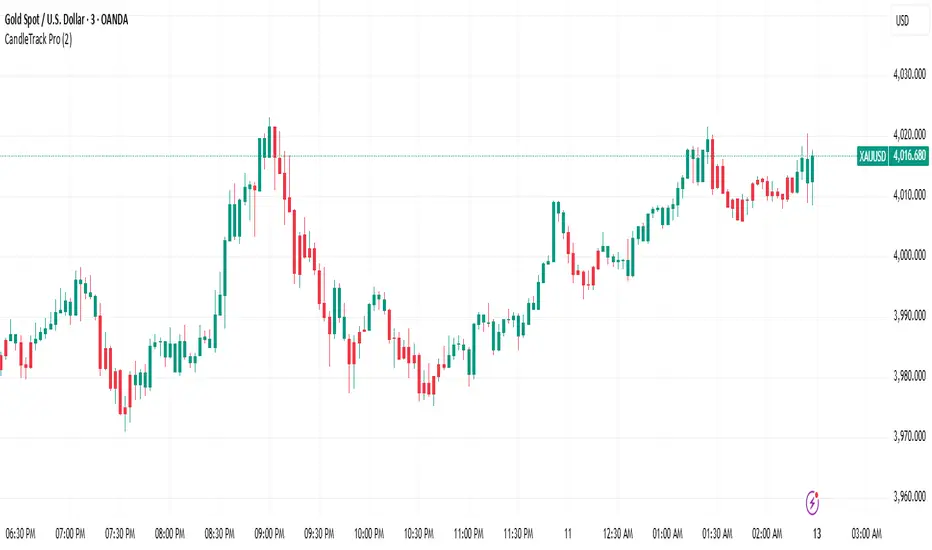
CandleTrack Pro | Pure Price Action Trend Detection📖 CandleTrack Pro | Pure Price Action Trend Detection
CandleTrack Pro is a clean, non-repainting trend detection tool built purely on price action logic.
It uses a dynamic ATR-based trailing system to detect trend shifts while keeping the chart visually simple.
🧠 How It Works
Tracks volatility using ATR.
Identifies trend shifts when price crosses trailing stops.
Highlights bullish and bearish bars visually for easy reading.
⚙️ Inputs
ATR Sensitivity: Controls how fast the trend adapts.
Use High/Low for Stop: Enables candle wick–based structure tracking.
📊 Ideal For
Traders who want a minimalist price action view with clear trend direction — no clutter, no lagging oscillators.
⚠️ Disclaimer
This script is for educational and technical analysis purposes only.
It is not financial advice. Always confirm setups using your own judgment and risk management.
TLM HTF CandlesTLM HTF Candles
Higher timeframe candles displayed on your current chart, optimized for The Lab Model (TLM) trading methodology.
What It Does
Plots up to 6 HTF candles side-by-side on the right of your chart with automatic swing detection, expansion bias coloring, and a quick-reference info table. Watch multiple timeframes at once without switching charts.
Swing Detection - Solid lines for confirmed swings, dashed for potential swings. Detects when HTF levels get swept and rejected.
Expansion Bias - Candles colored green (bullish), red (bearish), or orange (conflicted) based on 3-candle patterns showing expected price expansion.
HTF Info Table - Compact dashboard showing time to close, active swings, and expansion direction for all timeframes. Toggle dark/light mode.
Equilibrium Lines - 50% midpoint from previous candle to current, great for mean reversion targets.
Based on "ICT HTF Candles" by @fadizeidan -
Heavily customized with swing analysis, expansion patterns, and info table for TLM trading concepts.

Trend CandlesThis shows candlesticks that only follow the trend. So it will make it easier to know where the trend is going.
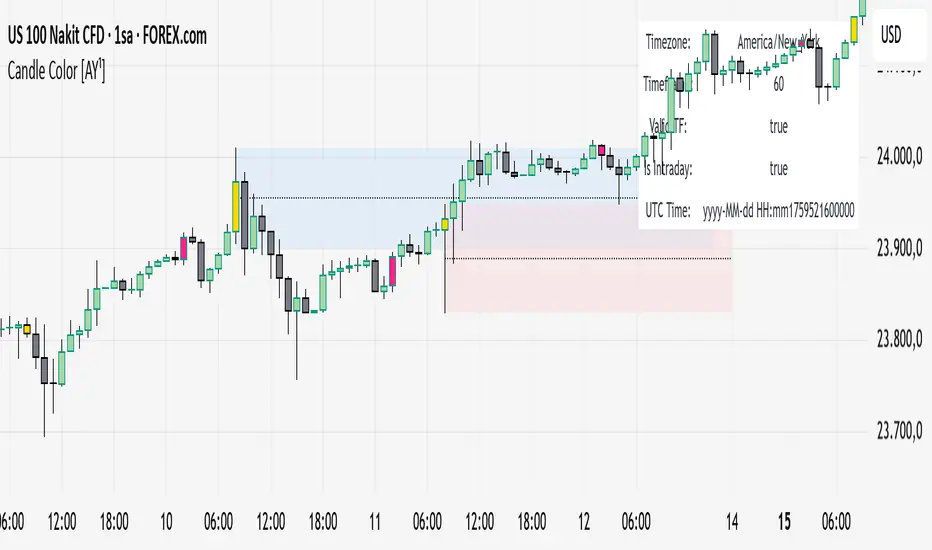
Candle Color [AY¹]Visually highlight specific time periods with custom colors on intraday charts.
Ideal for session-based traders who want to emphasize New York, London or any custom trading hours. Developed by AY¹
Candle Color Highlighter
A simple yet powerful intraday visualization tool that colors candles or chart background during your chosen trading sessions.
Perfect for traders who rely on time-based confluences — such as ICT, SMC, or session scalping frameworks.
🔧 Key Features
✅ Highlight up to four custom time periods (e.g. London Open, NY Open, Lunch Hour, etc.)
✅ Supports multiple highlight styles:
• Bar Color only
• Background only
• Both
✅ Full timezone control (Exchange, UTC, New York, London, Tokyo, or custom UTC+3)
✅ Works on all intraday timeframes or only those you select (1m–4h).
✅ Optional labels marking session starts.
✅ Integrated alerts when any period becomes active.
✅ Informative status table showing timezone, timeframe, and active period.
🕒 Use Cases
Highlight New York Killzone (07:30–09:30) or London Open (02:00–03:00)
Separate different liquidity windows
Emphasize your backtest periods
Combine with volume, displacement, or structure indicators for time-based confluence setups
🎨 Customization
Each of the four configurable periods allows you to choose:
Start/End time
Custom color and transparency
Session label visibility
Highlight style preference
💡 Example Setup
Period Session Time Color Notes
Period 1 02:00–03:00 Magenta London Killzone
Period 2 07:30–08:30 Yellow NY Pre-market
Period 3 08:30–09:30 Blue NY Open
Period 4 09:30–10:00 Green Initial Balance
Candle Open-Close DifferenceThis script gives you the different price/points for each candle open and close.

Actually Engulfing CandlesticksThis thing attempts to find price reversals with actually engulfing candlesticks with volume spikes and RSI values as confirmation. It works well on mean reverting assets I guess.
Green dots below bars = bullish reversal
Fuchsia dots above bars = bearish reversal
Have fun!
