Candlestick-Analysen

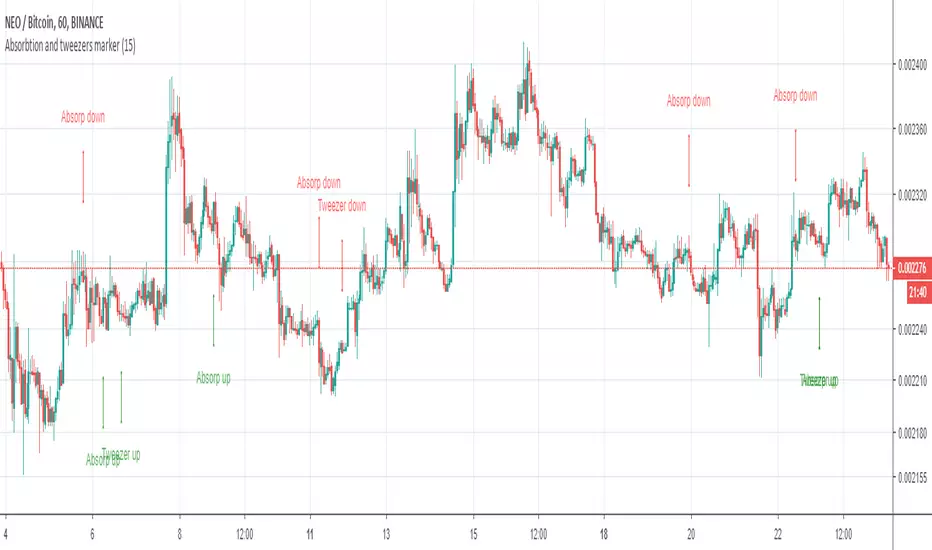
Doji & hammers markerDoji & hammers marker marks:
- long/ short doji star ( marks as doji star )
- doji grave
- doji dragonfly
- hammer
- falling star
- hanging man
- reversed hammer
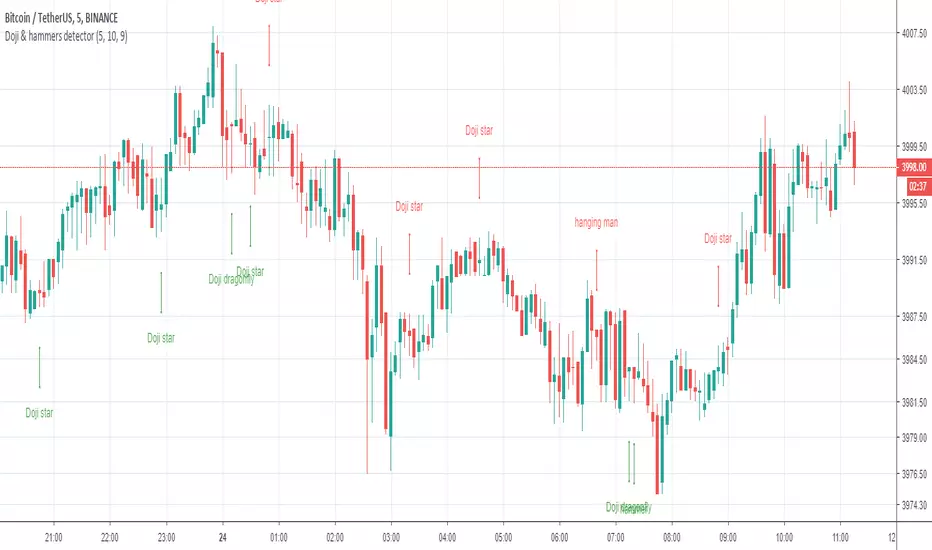
Doji detectorDoji detector marks doji candles.
Can find:
- short / long Doji star ( marks as Doji star )
- Doji grave
- Doji dragonfly

Combined MTF Camarilla Pivots (HA + Candles)This is a fairly basic (but hopefully useful) indicator that combines three time-frames of Camarilla pivots into one.
Default time-frames are:
Weekly
Monthly
Yearly
Time-frames can be modified as you wish, they are just set to these as I generally only trade higher intervals (just note that formatting labels will not change - but you can update these as needed).
The Camarilla pivots displayed are as follows:
R3, R4, R5, R6
Pivot line (Middle/Base)
S3, S4, S5, S6
R1/S1 & R2/S2 are excluded to make way for R5/S5 & R6/S6 - as these are more useful for the majority of traders. The formula for levels 5/6 are always up for debate, as no official formula has ever been released. I've used what I consider a mid, or consensus calculation.
By default all historical pivot levels are displayed, as there can be some benefit to mapping these forward once the relevant period has ended. If people find it's too cluttered I'll look into having an option to display the current period only.
Unfortunately, TradingView doesn't allow labels on plots (seems like such a basic feature to be missing, but there you go), so you'll have to learn the colours/linewidths.
Oh, and there's a checkbox to enable pivots to be calculated on Heiken-Ashi prices/candles rather than default prices/candles. This heavily modifies the location of the Camarilla Pivots, but I've found that in certain situations you can get some great results.
Let me know your thoughts/comments/suggestions.
Cheers
DD

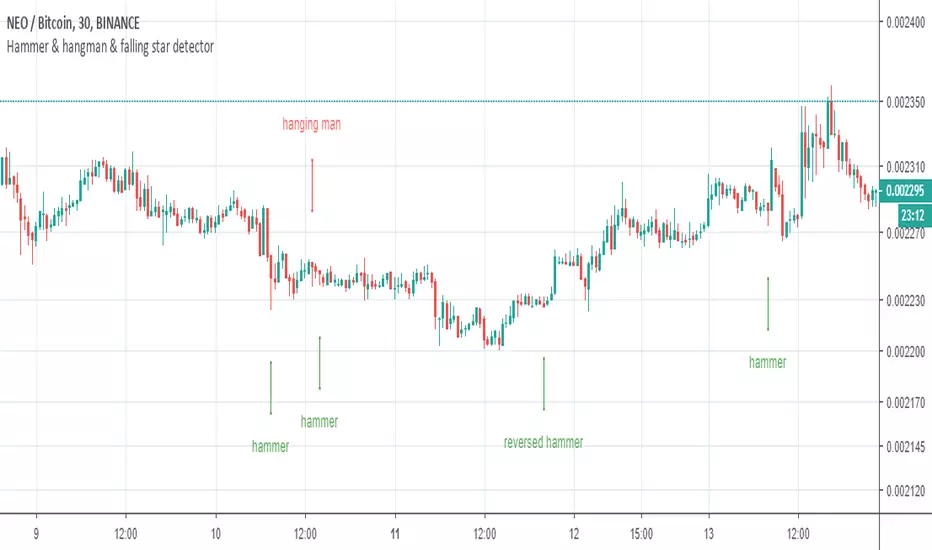
Hammer and Hanging Man candlesticks detectorSimple script to detect and mark possible reversal candlesticks - "hammer" and reversed version "hanging man".
hammer:
en.wikipedia.org(candlestick_pattern)
hanging man:
en.wikipedia.org(candlestick_pattern)
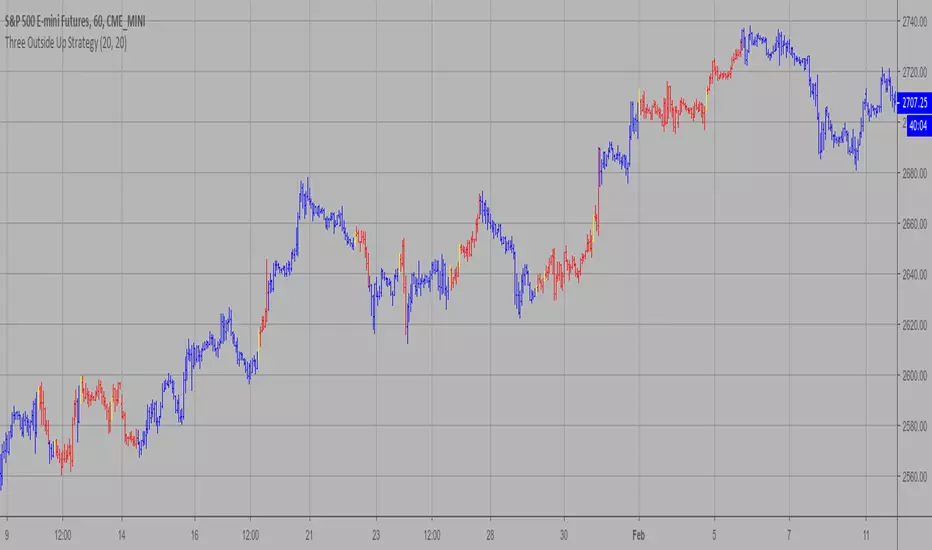
Three Outside Up Strategy This is a three candlestick bullish reversal pattern consisting of a bullish
engulfing pattern formed by the first two candlesticks then followed by an up
candlestick with a higher close than the prior candlestick.
WARNING:
- This script to change bars colors.

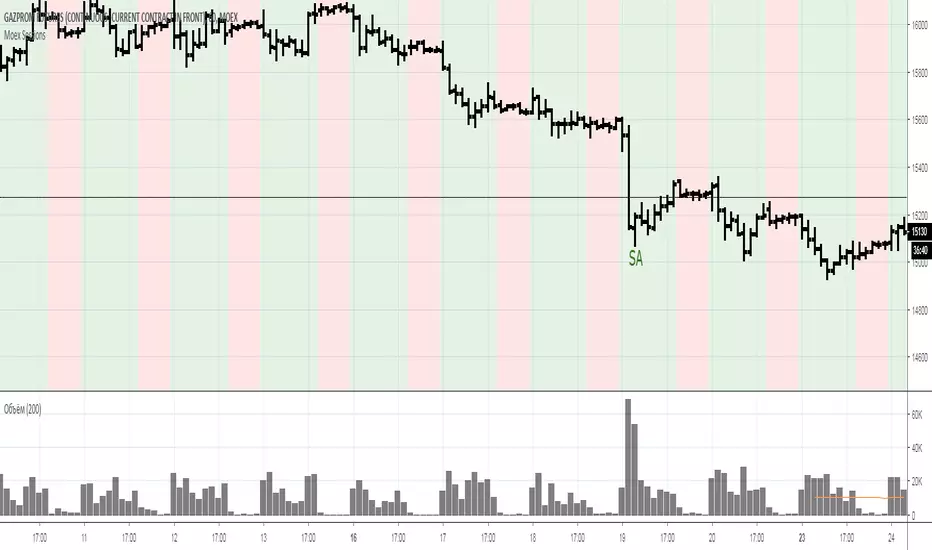
Volume/$ - Color Trend BarsThis is the volume script I use on all my charts. The idea is to emphasize trend bars with green and red.
Highish volume doji bars are colored yellow to point out range compression churn areas which can often be the turning point of a trend.

Range: OHLC vs Previous OHLCThis will plot your choice of OHLC (or any of the averaging choices) of the current candle compared to the previous candle.
For example if you choose "high" for the input and set the chart to daily, you'll see the currently daily high vs the previous daily high.
Green candle represent a higher high and the length of the candle represents how much higher.
Red candles represent a lower high than the previous day and the length is by how much lower.
This indicator is pretty straight forward, look for me to build on this with something a little more elaborate in the near future.


Up Down Alerts with MA Control - v2.0this update is meant for use with regular candles, but it will mimic the color pattern of heikin ashi candles and allow alerts based on the heikin ashi patterns. Also there are alerts for when the price is above a set moving average.
was going to just update the original script but there are a lot of changes to make it smoother etc, original script:
Three Outside Down Strategy This is a three candlestick bearish reversal pattern consisting of a bearish
engulfing pattern formed by the first two candlesticks then followed by a down
candlestick with a lower close than the prior candlestick.
WARNING:
- This script to change bars colors.

3 BAR ENGULFING SETUPScript that highlights bullish and bearish engulfing candles after two candles in the opposite direction.

Security() Correction - Realtime vs. Historical BarsProblem
Pine's implementation of the security() function behaves differently in realtime vs. historical bars. Specifically, for historical bars, calling security() for a time frame (TF) larger/slower than the current chart's TF will return information about the last completed bar of the higher TF. However, for realtime bars (i.e. if you allow the chart to continue to plot in realtime), security() returns information about the presently in-progress bar of the higher TF. Clearly, this leads to discontinuity that is arbitrarily dependent upon when the user last loaded or refreshed the chart.
Solution
Fortunately, after understanding the problem, solving it is trivial: use security() normally for historical bars, but switch to explicitly requesting prior candle bars once the indicator is operating on realtime bars. I leave the source open here for any to use as they see fit. For testing, I include an input to allow switching back and forth between standard and corrected behavior.
Figure 1 displays the standard behavior we see in security() calls, and Figure 2 displays the behavior after my correction:
Figure 1: Typical security() behavior in Pine
Figure 2: Corrected security() behavior, forcing historical and realtime bars to refer to the same higher TF bar offset.
I publish this mostly as a reminder to myself, so I will not forget and then have to figure it out again next time it comes up in my scripting.
V21: Initial release.

HTF High/LowThis simple script draws the previous higher timeframe candle high/low to your chart.
You can also make the script paint the zone between the low/open and the high/close.

BH - Candlestick Pattern DetectionThis is a script to help the beginners locate the candle patterns. It has a nice code that can be used in other scripts too. Easy to use with separated functions, simple patterns and complex patterns detections.
I have done some updates at the Candlestick Patterns Identified script by @repo32. Was a good start of my ideia. Tks for sharing repo.
It will be always under constant development but I want to share this first version to know what can be done to get better, improve, get more desired patterns, know what are you guys using that could be helpful.
I still need to check if all patterns are correct.
Any comments, help and suggestions will be appreciated.
Marcos Issler @ Isslerman

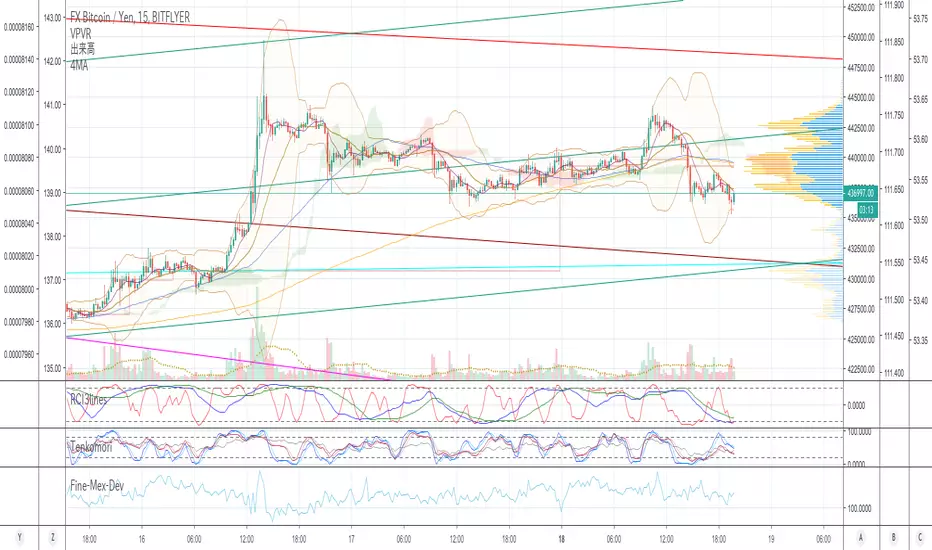
prior Price v2.8限界運動量インジケータのテスト投稿。
・前日高値(赤ライン)
・前日安値(緑ライン)
・先週終値(白ドット、大きさ3)
・当日始値(白ドット、大きさ1)
・限界運動量:Limit
・限界運動量:HighLimit(紫ライン)
・限界運動量:LowLimit(紫ライン)
限界運動量は20日平均で取得していますが、日数はユーザーの設定で調整できます。
入力タブ、スタイルともにチェックがついてないと表示されないので、注意してください。

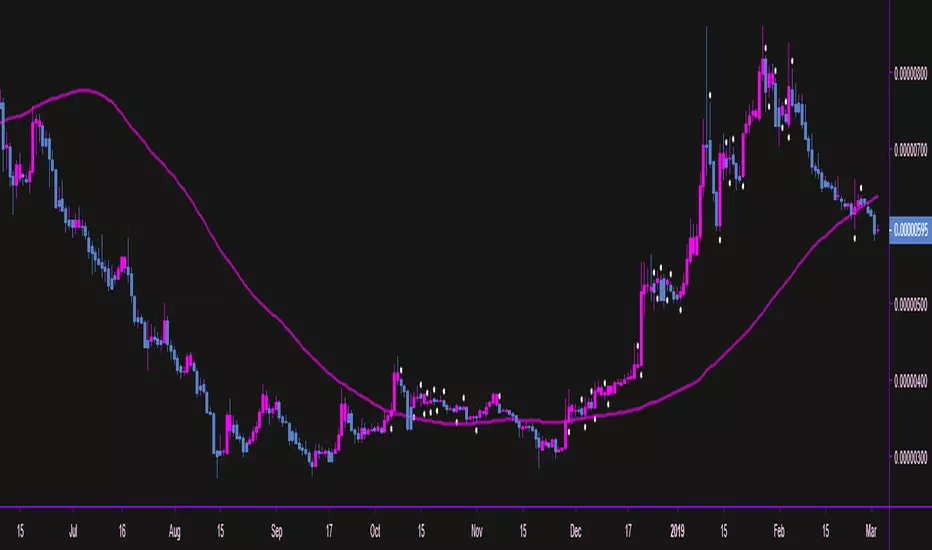
Binance TRX & BTTShows TRX with BTT, subtracted or added to. Subtracting makes it in line with BitMEX futures. The option to add is considered for 'true value'. Airdrops, like new coin forks, can split value: a good example being BCHABC and BCHSV.
Getting TRX futures to match TRX on Binance is likely tied to the monthly airdrop rate as defined here: support.binance.com
I'm guessing it has something to do with (spot price * estimated airdrop rate) trading too far from futures. Maybe even too close. Or because futures are trading above spot near a monthly airdrop snapshot. Much complicate. Such guess. Wow.
Binance is chosen as pricing source for its liquidity and earliest open date.
