Strategy TemplateTrying to include few basic things which is needed for strategy which can be used as template.
Few important components
Strategy parameters
Few important parameters include - initial_capital, default_qty_type, default_qty_value, commission_type, pyramiding and commission_value. All my strategies will have similar settings with initial captial set to 20000 to 100000. 100% of equity per trade with no pyramiding (set to 1) and minimal commission.
margin_long and margin_short can be used for leveraged trading. But, since we are not using pyramiding, it will make no effect.
Trade Limiting parameters
Two types of limiting is available in the scripts
Limiting trading direction : this is done through method strategy.risk.allow_entry_in and input parameter tradeDirection
Limiting trades to particular time window : This is achieved through adding start time and end time parameters of type input.time and check whether time is within this window
Custom Methods
customized security method to get higher timeframe data
customized moving average method to get moving average of any type
Custom Parameters
Moving average Type option list which I use quite often. Any strategy where there is need to use moving average, I try to scan through different moving average types and lengths to see which one is more appropriate for the given strategy. Hence, keeping this parameter in template to make it readily available when I start with new strategy
waitForCloseBeforeExit - this is used if trailing stop need to activated as soon as price hits the stop or only on close price. This is again something I switch quite often based on strategy. Hence, keeping this as part of the template.
Entry and Exit statements for long and short
These statements from line (57 to 62) can remain as is even with new strategy. Only thing to be set are variables - buyCondition, sellCondition, closeBuyCondition and closeSellCondition
Last but not the least
In pinescript, a long and short position cannot coexist in a strategy at any point of time. Any short positions created will automatically stop long positions and vice versa. Hence, it is important make short and long trades mutually exclusive. In this example, I have used 200 weekly moving average as trend bias. No short positions are taken when price is trading above 200 weekly moving average low/close and no long positions are taken when price is less than 200 weekly moving average high/close. Any rule built on top of this (In this case a simple supertrend rules) ensures that there are no conflicting signals and hence avoids confusing trades on the stratgy.
Average True Range (ATR)

Relative ATR by Alejandro PThis is an indicator that expands the usability of ATR into a strong and valuable volatility indicator.
With the Relative ATR you can quickly see when the current market volatility its extremely low, normal or extremely high in relation to the past.
This provides traders with a much more valuable insight as to the current market conditions than normal volatility indicators.
A trader can, for example, decide to filter its strategy to only periods where the ATR is in its lowest percentiles which tells him that the market is unusually "quiet" recently and there may be a big breakout about to happen.
Or a trader can use the filter to avoid getting whipsawed with their strategy by avoiding taking trades when the Relative ATR is at its highest percentiles.

ATR Mark Up/DownThis script looks for a period with increased volatility, as measured by ATR (Average True Range), then it looks for a high or a low in that area.
When price is above EMA (200 is default, can be changed), it looks for the highs and adds multiples of ATR to the high. Default values for multipliers are 3,9 and 27, meaning that the script will show 3xATR level above the high, 9xATR above the high and 27xATR above the high.
When price is below EMA it looks for the lows and subtracts multiples of ATR from the low.The script will show 3xATR level below the low, 9xATR below the low and 27xATR below the low.
Multipliers values can be changed as well, making it a versatile tool that shows potential levels of suppport/resistance based on the volatility.
Possible use cases:
Breakout trading, when price crosses a certain level, it may show potential profit targets for trades opened at a breakout.
Stoploss helper. Many traders use ATR for their stoplosses, 1 ATR below the swing low for long trades and 1 ATR above the swing high for short trades are common values used by many traders. In this case, the Lookback value comes handy, if we want to look maybe at a more recent value for swing high/low point.
The levels shown by this indicator are not guaranteed to be or not to be reached by price, these levels should be used in confluence with other indicators and looked at as a visual helper.
That's all, hope you enjoy it!
PS.
*It does not plot the ATR. I don't know how to do it and IF it can be done
** It does not plot the EMA. If necessary,it can be added in a future update
Strategic Trend By TrendciHoca
Hello everyone, this indicator, which is similar to the Most indicator, which is one of the most used indicators in the market, also has the following features.
1. BB and BS point: HMA 200 bar was used for BB point. The same applies to BS. When the last closing price crosses HMA200 up, BB signals, and when it crosses down, BS signal comes.
2. GO and ATTENTION point : Attention signal should be used when the trend is long and profit can be taken at this point if desired. The Go signal should be used when the trend is short and profit can be taken at this point if desired. EMA and ATR were used to calculate these points.
All signal alarms come embedded in the indicator.

tr_volThis indicator shows the annualized volatility, computed using the ewma method. It also uses average true range (ATR) as the daily return, rather than the typical close-to-close percentage change. You can uncomment the "comparison" series to see how it compares to the standard deviation, daily log return method. The standard deviation method weights all periods equally and doesn't account for intra-day ranges, meaning it is less responsive to new information than the ewma method and doesn't weight large intra-day moves as heavily.
The long-run median is also displayed. This feature sometimes fails if there are too many bars.

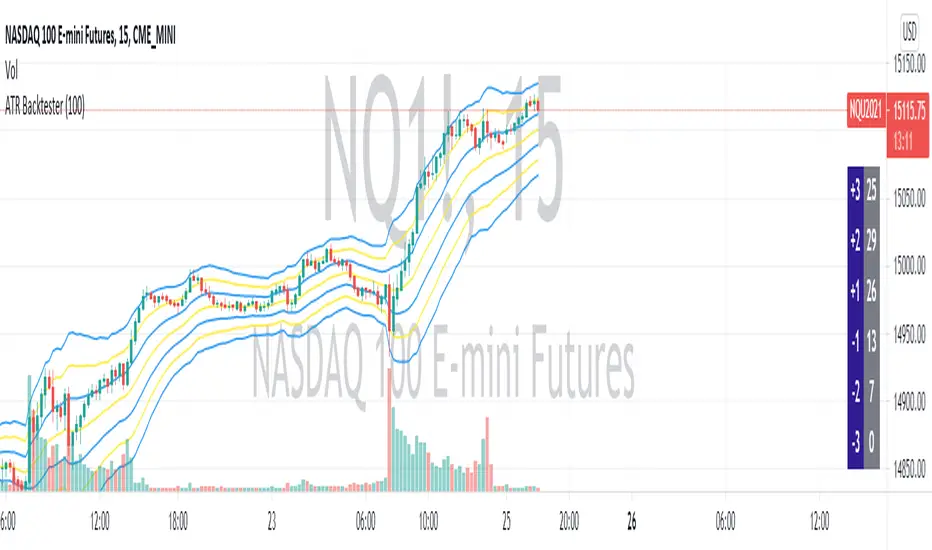
ATR BacktesterATR backtester... input the desired number of bars backwards (I'd recommend 100 or so), and then it'll spit out in the columns on the right side of the screen how many times each ATR was hit. Helps to tell at a glance where bullish and bearish is for the stock. May not be insanely useful since you can just look at the chart, but feel free to use the code yourself for something.
ZigZag SupertrendBack to my favourite supertrend. But, this time on the basis of zigzag pivots.
This is similar to forming supertrend based on pivot high lows - but instead of using pivot poitns, we are using zigzag pivots here.
Zigzag is derived using the same method as this script:
But, have removed labels and display options of zigzag. Older lines are also immediately deleted so that it can work well in lower timeframes without any error. Number of zigzaglines to be kept in memory depends on the parameter History
WaitForConfirmation option when selected only considers the confirmed zigzaglines and will ignore present zigzag line which is forming. This is not going to make much difference as the present zigzag line will be always opposite to low or high it formed and hence will not affect the stop loss levels or reversals.
WaitForClose is for supertrend determination. When checked uses close prices. If unchecked uses highs and lows for supertrend direction update.
ATR parameters allow you to set an adjustment below pivot high lows. This is required because support and resistence are often zones rather than single point. Hence, adds bit more wiggle room for trend continuation and delays frequent reversals on pullbacks.

SD - Average True Range v5 - DoubleSD - Average True Range - Daily Weekly Monthly Yearly v5
It gives ATR intervals as 4 hours, daily, weekly, monthly and yearly. The expectation is to fill the ATR targets within the specified ranges. It can be used to determine target points on charts with a clear direction on the train.
Unlike the previous version, it is provided to use 2 different periods in the same indicator.
Note: Developed based on the source codes of the original SD ADR indicator.

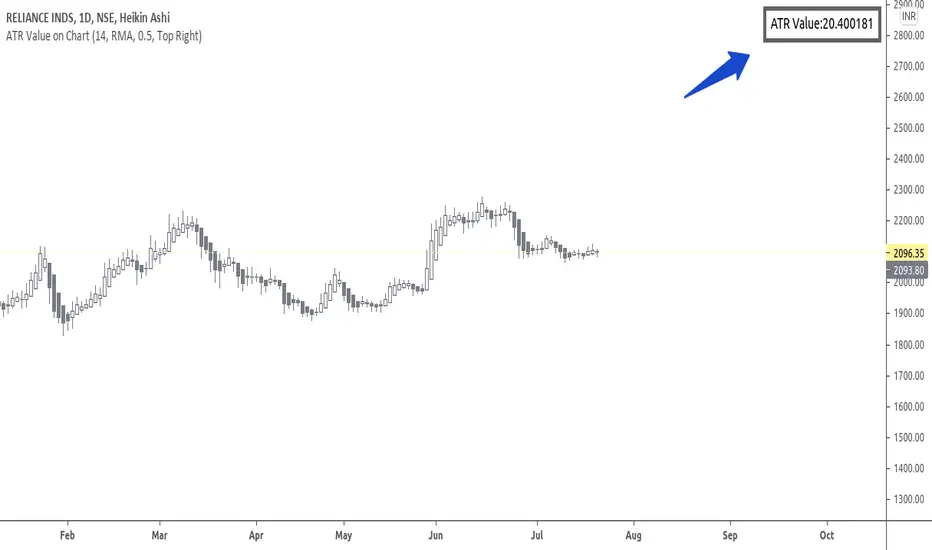
ATR Value on ChartHi Friends & TradingView community.
Greetings to you.
Many traders use ATR to set Stop loss.
The built in ATR indicator plots the ATR values as a line. However, many traders do not want the ATR to be plotted on their charts, but are only interested in the ATR value as such.
This script does that - it just prints the latest ATR with your set Multiplier value on the chart. I have used the built-in ATR indicator and made necessary additions to the code.
I hope this script proves useful to traders.
Queries / feedback welcome.
All the best.
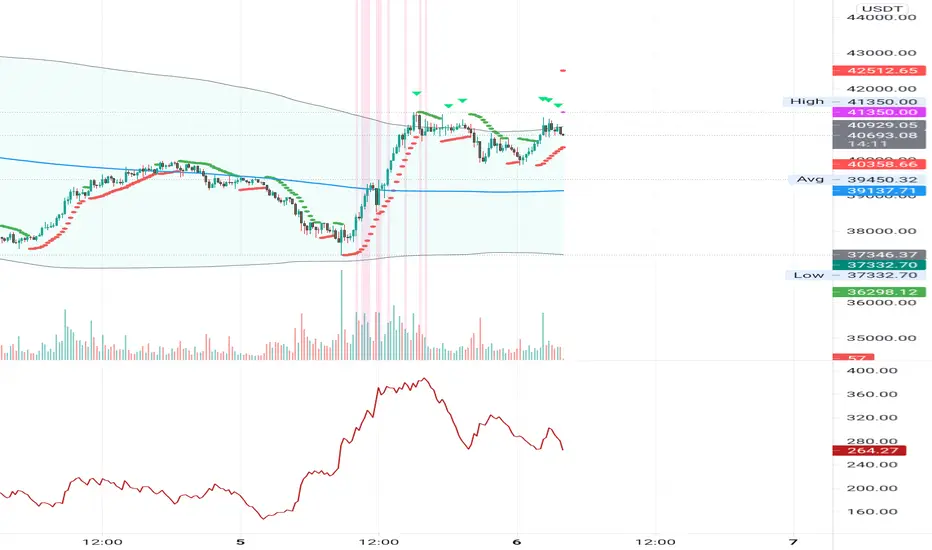
Kifier's MFI/STOCH Hidden Divergence/Trend BeaterMFI/STOCH Hidden Divergence/Trend Beater
General Idea:
My premise around this strategy was to make a general strategy for crypto that would help out with finding entry positions for when you’re bullish on a crypto and want to hold on for a while, and at the same time avoiding massive drops. Essentially a way to mix long term/ swing trading; I somewhat achieved my goal however it still requires a lot of logic tuning of the trend averages.
I’m a huge proponent of volume indicators and coupled with average closing price, I think this gives a really good idea of what is happening with the market. It gives an idea on the market and retail investor sentiment. This generally gives you logical entry positions (Although I don’t know how amazing that will work with all cryptos, there’s a fine line between a good strategy and one that just rides bubble market conditions, some would argue that’s still a success and others not)
How it works:
There are many components to the strategy that try to do different things:
First of all there are two types of entries, a MFI hidden divergence with a STOCH check, essentially it will only fire when a divergence is detected while STOCH is above 50%, however this might be changed in the future as due to the volatile nature of cryptos, the STOCH is not too effective. The second entry is a simple MFI/STOCH trend, if STOCH is above 50% and the trend is detected to be in a trending long, once a MFI crossover over the 50% line is detected an entry is placed, this is designed to get out profit where the divergence would otherwise be less accurate during strongly trending conditions.
-MFI is a great indicator, as a volume weighted momentum indicator I find it the most accurate of all, the STOCH however is a great indicator to get a general picture of simple market conditions and can filter out the emotional noise of retail investors.
-VWMA and an SMA (The bottom oscillator) gives an idea of the trend tacking into account of the volume, this serves as a more short term filter of the trend for filters.
-OBV checks are done between the OBV and an EMA of the OBV, to get the idea of a volume weighted long trend, which is important for crypto as there are massive rallies to go up due to retail greed, it’s great to jump onto it at the beginning, and get off before the stack of cards fall apart.
-ATR is used to detect when the market is relatively just ranging or moving sideways, which is where the hidden divergence entries are done, during predictable and profitable market conditions.
- Stop loss is based on the closest support of the entry, this is a nice medium of room to breath but also an actual stop loss.
Future plans and improvements:
Currently there’s a lot I want to improve, mostly the divergence detection and the overall sharpe ratio could be much better, but the current value of 0.5 gives me hope that the strategy is onto something. I also want to change TP from a percentage stop to something more dynamic but that might be too optimistic. The current plan is to paper trade test this either by manual or by a python bot, to see how it performs with some user input as well.

Volatility semaphore Support&Resistance multi timeframe [LM]Hello Traders,
I would like to introduce you volatility semaphore support&resistance levels. The idea is the same as the pivot
semaphore script of mine to spot the importance of support&resistence.
It is little bit different than previous script as it uses different line API than previous volatility support& resistance multi timeframe . You have more control over hat and how many lines are rendered(better to use odd numbers in line count setting as it always finds 2 S/R lines). Also this indicator has setup for contol whether you want wicky candles or no by setting percentage of candle body that is accepted.
I hope you will enjoy it.

Chaikin Money Flow + MACD + ATRHere I present you on of Trade Pro's Trading Idea: Chaikin Money Flow + MACD + ATR.
This strategy is not as profitable as it can be seen in one of his videos. In the forex market, the strategy could reach a maximum of 35% profitability.
I have, as some of my followers have requested, created an overview of the current position, risk and leverage settings in the form of a table.
Furthermore, one can again swap between short and long positions.
It is now possible to select or deselect individual indicators.
I have chosen the ATR alone as a take profit stop loss, as in his strategy.
A position is only triggered as soon as all prerequisites have been fulfilled and a command is executed. This prevents false triggering by bots and repainting.
-----------------------------------------------------------------------------------
How does the strategy work?
ENTRY
Long
The MACD indicator must be above the zero line.
Then the K line must cross the D line.
Finally, when this happens, the Money Flow Index must be above the zero line.
Short
Contrary to the premise of long positions.
EXIT
ATR Exit
The value of ATR at the time of buying is multiplied by the value entered in "Profit factor ATR" and "Stop factor ATR". As soon as the price reaches this value, it is closed.
Important
The script must be optimized for each coin or currency pair.
I will publish a guide to the strategy shortly. There I will explain how the table works and how to set the strategy correctly.
The results of the strategy are without commissions and leverage.
If you have any questions or feedback, please let me know in the comments.

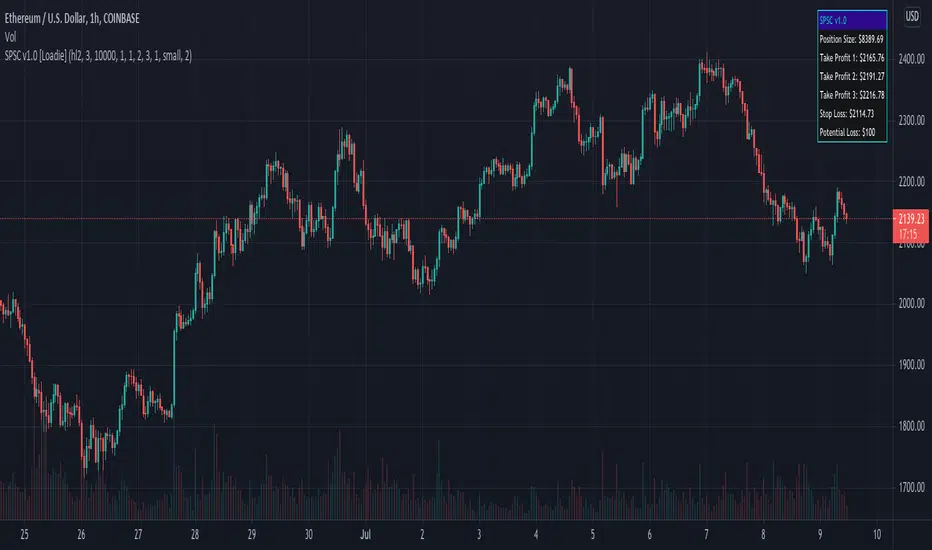
SPSC v1.0SPSC
What is this?
SPSC, or Simple Position Size Calculator, is a tool designed to help with long entries and risk management. You can set 3 separate take profit levels, your stop loss, and desired risk percentage of your overall capital. There is also an option to plot historical take profit and stop loss levels.
GLHF! - NFA!
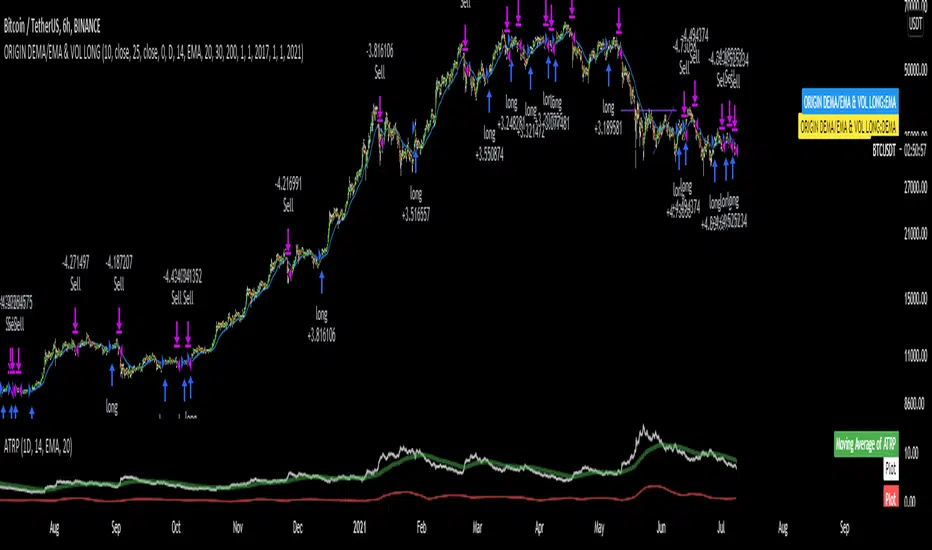
DEMA/EMA & VOLATILITY (VAMS)The biggest issue with momentum following strategies is over signaling during whipsaw periods. I created this strategy that measure momentum with DEMA (Fast Moving) and EMA (Slow moving). In order to mitigate over signaling during whipsaw periods I implemented the average true range percentage (ATRP) to measure realized volatility. If momentum is picking up while volatility is under a certain threshold it purchases the security. If momentum slows while volatility picks up it sells the security. Additionally, if momentum picks up, but volatility is high, it stays out of the security. This follows the theory that during sustained uptrends volatility will decrease, and during market corrections the volatility picks up. Following the old adage that markets climb up the stairs, and fall out the window. Note that this strategy does repaint due to it entering and closing positions at the close of the bars. I forgot to mention how volatility is measured high vs low. If the ATRP is above the EMA of the ATRP the strategy interprets the volatility is increasing and does not enter the security & Vice Versa for selling (with momentum signal of MAs)
This is just my first strategy, any feedback would be much appreciated.
[KL] Relative Volume StrategyThis strategy will Long when:
Confirmation #1: when volume is relatively high
Confirmation #2: during periods of price consolidation (See )
It exits when either (a) stop loss limit is reached, or when (b) price actions suggest trend is bearish.
Measuring price volatility to assume consolidation:
For each candlestick, we quantify price volatility by referring to the value of standard deviations (2x) of closing prices over a look-back period of 20 candles. This is exactly what the Bollinger Band (“BOLL”) indicates by default.
Knowing the value of standard deviation (2x) of prices (aka the width of lower/upper BOLL bands), we then compare it with ATR (x2) over a user-defined length (can be configured in settings). Volatility is considered to be low, relatively, when the standard deviation (x2) of prices is less than ATR (2x).

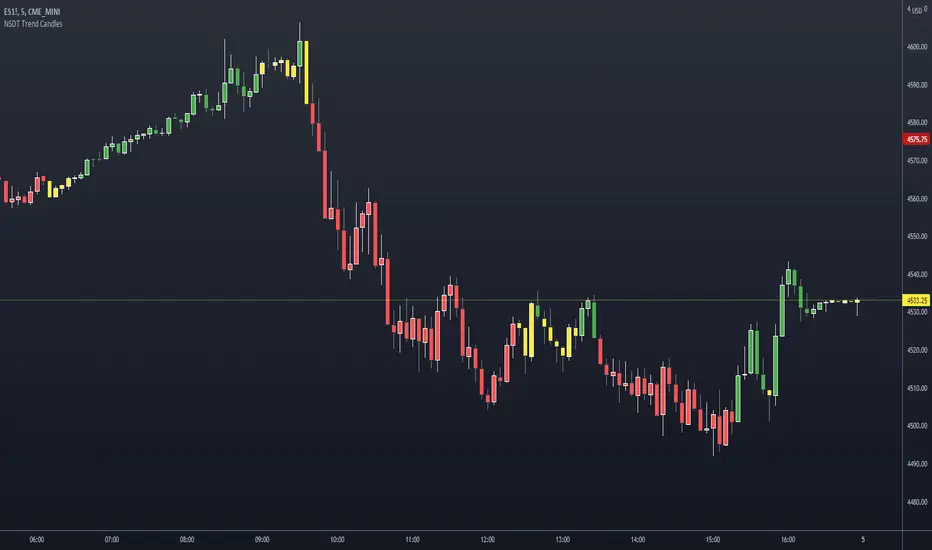
NSDT Trend CandlesThis script changes the color of the candles based on uptrend (green), downtrend (red), neutral/chop (yellow). It uses an ATR and Pivots to determine the direction, or lack of. Since all markets move differently and market volatility changes, you will need to adjust the settings to find a potential match for the day. It's pretty simple to use. Just enter in the direction of the trend and exit (or reverse) when the candle color changes.