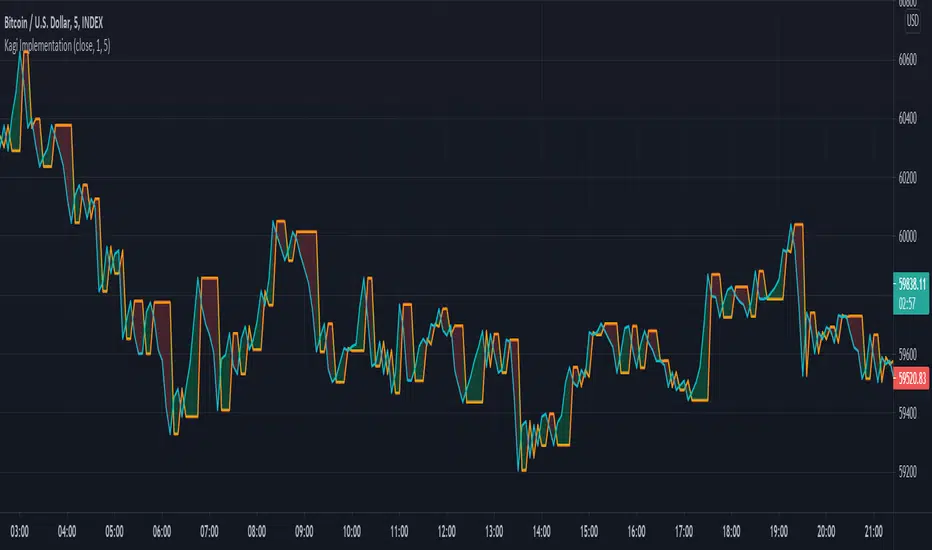
Kagi Implementation (+ATR)My Own Kagi Indicator Implementation!
I couldn't find anywhere on the internet a simple implementation of the Kagi indicator (apart from a seemingly complicated JavaScript implementation).
So I decided to implement it myself and test it against the built-in Kagi indicator calculated by the built-in security function - They ended up exactly the same! (You can see my orange plot completely covers the security's purple plot)
My calculations are based on this article from a site called "euroland", the article is called "Kagi Chart" (I can't post the link because of TradingView restrictions)
Bonus: The built-in kagi indicator uses only Fixed Amount Reversal Size. One that is interested in an ATR Reversal Size can modify the calculation a bit (see script's comments) to easily create and use it.
Some interesting info about the security function I discovered while doing this script:
After I implemented it I noticed that my calculations are the same except the fact that all my values are delayed by 1 bar (relative to the security's indicator). After some research I discovered that the security function uses future data in it's calculation and therefore it cannot be trusted for testing live-trading strategies, unless it is given the appropriate parameters (see script for example).
Have fun trading and don't lose money!
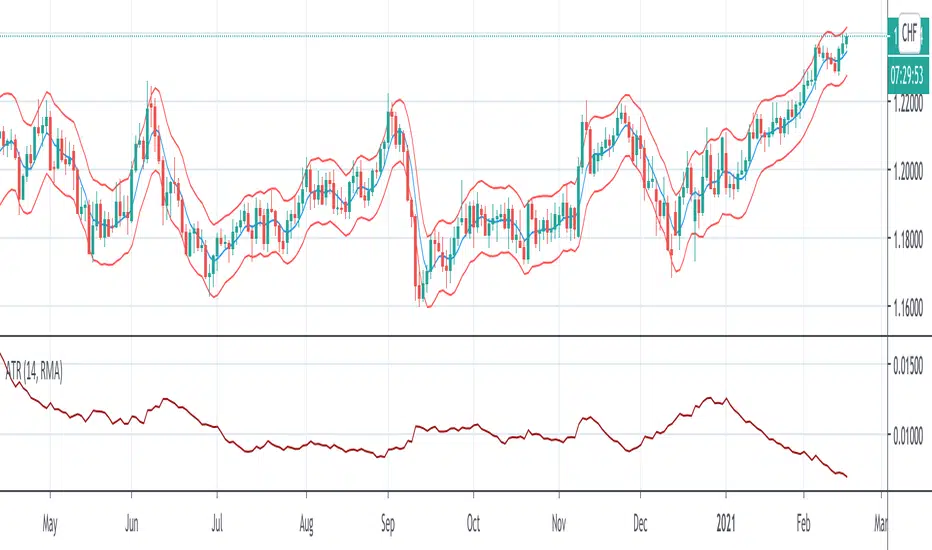
Average True Range (ATR)
ATR For Stop Loss (Overlay)This script is an enhancement of ATR Indicator.
It is used to determine the stop loss position by using the ATR indicator, in conjunction with the low of the candle.
Formula = Stop Loss = Lowest(Lowest Length) - (ATR Multiplier * ATR (Smoothing, Length))
However, the user needs to manually identify the swing low for a better stop loss placement.
Parameter Information :
- Length : Period to calculate the average true range.
- Smoothing : The method used for averaging.
- ATR Multiplier : Multiplier factor to determine the Stop Loss from the lowest reference point. (1 ATR Multiplier means the stop loss would be = Low - ATR)
- Lowest Length : A total number of candle to determine the lowest reference point. (1 means only using the latest candle's low as a lowest reference point)
Have fun and good luck!
ATR PercentAverage True Range in Percent to price
- 2 customizable horizontal line: to be used as custom levels.
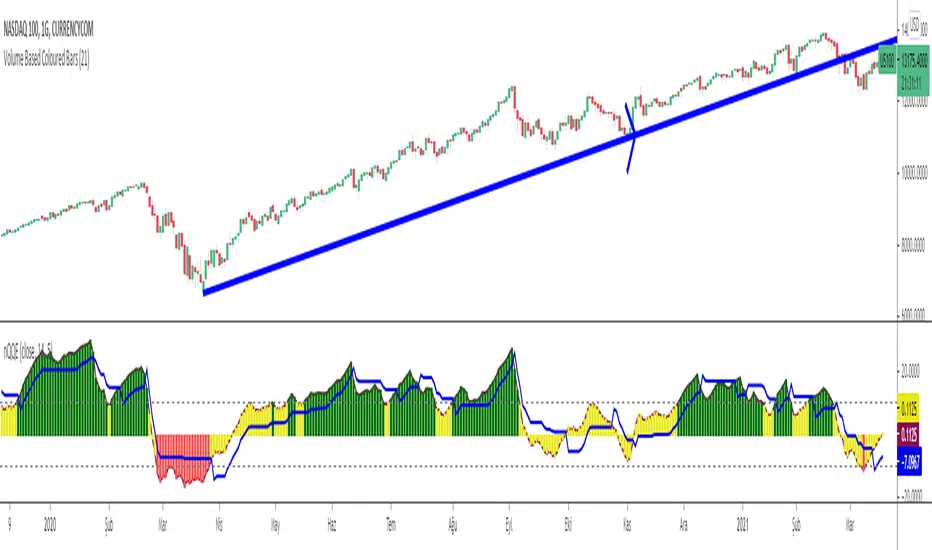
Normalized Quantitative Qualitative Estimation nQQENormalized version of Quantitative Qualitative Estimation QQE:
Normalized QQE tries to overcome the problems of false signals due to RSI divergences on the original QQE indicator.
The main purpose is to determine and ride the trend as far as possible.
So users can identify:
UPTREND : when nQQE Histogram is GREEN (nQQE is above 10)
DOWNTREND : when nQQE Histogram is RED (nQQE is below -10)
SIDEWAYS: when nQQE Histogram is YELLOW (nQQE is between -10 and 10)
Calculation is very simple;
RSI based QQE oscillates between 0-100
nQQE is simply calculated as:
nQQE=QQE-50
to make the indicator fluctuate around 0 level to get more accurate signals.
Various alarms added.
Kıvanç Özbilgiç
Renko + CandlesThis indicator has been designed to show you both candle chart and Renko chart in one place.
I think most of you are familiar with candle chart which is working with the time and price movements but Renko chart is based on price differences and is not related to the "time" parameter.
so if you see a Renko brick is appear up(or down) to the previous brick it means that a certain and fixed price movement has been occurred (which mostly calculate by ATR). and also this indicator works in any time frame.
Remember because we want both charts we have time parameter in this indicator, and if the price doesn't move up or down a certain percentage from previous bars, it will plot a renko bar beside the previous one.
you can use this indicator to see if the price moves up or down.
Or you can determine the important support and resistances with much less noises.
it can be used as a confirmation for you to keep your positions or exit.
go ahead and discover it...
If you have any questions, don't hesitate! ask in the comments section below.

Quantitative Qualitative Estimation QQE
The QQE indicator is a momentum based indicator to determine trend and sideways.
The Qualitative Quantitative Estimation (QQE) indicator works like a smoother version of the popular Relative Strength Index (RSI) indicator. QQE expands on RSI by adding two volatility based trailing stop lines. These trailing stop lines are composed of a fast and a slow moving Average True Range (ATR). These ATR lines are smoothed making this indicator less susceptible to short term volatility.
The most common method of using QQE is to look for crosses of the fast and slow moving trailing stop lines during periods when the QQE line reflects overbought or oversold conditions
Qualitative Quantitative Estimation made up of a smoothed Relative Strength Index (RSI) indicator plus fast and slow volatility-based trailing levels.
Qualitative Quantitative Estimation can be used in two directions:
1.Determine the trend, i.e. if the line is above the 50 level, the trend is ascending, if below - descending;
2.Search for signals at the moment of crossing of the QQE FAST (maroon) and QQE SLOW (blue) lines.
The QQE itself is generally considered to indicate an up-trend ifQQE FAST is above QQE SLOW, and a down-trend if below QQE SLOW.
Often a middle-range between 40 and 60 is set and if the indicator is in that range, then the market is considered to be tracking sideways, or in no trend.
You will need to set only one parameter – “SF” "RSI SMoothing Factor", an analogue of the period in RSI.
By the way, judging from the open source information, the algorithm used the standard strength index with a period of 14 for calculations.
Various signals can be created from the indicator such as:
-Buy when QQE FAST crosses above QQE SLOW below 50 level or just buy when QQE lines crosses above 50 level.
-Sell when QQE FAST crosses below QQE SLOW above 50 level or just sell when QQE lines crosses below 50 level.
WARNING: QQE IS A RSI BASED INDICATOR SO THAT IT CAN TRIGGER FALSE SIGNALS DURING DIVERGENCES!
Kıvanç Özbilgiç

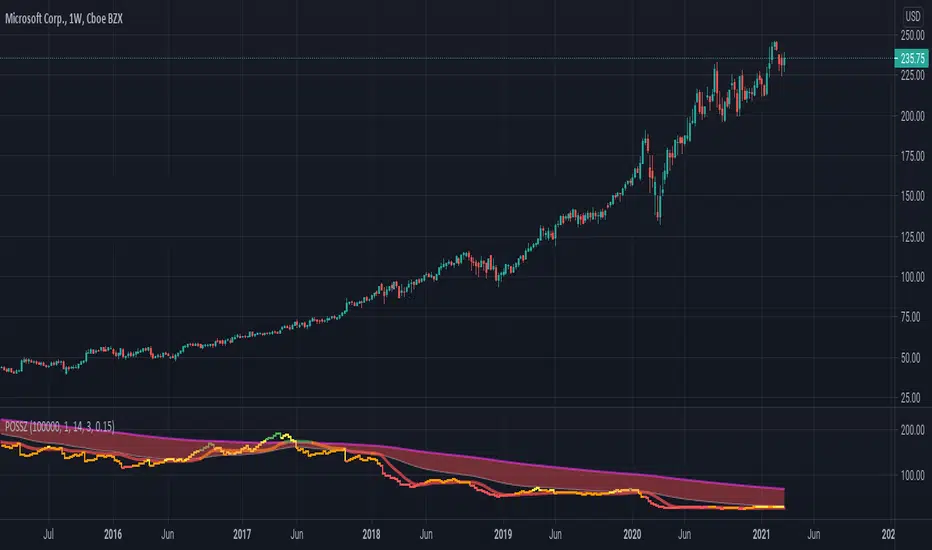
Position SizingATR based position sizing calculator that takes into account the capital, risk percentage and commissions to be paid. Color changes to green as the affordable position size significantly increases relative to recent history.
EMA with RSI Backed Divergence BandsEMA200 with bands around it showing the effect of changes in RSI scaled by ATR . When the filling is green it indicates the bullish momentum and bearish when it is red.


Stochastic ATR IIStochastic ATR(Higher timeframe)
- stochastic of macd of ATR.
- stochastic rsi of ATR

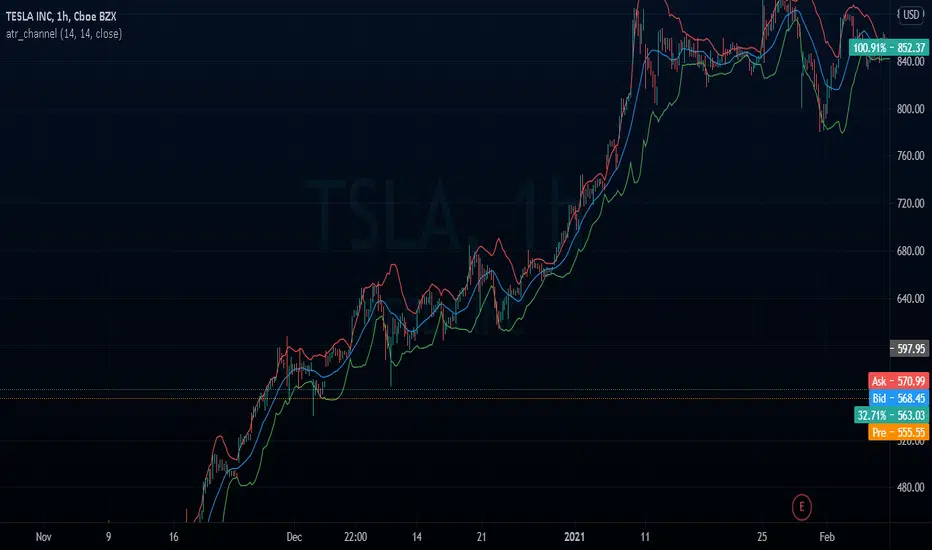
atr_channelThe original bollinger bands have a fixed deviation of 2%, this channel calculates the ATR % (Atr Percentage) and places the upper and lower bands
Up-Down RangeHere is an attempt to segregate ATR into ATR of up days and down days.
While setting trailing stops based on ATR, you probably need to consider more on how an instrument can drop during red days. Hence, ATR of only red days makes more compelling case than overall ATR. Another use case for this kind of indicator may be in options if you are selling puts and calls with the intent of pocketing premiums on expiry.
Parameters are as explained below:
Range Type : Different range types are tr (True Range) , close (difference between close prices), highlow (difference between high and low of candle)
Period : ATR Period
Moving Average Type : Moving Average Type for calculating ATR. Two additional types - min and max are added which calculates lowest and highest range in last n bars
HideFullAtr : Hides combined ATR if checked.
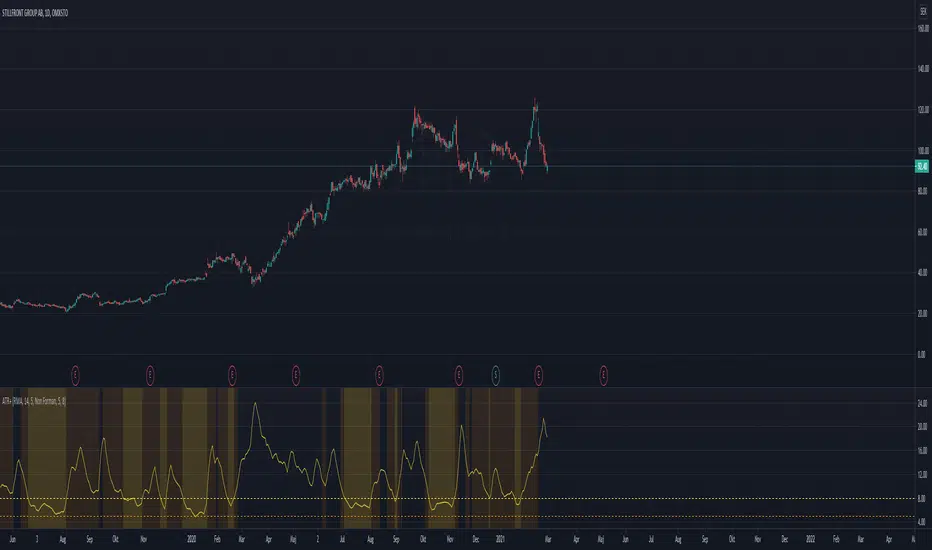
ATR+(Experimental)
I often use the ATR as a volatility filter, to get better entries or to just get a quick understand of the volatility when screening different stocks.
With this indicator you can use the ATR in a few different ways:
-- Dynamic ATR --
To get more comparability between stocks I use a dynamic/normalized ATR, so I've experimented with two different methods.
ATR% can be calculated using John Forman’s approach called Normalized ATR (ATR / Close * 100). Or it can be calculated using what I call "Non Forman",
where the normalization happens to the true range and not to the average true range (average of (TR / Close * 100)). I think this method is "cleaner",
though the difference between the two is minimal. For more on this see www.macroption.com
You can chose between normal ATR (not normalized), Forman's normazation method, and "Non-Forman" normalization.
-- Smoothed ATR --
I originally used an ATR on a higher timeframe to get an idea of the overall volatility. But with higher time frames you always end up lag (or repainting
issues when combining into an indicator). So I expertimented on smoothing the true range, by including several bars into the calculation. I most trade
on a daily time frame so to my default "smoothing" is calculating the true range based on the last 5 days. This pretty much equals how the weekly TR
would be calculated, but since it updates daily we get a different result.
You can chose between displaying the standard ATR, the smoothed ATR or both.
-- Thresholds --
To make it more clear and visually more appealing I added thresholds and I'm plotting warning zones for low volatily.
-- Moving Average Method --
I think the best results from ATR comes when using RMA. But since I wanted to experiment with different options, the moving averages can be done using
RMA, SMA, EMA, Hull MA, or WMA.
MA Candles - SupertrendConverting strategy to indicator for those who want to use it as indicator.
Concepts are simple :
Calculate moving average of High, Low, Open and Close and make candles of them
Calculate ATR and derive supertrend on the moving average candles.
Alerts :
Bullish Crossover - When supertrend turns green
Bearish Crossover - When supertrend turns red
Bullish Pullback - Supertrend is green but close crossed below Moving average high
Bearish Pullback - Supertrend is red but close crossed above Moving average low
Original strategy is present here:

ATRangerATRanger uses Average True Range plus a variety of Moving Averages of the ATR in band format.
This is another way to identify overbought and oversold (poking out of the bands, or bouncing from them as support or resistance.)
A variety of Time-Frames can be selected, as well as several Moving Average Types to draw the bands with. (SMA, WMA, VWMA, SMMA, HMA, EMA)
Open Source

ATR Without OutliersIt is an ATR indicator which filters out outliers.
Outliers are values which are higher than the standard deviation of the true range.
It may be better than normal ATR for stop loss, because it does not keep large values after pump or dump.
It is very useful for high volatile markets like crypto markets.

ACD - Layers 1 & 2An implementation of layers 1 & 2 of ACD strategy of Mark Fisher, based on the book "The Logical Trader".
This implementation contains:
- OR lines
- A lines
- C lines
- Daily pivot range
- N days pivot range
- Customizable trading session
Strategy summary (This implementation):
There is 3 main concepts, each of which represented as two price levels.
1) OR (Opening Range) is the range of the first bar of the day. In other words, it's just "high - low" of the first resolution (usually 15min.) bar of the day. So, OR lines (Aqua color) visualize this range for each trading session.
As stated by Mark Fisher in his book, this range is meant to be a statistically significant range such that when price breaks the range in one direction, This is UNUSUAL to infiltrate it again AND break through the other side. So we can consider it as a potential enter signal (long or short).
2) A lines (Blue color) are drawn above and below OR lines with difference of 10% 0f 10 days ATR. The ATR period and the A multiplier (usually 10%) is customizable.
3) C lines (Gray color) are drawn above and below OR lines at 15% of 10 Days ATR difference. These lines help detecting AND confirming that UNUSUAL situation.
These concepts form the layer 1, which you can spot potential opportunities with it.
There is also two ranges to show support and resistance levels based on price action of previous days. Pivot ranges are rolling ranges that calculated and last for each day separately. They only differ in calculation period - the first one is daily (yellow color area) and the other one (red color area) is customizable, but is usually 3 or 5 days.
Each range consists of two price levels, valid for the current trading session. One of theme is HL2 , and the other one is "HLC3 + abs(HLC3 - HL2 )".
These two ranges, "Daily pivot range" and "N days pivot range", form the layer 2, which you can see them as two dynamic support/resistance ranges - one for daily, and the other for N days. They help filtering opportunities spotted from layer 1.
There is 2 more layers in the ACD strategy, which is omitted in this free implementation.

Arnaud Legoux Moving Average With ATR BandsArnaud Legoux Moving Average With ATR Bands to get an idea of the volatility.
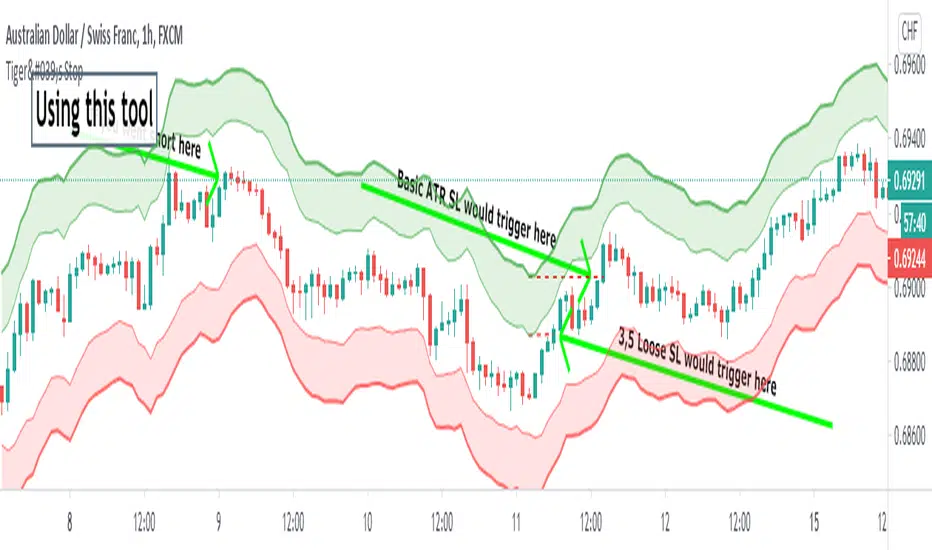
Tiger's Stop - Objective Stoploss SettingTrading is a lot about risk management too. I created this script to help with setting and moving a proper stop-loss. It plots an area that is a result of adding and subtracting both average true range and something I call "false range".
►The Average True Range is calculated as the candle's high-low. If there is a gap, it is added to complete the result.
►My own False Range just candle bodies. It is calculated as an absolute value of (close-open).
Then, Rolling Moving Average is applied on both ATR and False Range to get an idea of how far the price tends to extend out of pure randomness. The resulting value is multiplied by a Multiplier.
The next step is an addition of the values to the higher part of the candle for short or a lower part of the candle for long. I prefer a special calculation instead of using Highs and Lows because it allows for more precise observation and stop-loss set up for less wicky symbols.
►►►Additional Functions
• Smoothing - applies moving average to candles from which range distance is calculated. This can achieve good smoothness but higher values will lead to using outdated price in the SL area calculation.
• Enable/Disable - if you know the direction you are going to trade in, it is good to disable either Long Stop-Loss Area or Short Stop-Loss Area. Just untick it in the settings.
►►►Actual Using
Before using the script to set your stop-loss, check the historical data and find a similar set-up. Is it engulfing you use as a trigger? Find a different one and see how effective the stop-loss based on the ATR*multiplier was. This will help you to optimize Multiplier value. A picture shows such research for a double top. You should find more similar situations to find an optimal value.
Ultimately, the indicator still gives you relatively a lot of freedom with your stop-loss settings (at least, that is with the default settings). You need to decide how loose stop-loss you want to set. Average True Range is the furthermost part which will make for a very large stop-loss, on the other hand, False Range might be triggered by a villainous wick unnecessarily. The choice should depend on the specific symbol you trade and perhaps, you will learn to set stops regardless of the indicator.
A little trick : 1. You can set the loosest stop-loss and set a TradingView alert for where the tightest stop-loss would be. When alerted, you will get the opportunity to reconsider the trade and take a loss if needs be or exit if a candle closes there. 2. Mostly for cryptocurrencies, you can set the tightest stop-loss to protect yourself from sudden spikes. If the price approaches it slowly enough, you can move the stop-loss to the further part of the channel. This is not the same as moving stop-loss indefinitely with hopes of reversal if you plan it from the beginning and a smaller stop is meant to protect you from spikes that are not always predictable and drive to both directions.
►►►Advantages of trailing stop-loss
I usually stick with my original stop-loss instead of moving to break even. If my entry area was functional support once, it may work again and is, therefore, still a good entry zone. But an alternative used to preserve as much of the profit as possible is trailing.
Trailing is setting a specific value in ticks or a calculation of how to move the stop-loss whenever the price moves in your favor. Tiger's Stop can be used this way. Whenever there is a new value as the candle closes and that value is closer to price than your current stop-loss, you can update it. However, if it moves further from your price, don't change the stop-loss. This can be a little tiresome if you do it manually but should be worth the effort.
I usually start trailing only after the price moves significantly in my favor that allowing it to return to the entry price would not make any sense.
►►►Feedback and optimization
The preview chart is chosen entirely at random and the values are not optimized for any specific symbol. If you opt to use it, let me know which values work for you the best, I'll add it to the description when I update it.
Furthermore, let me know if you think any sort of alerts would be useful with my script.
Good luck!
ATR-warningLarge candles are not always a suitable place to trade, or it could be the perfect place to trade.
This script plots a small rectangle at the top of the chart when a candle is larger than the specified ATR.

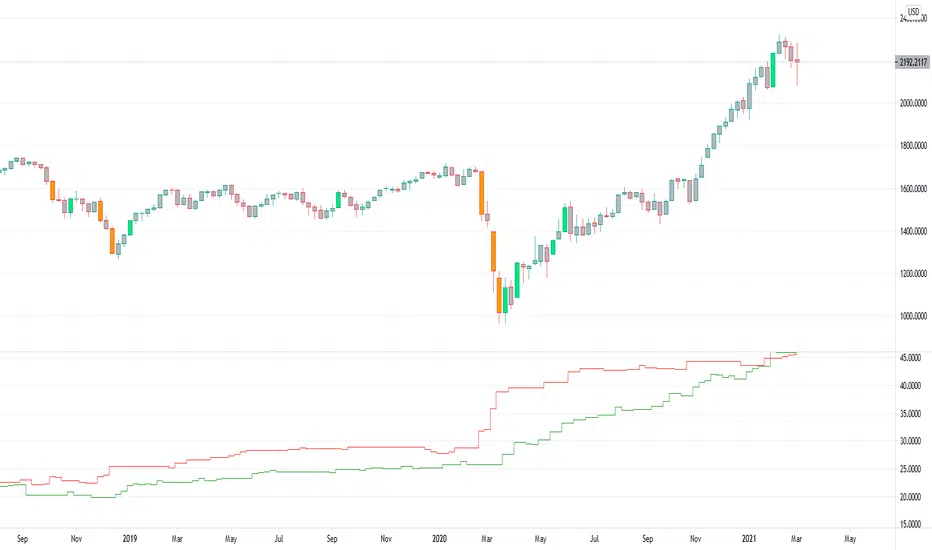
Decomposed Average True RangeThis simple script decomposes the value of the Average True Range into a bullish component and a bearish component .
The script supports two plotting methods; Mirrored and Two Lines . If Mirrored is chosen, the indicator plots the bullish component as a positive number, and the bearish component as a negative number. If Two Lines is chosen, the indicator plots two lines, both of positive values. It is the same data, just visualized differently.
Side note: This is very similar to how the strength (average gain) part in the Relative Strength Index calculation works. However, the RSI uses the realized range (close - previous close) rather than true range. If we were to use the bullish component of the ATR as the average bullish gain part in the RSI calculation, and the bearish component of the ATR as the average bearish gain part in the RSI calculation, we would get very similar (but not equal) results to the standard RSI. This shows how the ATR and the RSI are related to each other.

MA, MATR, ChEx | All in One - 4CR CUPIn trade position setup, we always need to determine the market structure and manage the position sizing in a short period of decision time. Indicators such as moving average, initial stop loss and trailing stop loss are always helpful.
This indicator put all these handy tools into a single toolkit, which includes the following price action and risk management indicators:
MA - Moving Average
MATR - Moving Average less Average True Range
ChEx - Chandelier Exit
This script further enhances the setting so that you can easily customize the indicators.
For both the Moving Averages and the Moving Average less Average True Range , you can pick a type of moving average which suits your analysis style from a list of commonly used moving average formulations: namely, EMA , HMA , RMA, SMA and WMA , where EMA is selected as default.
The Moving Average less Average True Range , MATR, is usually applied as a reference to set the initial stop loss whenever opening a new position.
The abbreviation, MATR, is picked, so that this can serve as a handy reminder of a very good trading framework as elaborates as below:
M – Market Structure
A – Area of Value
T – Trigger
R – Risk Management (aka. Exit Strategy)

Position Size Calculator - Fixed Dollar amount, point value ATRHello Traders,
A very simple code aiming to help you size your position, according to the amount you're accepting to lose AND the current volatility ATR.
Why is it important to use ATR size ? Markets move, and having fixed stoploss values will lead to getting stopped out in case of volatility increase.
You also need to size down your trades in case of more volatily, as more points can be taken or lost.
Hope it helps!
Kudos to Racer9 who inspired me :
