Breadth of Volatility The Breadth of Volatility (BoV) is an indicator designed to help traders understand the activity and volatility of the market. It focuses on analyzing how fast prices are moving and how much trading volume is driving those movements. By combining these two factors—price speed and volume strength—the BoV provides a single value that reflects the current level of market activity. This can help traders identify when the market is particularly active or calm, which is useful for planning trading strategies.
The speed component of the BoV measures how quickly prices are moving compared to their recent average. This is done by using a metric called the Average True Range (ATR), which calculates the typical size of price movements over a specific period. The BoV compares the current price change to this average, showing whether the market is moving faster or slower than usual. Faster price movements generally indicate higher volatility, which might signal opportunities for active traders.
The strength component focuses on the role of trading volume in price changes. It multiplies the trading volume by the size of the price movement to create a value called volume strength. This value is then compared to the highest volume strength seen over a recent period, which helps gauge whether the current price action is being strongly supported by trading activity. When the strength value is high, it suggests that market participants are actively trading and supporting the price movement.
These two components—speed and strength—are averaged to calculate the Breadth of Volatility value. While the formula also includes a placeholder for a third component (related to fundamental analysis), it is currently inactive and does not influence the final value. The BoV is displayed as a line on a chart, with a zero line for reference. Positive BoV values indicate heightened market activity and volatility, while values near zero suggest a quieter market. This indicator is particularly helpful for new traders to monitor market conditions and adjust their strategies accordingly, whether they’re focusing on trend-following or waiting for calmer periods for more conservative trades.
Important Notice:
Trading financial markets involves significant risk and may not be suitable for all investors. The use of technical indicators like this one does not guarantee profitable results. This indicator should not be used as a standalone analysis tool. It is essential to combine it with other forms of analysis, such as fundamental analysis, risk management strategies, and awareness of current market conditions. Always conduct thorough research or consult with a qualified financial advisor before making trading decisions. Past performance is not indicative of future results.
Disclaimer:
Trading financial instruments involves substantial risk and may not be suitable for all investors. Past performance is not indicative of future results. This indicator is provided for informational and educational purposes only and should not be considered investment advice. Always conduct your own research and consult with a licensed financial professional before making any trading decisions.
Note: The effectiveness of any technical indicator can vary based on market conditions and individual trading styles. It's crucial to test indicators thoroughly using historical data and possibly paper trading before applying them in live trading scenarios.
Average True Range (ATR)

ATR for Aggregated Bars (2 Bars)Range Bar ATR Indicator: Detailed Description and Usage Guide
This script is a custom indicator designed specifically for Range Bar charts , tailored to help traders understand and navigate market conditions by utilizing the Average True Range (ATR) concept. The indicator adapts the traditional ATR to work effectively with Range Bar charts, where bars have a fixed range rather than being time-based.
How It Works
1. ATR Calculation on Range Bars :
- Unlike time-based charts, Range Bar charts focus on price movement within a fixed range.
- The indicator calculates ATR by pairing consecutive bars, treating every two bars as a single unit . This pairing ensures that the ATR reflects price movement effectively on Range Bar charts.
2. Short and Long Period ATR Values :
- The script displays two ATR values :
- A short-period ATR , calculated over a smaller number of paired bars.
- A long-period ATR , calculated over a larger number of paired bars.
- These values provide a dynamic view of both recent and longer-term market volatility.
Why Use This Indicator?
The primary goal is to provide a meaningful adaptation of the ATR indicator for Range Bar charts, allowing traders to make informed decisions similar to using ATR on traditional time-based charts.
Key Applications
Determine a Better Custom Range :
- Analyze the ATR values to choose an optimal range size for Range Bar charts, ensuring better alignment with market conditions.
Assess Market Volatility :
- Rising volatility : When the short-period ATR value is higher than the long-period value, it signals increasing volatility.
- Decreasing volatility : When the short-period ATR value is lower, it indicates declining volatility.
Risk and Stop Loss Management :
- Use the higher ATR value (e.g., the long-period ATR) to calculate minimum stop loss levels. Multiply the ATR by 1.5 or 2 to set a safe buffer against market fluctuations.
How to Use It
1. Add the script to a Range Bar chart.
2. Configure the short and long ATR periods to suit your trading style and preferences.
3. Observe the displayed ATR values:
- Use these values to analyze market conditions and adapt your strategy accordingly.
4. Apply insights from the ATR values for:
- Determining custom Range Bar settings.
- Evaluating volatility trends.
- Setting effective risk parameters like stop loss levels.
Benefits
- Provides a tailored ATR tool for Range Bar charts, addressing the unique challenges of fixed-range trading.
- Offers both short-term and long-term perspectives on volatility.
- Enhances decision-making for range settings, volatility analysis, and risk management.
This indicator bridges the gap between traditional ATR indicators and the specific needs of Range Bar chart users, making it a versatile tool for traders.

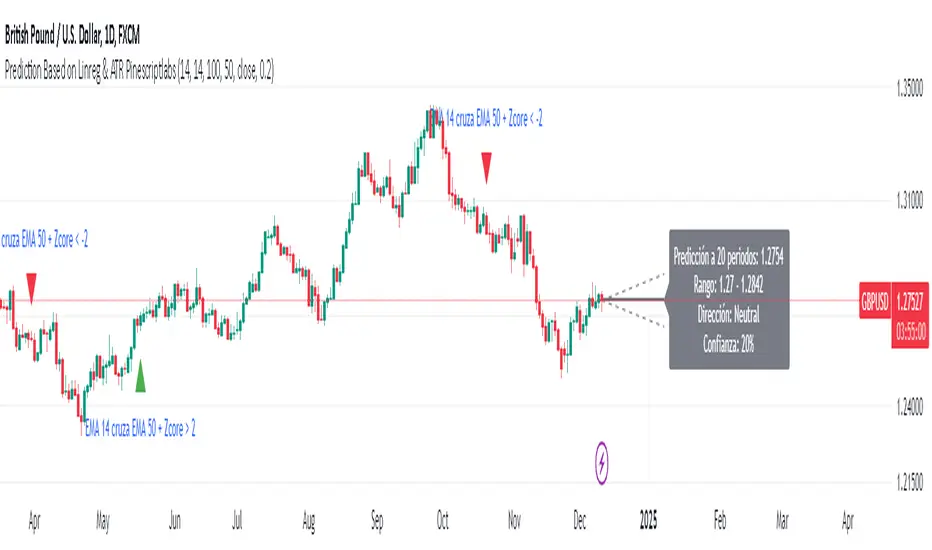
Prediction Based on Linreg & Atr
We created this algorithm with the goal of predicting future prices 📊, specifically where the value of any asset will go in the next 20 periods ⏳. It uses linear regression based on past prices, calculating a slope and an intercept to forecast future behavior 🔮. This prediction is then adjusted according to market volatility, measured by the ATR 📉, and the direction of trend signals, which are based on the MACD and moving averages 📈.
How Does the Linreg & ATR Prediction Work?
1. Trend Calculation and Signals:
o Technical Indicators: We use short- and long-term exponential moving averages (EMA), RSI, MACD, and Bollinger Bands 📊 to assess market direction and sentiment (not visually presented in the script).
o Calculation Functions: These include functions to calculate slope, average, intercept, standard deviation, and Pearson's R, which are crucial for regression analysis 📉.
2. Predicting Future Prices:
o Linear Regression: The algorithm calculates the slope, average, and intercept of past prices to create a regression channel 📈, helping to predict the range of future prices 🔮.
o Standard Deviation and Pearson's R: These metrics determine the strength of the regression 🔍.
3. Adjusting the Prediction:
o The predicted value is adjusted by considering market volatility (ATR 📉) and the direction of trend signals 🔮, ensuring that the prediction is aligned with the current market environment 🌍.
4. Visualization:
o Prediction Lines and Bands: The algorithm plots lines that display the predicted future price along with a prediction range (upper and lower bounds) 📉📈.
5. EMA Cross Signals:
o EMA Conditions and Total Score: A bullish crossover signal is generated when the total score is positive and the short EMA crosses above the long EMA 📈. A bearish crossover signal is generated when the total score is negative and the short EMA crosses below the long EMA 📉.
6. Additional Considerations:
o Multi-Timeframe Regression Channel: The script calculates regression channels for different timeframes (5m, 15m, 30m, 4h) ⏳, helping determine the overall market direction 📊 (not visually presented).
Confidence Interpretation:
• High Confidence (close to 100%): Indicates strong alignment between timeframes with a clear trend (bullish or bearish) 🔥.
• Low Confidence (close to 0%): Shows disagreement or weak signals between timeframes ⚠️.
Confidence complements the interpretation of the prediction range and expected direction 🔮, aiding in decision-making for market entry or exit 🚀.
Español
Creamos este algoritmo con el objetivo de predecir los precios futuros 📊, específicamente hacia dónde irá el valor de cualquier activo en los próximos 20 períodos ⏳. Utiliza regresión lineal basada en los precios pasados, calculando una pendiente y una intersección para prever el comportamiento futuro 🔮. Esta predicción se ajusta según la volatilidad del mercado, medida por el ATR 📉, y la dirección de las señales de tendencia, que se basan en el MACD y las medias móviles 📈.
¿Cómo Funciona la Predicción con Linreg & ATR?
Cálculo de Tendencias y Señales:
Indicadores Técnicos: Usamos medias móviles exponenciales (EMA) a corto y largo plazo, RSI, MACD y Bandas de Bollinger 📊 para evaluar la dirección y el sentimiento del mercado (no presentados visualmente en el script).
Funciones de Cálculo: Incluye funciones para calcular pendiente, media, intersección, desviación estándar y el coeficiente de correlación de Pearson, esenciales para el análisis de regresión 📉.
Predicción de Precios Futuros:
Regresión Lineal: El algoritmo calcula la pendiente, la media y la intersección de los precios pasados para crear un canal de regresión 📈, ayudando a predecir el rango de precios futuros 🔮.
Desviación Estándar y Pearson's R: Estas métricas determinan la fuerza de la regresión 🔍.
Ajuste de la Predicción:
El valor predicho se ajusta considerando la volatilidad del mercado (ATR 📉) y la dirección de las señales de tendencia 🔮, asegurando que la predicción esté alineada con el entorno actual del mercado 🌍.
Visualización:
Líneas y Bandas de Predicción: El algoritmo traza líneas que muestran el precio futuro predicho, junto con un rango de predicción (límites superior e inferior) 📉📈.
Señales de Cruce de EMAs:
Condiciones de EMAs y Puntaje Total: Se genera una señal de cruce alcista cuando el puntaje total es positivo y la EMA corta cruza por encima de la EMA larga 📈. Se genera una señal de cruce bajista cuando el puntaje total es negativo y la EMA corta cruza por debajo de la EMA larga 📉.
Consideraciones Adicionales:
Canal de Regresión Multi-Timeframe: El script calcula canales de regresión para diferentes marcos de tiempo (5m, 15m, 30m, 4h) ⏳, ayudando a determinar la dirección general del mercado 📊 (no presentado visualmente).
Interpretación de la Confianza:
Alta Confianza (cerca del 100%): Indica una fuerte alineación entre los marcos temporales con una tendencia clara (alcista o bajista) 🔥.
Baja Confianza (cerca del 0%): Muestra desacuerdo o señales débiles entre los marcos temporales ⚠️.
La confianza complementa la interpretación del rango de predicción y la dirección esperada 🔮, ayudando en las decisiones de entrada o salida en el mercado 🚀.
ATR SL Band (No-Repaint, Multi-Timeframe) + Risk per ContractThis indicator draws a non-repainting band for ATR-based Stoploss placement.
If used on Futures, it shows the distance + risk from the previous candle close, as well as from the current price.
The risk value is automatically calculated for the following symbols:
(Micro) ES (S&P 500)
(Micro) NQ (NASDAQ 100)
(Micro) YM (Dow Jones Industrial Average / US30)
The timeframe can be set individually. It is not recommended to use a lower timeframe than the chart timeframe as values differ from the actual timeframe's ATR SL in this case.

Visual ATR StopThis indicator uses the Average True Range (ATR) to display a visual range for stop placement. Two multiplier values (example, 1 and 3) can be set to create a filled area below the price. This area represents the range between the two ATR levels, adjusted by subtracting the current price, providing a simple way to visualize stop-loss placement based on volatility.
The indicator is customizable; for example, negative values can place the area above the price for short positions. The filled color can also be removed, which allows precise levels to be marked above and below.

WhalenatorThis custom TradingView indicator combines multiple analytic techniques to help identify potential market trends, areas of support and resistance, and zones of heightened trading activity. It incorporates a SuperTrend-like line based on ATR, Keltner Channels for volatility-based price envelopes, and dynamic order blocks derived from significant volume and pivot points. Additionally, it highlights “whale” activities—periods of exceptionally large volume—along with an estimated volume profile level and approximate bid/ask volume distribution. Together, these features aim to offer traders a more comprehensive view of price structure, volatility, and institutional participation.
This custom TradingView indicator integrates multiple trading concepts into a single, visually descriptive tool. Its primary goal is to help traders identify directional bias, volatility levels, significant volume events, and potential support/resistance zones on a price chart. Below are the main components and their functionalities:
SuperTrend-Like Line (Trend Bias):
At the core of the indicator is a trend-following line inspired by the SuperTrend concept, which uses Average True Range (ATR) to adaptively set trailing stop levels. By comparing price to these levels, the line attempts to indicate when the market is in an uptrend (price above the line) or a downtrend (price below the line). The shifting levels can provide a dynamic sense of direction and help traders stay with the predominant trend until it shifts.
Keltner Channels (Volatility and Range):
Keltner Channels, based on an exponential moving average and Average True Range, form volatility-based envelopes around price. They help traders visualize whether price is extended (touching or moving outside the upper/lower band) or trading within a stable range. This can be useful in identifying low-volatility consolidations and high-volatility breakouts.
Dynamic Order Blocks (Approximations of Supply/Demand Zones):
By detecting pivot highs and lows under conditions of significant volume, the indicator approximates "order blocks." Order blocks are areas where institutional buying or selling may have occurred, potentially acting as future support or resistance zones. Although these approximations are not perfect, they offer a visual cue to areas on the chart where price might react strongly if revisited.
Volume Profile Proxy and Whale Detection:
The indicator highlights price levels associated with recent maximum volume activity, providing a rough "volume profile" reference. Such levels often become key points of price interaction.
"Whale" detection logic attempts to identify bars where exceptionally large volume occurs (beyond a defined threshold). By tracking these "whale bars," traders can infer where heavy participation—often from large traders or institutions—may influence market direction or create zones of interest.
Approximate Bid/Ask Volume and Dollar Volume Tracking:
The script estimates whether volume within each bar leans more towards the bid or the ask side, aiming to understand which participant (buyers or sellers) might have been more aggressive. Additionally, it calculates dollar volume (close price multiplied by volume) and provides an average to gauge the relative participation strength over time.
Labeling and Visual Aids:
Dynamic labels display Whale Frequency (the ratio of bars with exceptionally large volume), average dollar volume, and approximate ask/bid volume metrics. This gives traders at-a-glance insights into current market conditions, participation, and sentiment.
Strengths:
Multifaceted Analysis:
By combining trend, volatility, volume, and order block logic in one place, the indicator saves chart space and simplifies the analytical process. Traders gain a holistic view without flipping between multiple separate tools.
Adaptable to Market Conditions:
The use of ATR and Keltner Channels adapts to changing volatility conditions. The SuperTrend-like line helps keep traders aligned with the prevailing trend, avoiding constant whipsaws in choppy markets.
Volume-Based Insights:
Integrating whale detection and a crude volume profile proxy helps traders understand where large players might be interacting. This perspective can highlight critical levels that might not be evident from price action alone.
Convenient Visual Cues and Labels:
The indicator provides quick reference points and textual information about the underlying volume dynamics, making decision-making potentially faster and more informed.
Weaknesses:
Heuristic and Approximate Nature:
Many of the indicator’s features, like the "order blocks," "whale detection," and the approximate bid/ask volume, rely on heuristics and assumptions that may not always be accurate. Without actual Level II data or true volume profiles, the insights are best considered as supplementary, not definitive signals.
Lagging Components:
Indicators that rely on past data, like ATR-based trends or moving averages for Keltner Channels, inherently lag behind price. This can cause delayed signals, particularly in fast-moving markets, potentially missing some early opportunities or late in confirming market reversals.
No Guaranteed Predictive Power:
As with any technical tool, it does not forecast the future with certainty. Strong volume at a certain level or a bullish SuperTrend reading does not guarantee price will continue in that direction. Market conditions can change unexpectedly, and false signals will occur.
Complexity and Overreliance Risk:
With multiple signals combined, there’s a risk of information overload. Traders might feel compelled to rely too heavily on this one tool. Without complementary analysis (fundamentals, news, or additional technical confirmation), overreliance on the indicator could lead to misguided trades.
Conclusion:
This integrated indicator offers a comprehensive visual guide to market structure, volatility, and activity. Its strength lies in providing a multi-dimensional viewpoint in a single tool. However, traders should remain aware of its approximations, inherent lags, and the potential for conflicting signals. Sound risk management, position sizing, and the use of complementary analysis methods remain essential for trading success.
Risks Associated with Trading:
No indicator can guarantee profitable trades or accurately predict future price movements. Market conditions are inherently unpredictable, and reliance on any single tool or combination of tools carries the risk of financial loss. Traders should practice sound risk management, including the use of stop losses and position sizing, and should not trade with funds they cannot afford to lose. Ultimately, decisions should be guided by a thorough trading plan and possibly supplemented with other forms of market analysis or professional advice.
Risks and Important Considerations:
• Not a Standalone Tool:
• This indicator should not be used in isolation. It is essential to incorporate additional technical analysis tools, fundamental analysis, and market context when making trading decisions.
• Relying solely on this indicator may lead to incomplete assessments of market conditions.
• Market Volatility and False Signals:
• Financial markets can be highly volatile, and indicators based on historical data may not accurately predict future movements.
• The indicator may produce false signals due to sudden market changes, low liquidity, or atypical trading activity.
• Risk Management:
• Always employ robust risk management strategies, including setting stop-loss orders, diversifying your portfolio, and not over-leveraging positions.
• Understand that no indicator guarantees success, and losses are a natural part of trading.
• Emotional Discipline:
• Avoid making impulsive decisions based on indicator signals alone.
• Emotional trading can lead to significant financial losses; maintain discipline and adhere to a well-thought-out trading plan.
• Continuous Learning and Adaptation:
• Stay informed about market news, economic indicators, and global events that may impact trading conditions.
• Continuously evaluate and adjust your trading strategies as market dynamics evolve.
• Consultation with Professionals:
• Consider seeking advice from financial advisors or professional traders to understand better how this indicator can fit into your overall trading strategy.
• Professional guidance can provide personalized insights based on your financial goals and risk tolerance.
Disclaimer:
Trading financial instruments involves substantial risk and may not be suitable for all investors. Past performance is not indicative of future results. This indicator is provided for informational and educational purposes only and should not be considered investment advice. Always conduct your own research and consult with a licensed financial professional before making any trading decisions.
Note: The effectiveness of any technical indicator can vary based on market conditions and individual trading styles. It's crucial to test indicators thoroughly using historical data and possibly paper trading before applying them in live trading scenarios.

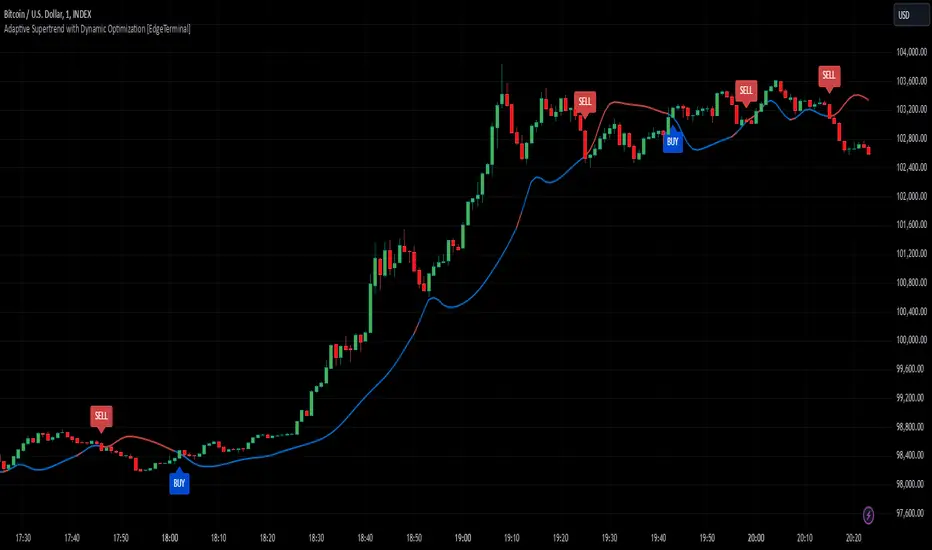
Adaptive Supertrend with Dynamic Optimization [EdgeTerminal]The Enhanced Adaptive Supertrend represents a significant evolution of the traditional Supertrend indicator, incorporating advanced mathematical optimization, dynamic volatility adjustment, intelligent signal filtering, reduced noise and false positives.
Key Features
Dynamic volatility-adjusted bands
Self-optimizing multiplier
Intelligent signal filtering system
Cooldown period to prevent signal clustering
Clear buy/sell signals with optimal positioning
Smooth trend visualization
RSI and MACD integration for confirmation
Performance-based optimization
Dynamic Band Calculation
Dynamic Band Calculation automatically adapts to market volatility, generates wider bands in volatile periods, reducing false signals. It also generates tighter bands in stable periods, capturing smaller moves and smooth transitions between different volatility regimes.
RSI Integration
The RSI and MACD play multiple crucial roles in the Adaptive Supertrend.
It first helps with momentum factor calculation. This dynamically adjusts band width based on momentum conditions. When the RSI is oversold, bands widen by 20% to prevent false signals during strong downtrends and provide more room for price movements in extreme conditions.
When the RSI is overbought, brands tighten by 20% and they become more sensitive to potential reversals to help catch trend changes earlier.
This reduces false signals in strong trends, helps detect potential reversals earlier than the usual, create adaptive band width based on market conditions and finally, better protection against whipsaws.
MACD Integration
The MACD in this supertrend indicator serves as a trend confirmation tool. The idea is to use MACD crossovers to confirm trend changes to reduce false trend change signals and enhance the signal quality.
For this to become a signal, MACD crossovers must align with price movement to help filter out weak or false signals, which acts as an additional layer of trend confirmation.
Additionally, MACD line position relative to signal line indicates trend strength, helps maintain positions in strong trends and assists in early detection of trend weakening.
Momentum Integration
Momentum Integration prevents false signals in extreme conditions, It adjusts dynamic bands based on market momentum, improves trend confirmation in strong moves and reduces whipsaws during consolidations.
Improved signals
There are a few systems to generate better signals, allowing for generally faster signals compared to original supertrend, such as:
Enforced cooldown period between signals
Prevents signal clustering
Clearer entry/exit points
Reduced false signals during choppy markets
Performance Optimization
This script implements a Sharpe ratio-inspired optimization algorithm to balance returns against risk, penalize large drawdowns, adapt parameters in real-time and improve risk-adjusted performance
Parameter Settings
ATR Period: 10 (default) - adjust based on timeframe
Initial Multiplier: 3.0 (default) - will self-optimize
Optimization Period: 50 (default) - longer periods for more stability
Smoothing Period: 3 (default) - adjust for signal smoothness
Best Practices
Use on multiple timeframes for confirmation
Allow the optimization process to run for at least 50 bars
Monitor the adaptive multiplier for trend strength indication
Consider RSI and MACD alignment for stronger signals
Volatility vs ATRVolatility vs ATR Indicator Description for TradingView
Volatility vs ATR is a powerful custom indicator designed to help traders analyze and compare market volatility with the Average True Range (ATR). This indicator provides valuable insights into the dynamic behavior of asset prices, enabling traders to make informed decisions about market trends, potential reversals, and risk management.
What Does It Measure?
Volatility: Represents the degree of price variation over a given period. Calculated using standard deviation or other measures, it highlights periods of heightened or reduced market activity.
Average True Range (ATR): Measures the average range of price movement over a specific period, providing a sense of the asset's price fluctuations and market activity.
How It Works
The indicator plots both Volatility and ATR on the same chart, making it easy to visualize how these metrics interact.
Rising Volatility often signals increased market uncertainty or the beginning of strong trends.
ATR Spikes typically accompany high volatility, helping identify potential breakout or breakdown scenarios.
By tracking the interplay between these metrics, traders can anticipate shifts in momentum, recognize consolidation phases, and plan trades more effectively.
Key Features
Dual-Line Display: Clearly plots both Volatility (red) and ATR (blue) for easy comparison.
Customizable Periods: Allows you to adjust the lookback period for both metrics to match your trading style.
Versatile Application: Works across all asset classes, including stocks, forex, crypto, and commodities.
Why Use Volatility vs ATR?
Trend Analysis: Identify trending vs. ranging markets by observing the relationship between Volatility and ATR.
Breakout Confirmation: Use Volatility and ATR spikes as confirmation signals for potential breakouts.
Risk Management: Plan stop-loss levels and position sizing based on ATR values.
How to Use It
Add the indicator to your chart.
Look for periods where Volatility diverges from ATR to spot potential market shifts.
Use the indicator in conjunction with price action and other technical tools for a comprehensive analysis.
This indicator is ideal for traders looking to enhance their strategies by understanding market dynamics through the lens of volatility and average price movement.
Let me know if you’d like further refinement!

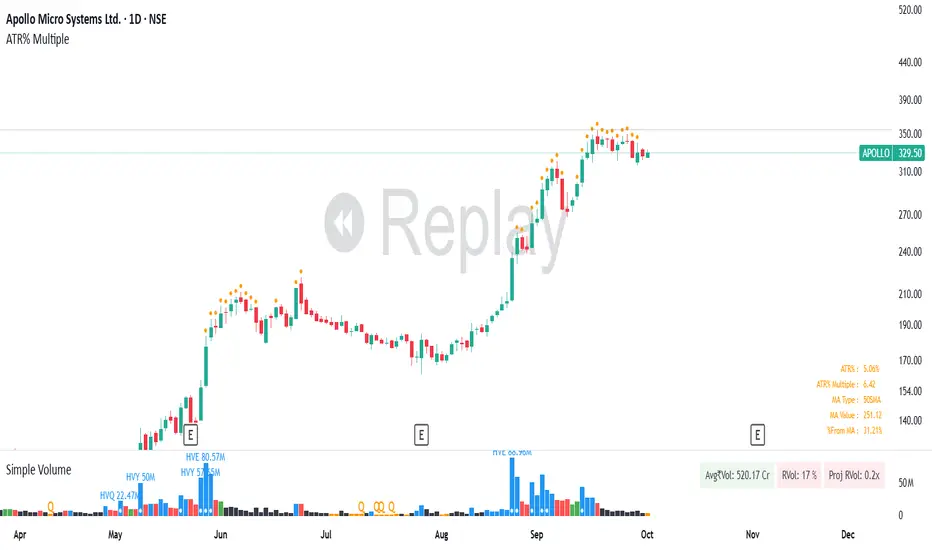
ATR% Multiple from Key Moving AverageThis script gives signal when the ATR% multiple from any chosen moving average is beyond the configurable threshold value. This indicator quantifies how extended the stock is from a given key moving average.
A lot of traders use ATR% multiple from 10DMA, 21EMA, 50SMA or 200SMA to determine how extended a stock is and accordingly sell partials or exit. By default the indicator takes 50SMA and when the ATR% multiple is greater than 7 then it gives the signal to take partials. You can back test this indicator with previous trades and determine the ideal threshold for the signal. For small and midcaps a threshold of 7 to 10 ATR% multiples from 50SMA is where partials can be taken while large caps can revert to mean even earlier at 3 to 5 ATR% multiples from 50SMA.
You can modify this script and use it anyway you please as long as you make it opensource on TradingView.
Position Sizing Calculator (Real-Time)█ SUMMARY
The following indicator is a Position Sizing Calculator based on Average True Range (ATR), originally developed by market technician J. Welles Wilder Jr., intended for real-time trading.
This script utilizes the user's account size, acceptable risk percentage, and a stop-loss distance based on ATR to dynamically calculate the appropriate position size for each trade in real time.
█ BACKGROUND
Developed for use on the 5-minute timeframe, this script provides traders with continuously updated, dynamic position sizes. It enables traders to instantly determine the exact number of shares and dollar amount to use for entering a trade within their acceptable risk tolerance whenever a trade opportunity arises.
This real-time position sizing tool helps traders make well-informed decisions when planning trade entries and calculating maximum stop-loss levels, ultimately enhancing risk management.
█ USER INPUTS
Trading Account Size: Total dollar value of the user's trading account.
Acceptable Risk (%): Maximum percentage of the trading account that the user is willing to risk per trade.
ATR Multiplier for Stop-Loss: Multiplier used to determine the distance of the stop-loss from the current price, based on the ATR value.
ATR Length: The length of the lookback period used to calculate the ATR value.

ATR-based TP/SL with Dynamic RREnglish
This indicator combines the power of the Average True Range (ATR) with dynamic calculations for Take Profit (TP) and Stop Loss (SL) levels, offering a clear visualization of trading opportunities and their respective Risk-Reward Ratios (RRR).
Features:
Dynamic TP/SL Calculation:
TP and SL levels are derived using user-defined ATR multipliers for precise positioning.
Multipliers are flexible, allowing traders to adjust according to their strategies.
Risk-Reward Ratio (RRR):
Automatically calculates and displays the RRR for each trade signal.
Helps traders quickly assess if a trade aligns with their risk management plan.
Entry Conditions:
Buy signals occur when the closing price crosses above the 20-period Simple Moving Average (SMA).
Sell signals occur when the closing price crosses below the 20-period SMA.
Visual Aids:
Red and green lines indicate Stop Loss and Take Profit levels.
Blue and orange labels show the RRR for long and short trades, respectively.
How It Works:
The indicator uses the ATR to calculate TP and SL levels:
TP: Adjusted based on the desired Risk-Reward Ratio (RR).
SL: Proportional to the ATR multiplier.
Entry signals are plotted with "BUY" or "SELL" markers, while the respective TP/SL levels are drawn as horizontal lines.
Why Use This Indicator?
Perfect for traders who value precise risk management.
Helps identify trades with favorable RRR (e.g., greater than 1.5 or 2.0).
Ideal for swing traders, day traders, and scalpers looking to automate their decision-making process.
Customization:
ATR Length: Control the sensitivity of ATR-based calculations.
ATR Multipliers: Set the TP and SL distances relative to the ATR.
Desired RRR: Define the risk/reward ratio you aim to achieve.
Important Notes:
The indicator does not place trades automatically; it is for visual and analytical purposes.
Always backtest and combine it with additional analysis for best results.
French
Cet indicateur combine la puissance de l’Average True Range (ATR) avec des calculs dynamiques pour les niveaux de Take Profit (TP) et de Stop Loss (SL), tout en offrant une visualisation claire des opportunités de trading et de leurs Ratios Risque/Rendement (RRR).
Fonctionnalités :
Calcul Dynamique des TP/SL :
Les niveaux de TP et SL sont calculés à l'aide de multiplicateurs ATR définis par l’utilisateur pour une position précise.
Les multiplicateurs sont personnalisables pour s'adapter à votre stratégie de trading.
Ratio Risque/Rendement (RRR) :
Calcule et affiche automatiquement le ratio RRR pour chaque signal de trade.
Permet aux traders d’évaluer rapidement si un trade correspond à leur plan de gestion des risques.
Conditions d'Entrée :
Les signaux d'achat apparaissent lorsque le prix de clôture traverse au-dessus de la moyenne mobile simple (SMA) à 20 périodes.
Les signaux de vente apparaissent lorsque le prix de clôture traverse en dessous de la SMA à 20 périodes.
Aides Visuelles :
Lignes rouges et vertes pour indiquer les niveaux de Stop Loss et de Take Profit.
Étiquettes bleues et orange pour afficher le RRR des trades longs et courts, respectivement.
Comment Cela Fonctionne :
L'indicateur utilise l’ATR pour calculer les niveaux TP et SL :
TP : Calculé dynamiquement en fonction du ratio risque/rendement souhaité (RRR).
SL : Proportionnel au multiplicateur ATR défini par l’utilisateur.
Les signaux d’entrée sont représentés par des étiquettes "BUY" ou "SELL", tandis que les niveaux de TP/SL sont tracés sous forme de lignes horizontales.
Pourquoi Utiliser Cet Indicateur ?
Idéal pour les traders soucieux d’une gestion rigoureuse des risques.
Identifie les opportunités de trades avec des RRR favorables (par exemple, supérieurs à 1.5 ou 2.0).
Convient aux swing traders, day traders et scalpeurs souhaitant automatiser leur processus de décision.
Personnalisation :
Longueur de l’ATR : Contrôlez la sensibilité des calculs basés sur l’ATR.
Multiplicateurs ATR : Ajustez les distances TP et SL par rapport à l’ATR.
Ratio RRR souhaité : Définissez le ratio risque/rendement que vous visez.
Remarques Importantes :
Cet indicateur n’exécute pas de trades automatiquement ; il est destiné à un usage visuel et analytique uniquement.
Toujours backtester et combiner avec une analyse supplémentaire pour de meilleurs résultats.
parametre par type de trading:
1. Pour les Scalpers :
Style de trading : Trades rapides sur de petites variations de prix, souvent sur des unités de temps courtes (1 min, 5 min).
Recommandations de paramètres :
ATR Length : 7 (plus court pour réagir rapidement à la volatilité).
Multiplicateur SL : 1.0 (Stop Loss proche pour limiter les pertes).
RR souhaité : 1.5 à 2.0 (bon équilibre entre risque et récompense).
Résultat attendu : Des trades fréquents, avec une probabilité raisonnable de toucher le TP tout en limitant les pertes.
2. Pour les Day Traders :
Style de trading : Trades qui durent plusieurs heures dans la journée, souvent sur des unités de temps moyennes (15 min, 1h).
Recommandations de paramètres :
ATR Length : 14 (standard pour capturer une volatilité modérée).
Multiplicateur SL : 1.5 (Stop Loss à distance raisonnable pour supporter les fluctuations intrajournalières).
RR souhaité : 2.0 à 3.0 (ciblez une bonne récompense par rapport au risque).
Résultat attendu : Moins de trades, mais un RR élevé pour compenser les pertes potentielles.
3. Pour les Swing Traders :
Style de trading : Trades qui durent plusieurs jours, souvent sur des unités de temps longues (4h, 1 jour).
Recommandations de paramètres :
ATR Length : 20 (pour capturer des mouvements de volatilité plus larges).
Multiplicateur SL : 2.0 (Stop Loss large pour supporter des fluctuations importantes).
RR souhaité : 3.0 ou plus (ciblez de gros mouvements de prix).
Résultat attendu : Des trades moins fréquents mais potentiellement très lucratifs.
4. Pour les Actifs Volatils (Crypto, Commodités) :
Problème spécifique : Les actifs volatils ont souvent des mouvements brusques.
Recommandations de paramètres :
ATR Length : 7 ou 10 (plus court pour suivre rapidement les variations).
Multiplicateur SL : 1.5 à 2.0 (assez large pour ne pas être déclenché prématurément).
RR souhaité : 1.5 à 2.0 (favorisez des récompenses réalistes sur des mouvements volatils).
Résultat attendu : Trades qui s’adaptent à la volatilité sans sortir trop tôt.
5. Pour les Marchés Stables (Indices, Actions Blue Chip) :
Problème spécifique : Les mouvements sont souvent lents et prévisibles.
Recommandations de paramètres :
ATR Length : 14 ou 20 (capture une volatilité modérée).
Multiplicateur SL : 1.0 à 1.5 (Stop Loss serré pour maximiser l’efficacité).
RR souhaité : 2.0 à 3.0 (ciblez des ratios plus élevés sur des mouvements moins fréquents).
Résultat attendu : Maximisation des profits sur des tendances claires.
Recommandation Générale :
Si vous ne savez pas par où commencer, utilisez ces paramètres par défaut :
ATR Length : 14
Multiplicateur SL : 1.5
RR souhaité : 2.0

ORB Screener with Trailing SLThis is an extension to our already published script ORB with ATR Trailing SL indicator
Many people requested to add screener to the existing indicator but since it's slowing down the performance heavily, we decided to add this as a separate screener.
Note: This screener does NOT plot the chart and so you want to have both plotting and screener, use both scripts together.
Overview:
The ORB Screener is a TradingView indicator designed to assist traders in identifying breakout opportunities based on the Opening Range Breakout (ORB) strategy. It features multi-symbol screening, customizable session timeframes, and a detailed table for quick visual reference and stock scanning.
The ORB Screener utilizes the ORB strategy to calculate breakout levels for multiple symbols. It identifies the high and low during a specified session (e.g., first 5 minutes after market open) and provides insights on whether the price is above the high (bullish), below the low (bearish), or between the range (neutral).
Additionally, the script calculates and displays the RSI values for each symbol, aiding traders in assessing momentum alongside breakout status.
Note: One can add up to 40 symbols for screening the stocks.
Key Features and Inputs:
ORB Session Time: Define a specific timeframe (e.g., "0915-0920") during which the ORB high and low are calculated. This serves as the foundation for identifying breakouts.
Multi-Symbol Screening: Screen up to 40 symbols at once, enabling you to monitor multiple opportunities without switching charts.
Breakout Validation:
Select from two methods for confirming a breakout: Close (based on closing prices) or Touch (based on intraday highs/lows).
Breakout Status Indicators:
Above High: Indicates a current bullish breakout when the price exceeds the ORB high.
Below Low: Indicates a current bearish breakout when the price falls below the ORB low.
Between Range: Indicates no breakout (price remains within the range).
RSI Integration : Calculates the RSI for each symbol to help traders evaluate momentum alongside breakout signals.
Customizable Table Display:
Position: Place the data table at the top, middle, or bottom of the chart and align it left, center, or right.
Size: Choose from multiple table size options for optimal visibility (Auto, Huge, Large, Normal, Small, Tiny).
Visual Feedback:
Green Background: Indicates a breakout happened at least once above the ORB high.
Red Background: Indicates a breakout happened at least once below the ORB low.
Gray Background: Indicates price is within the ORB range.
Bayesian Price Projection Model [Pinescriptlabs]📊 Dynamic Price Projection Algorithm 📈
This algorithm combines **statistical calculations**, **technical analysis**, and **Bayesian theory** to forecast a future price while providing **uncertainty ranges** that represent upper and lower bounds. The calculations are designed to adjust projections by considering market **trends**, **volatility**, and the historical probabilities of reaching new highs or lows.
Here’s how it works:
🚀 Future Price Projection
A dynamic calculation estimates the future price based on three key elements:
1. **Trend**: Defines whether the market is predisposed to move up or down.
2. **Volatility**: Quantifies the magnitude of the expected change based on historical fluctuations.
3. **Time Factor**: Uses the logarithm of the projected period (`proyeccion_dias`) to adjust how time impacts the estimate.
🧠 **Bayesian Probabilistic Adjustment**
- Conditional probabilities are calculated using **Bayes' formula**:
\
This models future events using conditional information:
- **Probability of reaching a new all-time high** if the price is trending upward.
- **Probability of reaching a new all-time low** if the price is trending downward.
- These probabilities refine the future price estimate by considering:
- **Higher volatility** increases the likelihood of hitting extreme levels (highs/lows).
- **Market trends** influence the expected price movement direction.
🌟 **Volatility Calculation**
- Volatility is measured using the **ATR (Average True Range)** indicator with a 14-period window. This reflects the average amplitude of price fluctuations.
- To express volatility as a percentage, the ATR is normalized by dividing it by the closing price and multiplying it by 200.
- Volatility is then categorized into descriptive levels (e.g., **Very Low**, **Low**, **Moderate**, etc.) for better interpretation.
---
🎯 **Deviation Limits (Upper and Lower)**
- The upper and lower limits form a **projected range** around the estimated future price, providing a framework for uncertainty.
- These limits are calculated by adjusting the ATR using:
- A user-defined **multiplier** (`factor_desviacion`).
- **Bayesian probabilities** calculated earlier.
- The **square root of the projected period** (`proyeccion_dias`), incorporating the principle that uncertainty grows over time.
🔍 **Interpreting the Model**
This can be seen as a **dynamic probabilistic model** that:
- Combines **technical analysis** (trends and ATR).
- Refines probabilities using **Bayesian theory**.
- Provides a **visual projection range** to help you understand potential future price movements and associated uncertainties.
⚡ Whether you're analyzing **volatile markets** or confirming **bullish/bearish scenarios**, this tool equips you with a robust, data-driven approach! 🚀
Español :
📊 Algoritmo de Proyección de Precio Dinámico 📈
Este algoritmo combina **cálculos estadísticos**, **análisis técnico** y **la teoría de Bayes** para proyectar un precio futuro, junto con rangos de **incertidumbre** que representan los límites superior e inferior. Los cálculos están diseñados para ajustar las proyecciones considerando la **tendencia del mercado**, **volatilidad** y las probabilidades históricas de alcanzar nuevos máximos o mínimos.
Aquí se explica su funcionamiento:
🚀 **Proyección de Precio Futuro**
Se realiza un cálculo dinámico del precio futuro estimado basado en tres elementos clave:
1. **Tendencia**: Define si el mercado tiene predisposición a subir o bajar.
2. **Volatilidad**: Determina la magnitud del cambio esperado en función de las fluctuaciones históricas.
3. **Factor de Tiempo**: Usa el logaritmo del período proyectado (`proyeccion_dias`) para ajustar cómo el tiempo afecta la estimación.
🧠 **Ajuste Probabilístico con la Teoría de Bayes**
- Se calculan probabilidades condicionales mediante la fórmula de **Bayes**:
\
Esto permite modelar eventos futuros considerando información condicional:
- **Probabilidad de alcanzar un nuevo máximo histórico** si el precio sube.
- **Probabilidad de alcanzar un nuevo mínimo histórico** si el precio baja.
- Estas probabilidades ajustan la estimación del precio futuro considerando:
- **Mayor volatilidad** aumenta la probabilidad de alcanzar niveles extremos (máximos/mínimos).
- **La tendencia del mercado** afecta la dirección esperada del movimiento del precio.
🌟 **Cálculo de Volatilidad**
- La volatilidad se mide usando el indicador **ATR (Average True Range)** con un período de 14 velas. Este indicador refleja la amplitud promedio de las fluctuaciones del precio.
- Para obtener un valor porcentual, el ATR se normaliza dividiéndolo por el precio de cierre y multiplicándolo por 200.
- Además, se clasifica esta volatilidad en categorías descriptivas (e.g., **Muy Baja**, **Baja**, **Moderada**, etc.) para facilitar su interpretación.
🎯 **Límites de Desviación (Superior e Inferior)**
- Los límites superior e inferior representan un **rango proyectado** en torno al precio futuro estimado, proporcionando un marco para la incertidumbre.
- Estos límites se calculan ajustando el ATR según:
- Un **multiplicador** definido por el usuario (`factor_desviacion`).
- Las **probabilidades condicionales** calculadas previamente.
- La **raíz cuadrada del período proyectado** (`proyeccion_dias`), lo que incorpora el principio de que la incertidumbre aumenta con el tiempo.
---
🔍 **Interpretación del Modelo**
Este modelo se puede interpretar como un **modelo probabilístico dinámico** que:
- Integra **análisis técnico** (tendencias y ATR).
- Ajusta probabilidades utilizando **la teoría de Bayes**.
- Proporciona un **rango de proyección visual** para ayudarte a entender los posibles movimientos futuros del precio y su incertidumbre.
⚡ Ya sea que estés analizando **mercados volátiles** o confirmando **escenarios alcistas/bajistas**, ¡esta herramienta te ofrece un enfoque robusto y basado en datos! 🚀

Weighted CG Oscillator with ATRATR-Weighted CG Oscillator
The ATR-Weighted CG Oscillator is an enhanced version of the Center of Gravity (CG) Oscillator, originally developed by John Ehlers . By adding the Average True Range (ATR) to dynamically adjust the oscillator’s values based on market volatility, this indicator aims to make trend signals more responsive to price changes, offering an adaptive tool for trend analysis.
Functionality Overview :
The CG Oscillator, a classic trend-following indicator, has been modified here to incorporate the ATR for improved context and adaptability in different market conditions. The indicator calculates the CG Oscillator and scales it by dividing the ATR by the closing price to normalize for volatility. This creates a “weighted” CG Oscillator that generates more contextually relevant signals. A colored line shows green for long signals (above the long threshold), red for short signals (below the short threshold), and gray for neutral conditions.
Input Parameters :
CGO Length : Sets the period of the CG Oscillator calculation.
ATR Length : Determines the period of the ATR calculation. Longer periods smooth out the volatility impact.
Long Threshold : The threshold that triggers a long signal; a long (green) signal occurs when the weighted CG Oscillator crosses above this level.
Short Threshold : The threshold that triggers a short signal; a short (red) signal occurs when the weighted CG Oscillator crosses below this level.
Source : Specifies the data source for CG Oscillator calculations, with the default set to the closing price.
Recommended Use :
This indicator is designed to be an adaptive tool, not your sole resource. To ensure its effectiveness, it’s essential to backtest the indicator on your chosen asset over your preferred timeframe. Market dynamics vary, so testing the indicator’s parameters—especially the thresholds—will allow you to find the settings that best suit your strategy. While the default values work well for some scenarios, customizing the settings will help align the indicator with your unique trading style and the asset’s characteristics.

Enhanced Keltner TrendThe Enhanced Keltner Trend (EKT) indicator builds on the classic Keltner Channel, using volatility to define potential trend channels around a central moving average. It combines customizable volatility measures moving average, giving traders flexibility to adapt the trend channel to various market conditions.
How It Works?
MA Calculation:
A user-defined moving average forms the central line (or price basis) of the Keltner Channel.
Channel Width:
The width of the Keltner Channel depends on market volatility.
You can choose between two methods for measuring the volatility:
ATR-based Width: Uses the Average True Range (ATR) with customizable periods and multipliers.
Price Range Width: Uses the high and low price range over a defined period.
Trend Signal:
The trend is evaluated by price in relation to the Keltner Channel:
Bullish Trend (Blue Line): When the price crosses above the upper band, it signals upward momentum.
Bearish Trend (Orange Line): When the price crosses below the lower band, it signals downward momentum.
What Is Unique?
This Enhanced version of the Keltner Trend is for investors who want to have more control over the Keltner's channels calculation, so they can calibrate it to provide them more alpha when combined with other Technical Indicators.
Use ATR: Gives the user the choice to use the ATR for the channel width calculation, or use the default High - Low over specified period.
ATR Period: Users can modify ATR length to calculate the channels width (Volatility).
ATR Multiplier: Users can fine-tune how much of the volatility they want to factor into the channels, providing more control over the final calculation.
MA Period: Smoothing period for the Moving Averages.
MA Type: Choosing from different Moving Averages types providing different smoothing types.
Setting Alerts:
Built-in alerts for trend detection:
Bullish Trend: When price crosses the upper band, it signals a Bullish Signal (Blue Color)
Bearish Trend: When price crosses the lower band, it signals a Bearish Signal (Orange Color)
Credits to @jaggedsoft , it's a modified version of his.
ORB with ATR Trailing SL [Bluechip Algos]This is a simple ORB (Opening Range Breakout) Indicator that not only signals breakout directions based on the opening session range but also includes trailing stop levels to manage ongoing trades. Instead of regular fixed Stop loss, we use ATR indicator (ATR based SL) to trail the stop loss that might help in maximizing the profitable trades. This helps especially during the trending days where market moves unidirectionally.
About the Indicator
Opening Range Identification: The indicator defines an initial session timeframe and captures the highest and lowest prices during this period.
Breakout Signals: It signals potential entry points when the price crosses these range boundaries.
Trailing Stop Calculation: Customizable trailing stop-loss based on ATR percentage, helping users lock in profits.
Features
Session Customization: User-defined session for setting the opening range.
Entry Signal Customization: Allows configuration for breakouts on either a closing basis or upon touching the level.
Automatic Stop-Loss Adjustments: Dynamic trailing stop levels that adapt to both long and short entries.
Visual Display: Highlights breakout levels and plots lines representing stop-loss levels.
Understanding the Indicator
Range Calculation: After defining the session, the high and low of the session are locked. The high serves as the upper breakout boundary, and the low as the lower boundary.
Signals (Buy and Sell): The indicator uses crossover conditions:
Buy Signal ("B") when price crosses above the ORB high.
Sell Signal ("S") when price crosses below the ORB low.
Trail Stop Calculation: When a signal is triggered, a trailing stop level is set and updates as the trade progresses:
Long positions have a stop-loss based on a percentage below the last closing price.
Short positions have a stop-loss based on a percentage above the last closing price.
Input Parameters
Session Time (ORB Session Time): Start and end times for setting the ORB range.
Signal Configuration: Choice between "CLOSE" (signal on close) or "TOUCH" (signal as soon as level is touched).
ATR Percentage: Sets the percentage for the trailing stop calculation.
ATR Stop LossThe ATR Stop Loss indicator is designed to assist traders in managing risk by calculating dynamic stop loss levels based on the Average True Range (ATR). By considering market volatility, this tool helps identify optimal stop loss placements for both long and short positions, making it easier for traders to protect their investments and avoid premature exits.
Features:
Customizable ATR period and multiplier to adapt to different trading strategies and market conditions.
Displays stop loss levels directly on the chart for quick decision-making.
Works across various timeframes and assets, offering flexible application in diverse trading scenarios.
How It Works: The indicator calculates the ATR over a specified period and multiplies it by a user-defined value to plot stop loss levels above or below the current closing price. For long positions, the stop loss level is set below the price, while for short positions, it is set above. These levels help traders set stops that account for current market volatility, reducing the likelihood of getting stopped out by minor fluctuations.
Usage: Add the ATR Stop Loss indicator to your chart, customize the ATR period and multiplier as needed, and use the visualized stop loss levels to manage your trades with greater precision and confidence.
Disclaimer: The ATR Stop Loss indicator is provided for educational and informational purposes only and should not be construed as financial or investment advice. Trading involves substantial risk and is not suitable for every investor. Users are solely responsible for any trading decisions they make based on the use of this indicator. Past performance is not indicative of future results. Always conduct your own analysis and consult with a qualified financial professional before making any trading decisions. EdgeLab and its creator bear no liability for any financial losses or other damages resulting from the use of this indicator.

Multi-Timeframe Supertrend Dashboard - EnhancedOverview
The Multi-Timeframe Supertrend Dashboard is a powerful tool designed to give traders a clear view of market trends across multiple timeframes, all from a single dashboard. This indicator leverages the Supertrend method to calculate buy and sell signals based on the direction of price relative to dynamically calculated support and resistance lines. The dashboard is optimized for dark mode and provides easy-to-interpret color-coded signals for each timeframe.
How It Works
The Supertrend indicator is a trend-following indicator that uses the Average True Range (ATR) to set upper and lower bands around the price, adapting dynamically as volatility changes. When the price is above the Supertrend line, the market is considered in an uptrend, triggering a "BUY" signal. Conversely, when the price falls below the Supertrend line, the market is in a downtrend, triggering a "SELL" signal.
This Multi-Timeframe Supertrend Dashboard calculates Supertrend signals for the following timeframes:
1 minute
5 minutes
15 minutes
1 hour
Daily
Weekly
Monthly
For each timeframe, the dashboard shows either a "BUY" or "SELL" signal, allowing traders to assess whether trends align across timeframes. A "BUY" signal displays in green, and a "SELL" signal displays in red, giving a quick visual reference of the overall trend direction for each timeframe.
Customization Options
ATR Period: Defines the period for the Average True Range (ATR) calculation, which determines how responsive the Supertrend lines are to changes in market volatility.
Multiplier: Sets the sensitivity of the Supertrend bands to price movements. Higher values make the bands less sensitive, while lower values increase sensitivity, allowing quicker reactions to changes in price.
How to Interpret the Dashboard
The Multi-Timeframe Supertrend Dashboard allows traders to see at a glance if trends across multiple timeframes are aligned. Here’s how to interpret the signals:
BUY (Green): The current timeframe’s price is in an uptrend based on the Supertrend calculation.
SELL (Red): The current timeframe’s price is in a downtrend based on the Supertrend calculation.
For example:
If all timeframes display "BUY," the asset is in a strong uptrend across multiple time horizons, which may indicate a bullish market.
If all timeframes display "SELL," the asset is likely in a strong downtrend, signaling a bearish market.
Mixed signals across timeframes suggest market consolidation or differing trends across short- and long-term periods.
Use Cases
Trend Confirmation: Use the dashboard to confirm trends across multiple timeframes before entering or exiting a position.
Quick Market Analysis: Get a snapshot of market conditions across timeframes without having to change charts.
Multi-Timeframe Alignment: Identify alignment across timeframes, which is often a strong indicator of market momentum in one direction.
Dark Mode Optimization
The dashboard has been optimized for dark mode, with white text and contrasting background colors to ensure easy readability on darker TradingView themes.

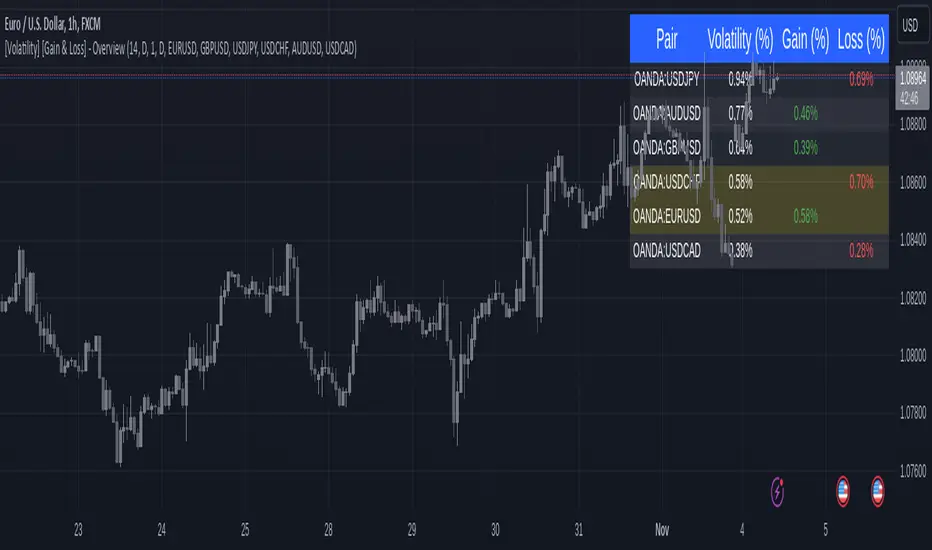
[Volatility] [Gain & Loss] - OverviewFX:EURUSD
Indicator Overview: Volatility & Gain/Loss - Forex Pair Analysis
This indicator, " —Overview" , is designed for users interested in analyzing the volatility and gain/loss metrics of multiple forex pairs. The tool is especially useful for traders aiming to assess currency pair volatility alongside gain and loss percentages over selected periods. It enables a clearer understanding of pair behavior and aids in decision-making.
Key Features
Customizable Volatility and Gain/Loss Periods : Define your preferred calculation periods and timeframes for both volatility and gain/loss to tailor the indicator to specific trading strategies. Multi-Pair Analysis : This indicator supports up to six forex pairs (default pairs include EURUSD, GBPUSD, USDJPY, USDCHF, AUDUSD, and USDCAD) and allows you to adjust these pairs as needed. Visual Ranking : Forex pairs are sorted by volatility, displaying the highest pairs at the top for quick reference. Top Gain/Loss Highlighting : The pair with the maximum gain and the pair with the maximum loss are highlighted in the table, making it easy to identify the best and worst performers at a glance.
Indicator Settings
Volatility Settings : Period : Adjust the number of periods used in the ATR (Average True Range) calculation. A default period of 14 is set. Timeframe : Select a timeframe (e.g., Daily, Weekly) for volatility calculation to match your analysis preference.
Gain/Loss Settings : Period : Choose the number of periods for gain/loss calculation. The default is set to 1. Timeframe : Select the timeframe for gain/loss calculation, independent of the volatility timeframe.
Symbol Selection : Configure up to six forex pairs. By default, popular forex pairs are pre-loaded but can be customized to include other currency pairs.
Output and Visualization
Table Display : This indicator displays data in a neatly structured table positioned in the top-right corner of your chart. Columns : Includes columns for the Forex Pair, Volatility Percentage, Gain Percentage, and Loss Percentage. Color Coding : Volatility is displayed in a standard color for clear readability. Gain values are highlighted in green, and Loss values are highlighted in red, allowing for quick visual differentiation. Highlighting : Rows representing the pair with the highest gain and the pair with the most significant loss are especially highlighted for emphasis.
How to Use
Volatility Analysis : This metric gives insight into the average price range movements for each pair over the specified period and timeframe, helping you evaluate the potential for rapid price changes. Gain/Loss Tracking : Gain or loss percentages show the pair's recent performance, allowing you to observe whether a currency pair is trending positively or negatively over the chosen period. Comparative Pair Ranking : Use the table to identify pairs with the highest volatility and extremes in gain or loss to guide trading decisions based on market conditions.
Ideal For
Swing Traders and Day Traders looking to understand short-term market fluctuations in currency pairs. Risk Management : Helps traders gauge pairs with higher risk (volatility) and recent performance (gain/loss) for informed position sizing and risk control.
This indicator is a comprehensive tool for visualizing and analyzing key forex pairs, making it an essential addition for traders looking to stay updated on volatility trends and recent price changes.
Entropy-Based Adaptive SuperTrendOverview:
Introducing the Entropy-Based Adaptive SuperTrend – a groundbreaking trading indicator designed to adapt dynamically to market conditions using market entropy. This enhanced SuperTrend indicator adjusts its sensitivity according to the level of chaos (or order) in price movements, providing more stable signals during volatile periods and more responsive signals when the market becomes orderly.
Key Features:
Entropy-Adaptive Mechanism: By incorporating an entropy measure, this indicator estimates the degree of unpredictability in the market. During high entropy periods (more chaotic), signals are made less sensitive, while during low entropy periods, the indicator reacts more quickly to price changes.
Adaptive ATR Multiplier: Unlike traditional SuperTrend indicators that use a fixed ATR multiplier, this version calculates a dynamic ATR multiplier based on the entropy score, ensuring more flexibility and adaptability in setting stop levels.
Visual Clarity: The indicator is overlayed on the price chart with customizable visual elements. The bullish and bearish trends are color-coded for ease of use, and optional entry signals ("L" for long and "S" for short) are plotted to clearly mark potential entry opportunities.
Alerts for Key Opportunities : Never miss an opportunity with built-in alerts for buy and sell signals. Traders can easily configure these alerts to be notified instantly when market conditions trigger a new trend.
How It Works:
Entropy Calculation: The entropy of the price data is calculated over a user-defined period, giving an indication of the degree of randomness in the price movements. The result is then smoothed to reduce noise and create a meaningful trend indication.
Dynamic ATR Adjustment: The ATR (Average True Range) multiplier, which controls the distance of the trailing stop, is adjusted based on the entropy score. This allows the SuperTrend line to widen in chaotic times, reducing false signals, while tightening in orderly times, allowing quicker trend captures.
Parameters Explained:
Entropy Settings: Control the sensitivity of entropy calculations, including the look-back period, number of bins for price distribution, and smoothing length.
Adaptive Settings: Adjust how the indicator adapts to different levels of entropy, including the adaptation period and the filtering weight.
SuperTrend Settings : Customize the ATR period and the dynamic multiplier range to fine-tune the trailing stops for your trading style.
Visual Settings: Choose your preferred colors for bullish and bearish trends, and decide if you want the entry labels displayed directly on the chart.
Use Cases:
Swing Traders can utilize the indicator to capture trend reversals while filtering out the noise during high entropy periods.
Intraday Traders can adapt the settings for shorter time frames to benefit from dynamic adjustments that reduce overtrading and false signals.
Risk Management: The entropy-based adaptive feature provides an edge in risk management by reducing sensitivity during times of increased chaos, thus helping to limit unnecessary trades.
How to Use It:
Look for entry labels ("L" for long, "S" for short) to identify potential opportunities.
Use the color-coded trendlines to determine market bias: greenish hue for bullish trends, reddish hue for bearish trends.
Customize the input settings to align with your preferred market timeframe and risk profile.
Alerts & Notifications:
Built-in alerts notify you of significant trend changes. Simply enable these alerts to receive updates when a new long or short opportunity is detected, helping you stay ahead without needing to watch the screen constantly.
Customization Tips:
Longer Timeframes : Increase the Entropy Period to better capture macro trends in high timeframe charts.
Higher Volatility Markets: Increase the ATR Max Multiplier to ensure stops are set farther away during high entropy.
Lower Volatility Markets: Use a lower ATR Base Multiplier and tighter entropy thresholds to capture rapid price movements.
Final Thoughts:
The Entropy-Based Adaptive SuperTrend indicator merges traditional trend-following logic with an adaptive mechanism driven by market entropy, aiming to address the challenges of whipsaws and false signals common in conventional SuperTrend setups. This indicator offers an intelligent and flexible way to track market trends, suitable for both beginners and experienced trade

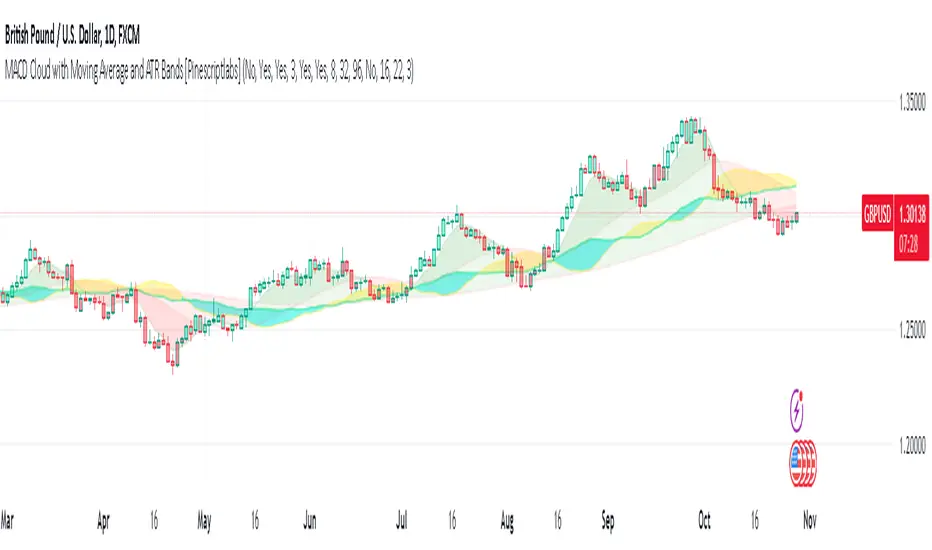
MACD Cloud with Moving Average and ATR BandsThe algorithm implements a technical analysis indicator that combines the MACD Cloud, Moving Averages (MA), and volatility bands (ATR) to provide signals on market trends and potential reversal points. It is divided into several sections:
🎨 Color Bars:
Activated based on user input.
Controls bar color display according to price relative to ATR levels and moving average (MA).
Logic:
⚫ Black: Potential bearish reversal (price above the upper ATR band).
🔵 Blue: Potential bullish reversal (price below the lower ATR band).
o
🟢 Green: Bullish trend (price between the MA and upper ATR band).
o
🔴 Red: Bearish trend (price between the lower ATR band and MA).
o
📊 MACD Bars:
Description:
The MACD Bars section is activated by default and can be modified based on user input.
🔴 Red: Indicates a bearish trend, shown when the MACD line is below the Signal line (Signal line is a moving average of MACD).
🔵 Blue: Indicates a bullish trend, shown when the MACD line is above the Signal line.
Matching colors between MACD Bars and MACD Cloud visually confirms trend direction.
MACD Cloud Logic: The MACD Cloud is based on Moving Average Convergence Divergence (MACD), a momentum indicator showing the relationship between two moving averages of price.
MACD and Signal Lines: The cloud visualizes the MACD line relative to the Signal line. If the MACD line is above the Signal line, it indicates a potential bullish trend, while below it suggests a potential bearish trend.
☁️ MA Cloud:
The MA Cloud uses three moving averages to analyze price direction:
Moving Average Relationship: Three MAs of different periods are plotted. The cloud turns green when the shorter MA is above the longer MA, indicating an uptrend, and red when below, suggesting a downtrend.
Trend Visualization: This graphical representation shows the trend direction.
📉 ATR Bands:
The ATR bands calculate overbought and oversold limits using a weighted moving average (WMA) and ATR.
Center (matr): Shows general trend; prices above suggest an uptrend, while below indicate a downtrend.
Up ATR 1: Marks the first overbought level, suggesting a potential bearish reversal if the price moves above this band.
Down ATR 1: Marks the first oversold level, suggesting a possible bullish reversal if the price moves below this band.
Up ATR 2: Extends the overbought range to an extreme, reinforcing the possibility of a bearish reversal at this level.
Down ATR 2: Extends the oversold range to an extreme, indicating a stronger bullish reversal possibility if price reaches here.
Español:
El algoritmo implementa un indicador de análisis técnico que combina la nube MACD, promedios móviles (MA) y bandas de volatilidad (ATR) para proporcionar señales sobre tendencias del mercado y posibles puntos de reversión. Se divide en varias secciones:
🎨 Barras de Color:
- Activado según la entrada del usuario.
- Controla la visualización del color de las barras según el precio en relación con los niveles de ATR y el promedio móvil (MA).
- **Lógica:**
- ⚫ **Negro**: Reversión bajista potencial (precio por encima de la banda superior ATR).
- 🔵 **Azul**: Reversión alcista potencial (precio por debajo de la banda inferior ATR).
- 🟢 **Verde**: Tendencia alcista (precio entre el MA y la banda superior ATR).
- 🔴 **Rojo**: Tendencia bajista (precio entre la banda inferior ATR y el MA).
### 📊 Barras MACD:
- **Descripción**:
- La sección de barras MACD se activa por defecto y puede modificarse según la entrada del usuario.
- 🔴 **Rojo**: Indica una tendencia bajista, cuando la línea MACD está por debajo de la línea de señal (la línea de señal es una media móvil de la MACD).
- 🔵 **Azul**: Indica una tendencia alcista, cuando la línea MACD está por encima de la línea de señal.
- La coincidencia de colores entre las barras MACD y la nube MACD confirma visualmente la dirección de la tendencia.
### 🌥️ Nube MACD:
- **Lógica de la Nube MACD**: Basada en el indicador de convergencia-divergencia de medias móviles (MACD), que muestra la relación entre dos medias móviles del precio.
- **Líneas MACD y de Señal**: La nube visualiza la relación entre la línea MACD y la línea de señal. Si la línea MACD está por encima de la de señal, indica una tendencia alcista potencial; si está por debajo, sugiere una tendencia bajista.
### ☁️ Nube MA:
- **Relación entre Medias Móviles**: Se trazan tres medias móviles de diferentes períodos. La nube se vuelve verde cuando la media más corta está por encima de la más larga, indicando una tendencia alcista, y roja cuando está por debajo, sugiriendo una tendencia bajista.
- **Visualización de Tendencias**: Proporciona una representación gráfica de la dirección de la tendencia.
### 📉 Bandas ATR:
- Las bandas ATR calculan límites de sobrecompra y sobreventa usando una media ponderada y el ATR.
- **Centro (matr)**: Muestra la tendencia general; precios por encima indican tendencia alcista y debajo, bajista.
- **Up ATR 1**: Marca el primer nivel de sobrecompra, sugiriendo una reversión bajista potencial si el precio sube por encima de esta banda.
- **Down ATR 1**: Marca el primer nivel de sobreventa, sugiriendo una reversión alcista potencial si el precio baja por debajo de esta banda.
- **Up ATR 2**: Amplía el rango de sobrecompra a un nivel extremo, reforzando la posibilidad de reversión bajista.
- **Down ATR 2**: Extiende el rango de sobreventa a un nivel extremo, sugiriendo una reversión alcista más fuerte si el precio alcanza esta banda.
Atr Target TP & Protecion Zone [Pinescriptlabs]This indicator provides an adaptive trailing stop system with dynamic price targets and protection zones, ideal for position management.
Main Features:
🚦 ADAPTIVE TRAILING STOP:
Automatically adjusts based on volatility (ATR) and volume
Two modes: "Modified" and "UnModified" for true range calculation
Displayed as a line with colored background (green for longs, red for shorts)
🎯 TARGET ZONES (T1 & T2):
Calculates two target zones (T1 and T2) based on:
Market strength (combination of RSI, volume, MFI, ADX, MACD)
Current volatility (ATR)
Distance from current price
Visualized with blue boxes (T1) and purple boxes (T2)
🛡️ PROTECTION ZONE:
Automatically activates in sideways markets
Provides an additional buffer to the trailing stop
Helps avoid premature exits in volatile markets
📊 INFORMATION PANELS:
Top Right Panel displays:
Current trend direction
Target status (T1 & T2)
Market strength
Current ATR
RSI level
Bottom Right Panel displays:
Trailing status (WIDE/NORMAL)
Volume impact
Directional strength
Protection zone status
Español:
Este indicador proporciona un sistema de trailing stop adaptativo con objetivos de precio dinámicos y zonas de protección, ideal para la gestión de posiciones.
**Características Principales**:
🚦 **TRAILING STOP ADAPTATIVO**:
- Se ajusta automáticamente según la volatilidad (ATR) y el volumen
- Dos modos: "Modified" y "UnModified" para el cálculo del rango verdadero
- Se visualiza como una línea con fondo coloreado (verde para largos, rojo para cortos)
🎯 **ZONAS OBJETIVO (T1 y T2)**:
- Calcula dos zonas objetivo (T1 y T2) basadas en:
- Fuerza del mercado (combinación de RSI, volumen, MFI, ADX, MACD)
- Volatilidad actual (ATR)
- Distancia al precio actual
- Visualización mediante cajas azules (T1) y moradas (T2)
🛡️ **ZONA DE PROTECCIÓN**:
- Se activa automáticamente en mercados laterales
- Proporciona un buffer adicional al trailing stop
- Ayuda a evitar salidas prematuras en mercados volátiles
📊 **PANELES INFORMATIVOS**:
*Panel Superior Derecho* muestra:
- Dirección de la tendencia actual
- Estado de los objetivos (T1 y T2)
- Fuerza del mercado
- ATR actual
- Nivel de RSI
*Panel Inferior Derecho* muestra:
- Estado del trailing (WIDE/NORMAL)
- Impacto del volumen
- Fuerza direccional
- Estado de la zona de protección

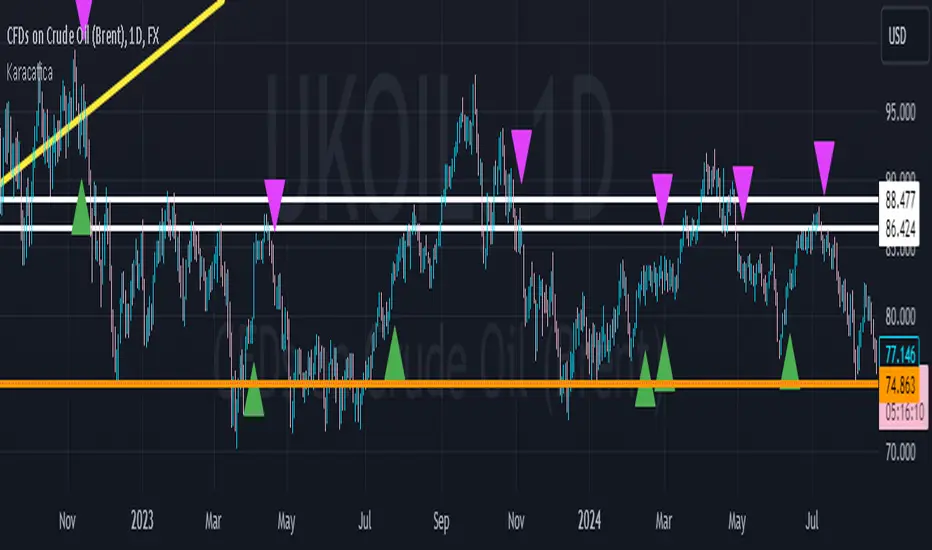
KaracaticaKaracatica Indicator - Dynamic Trend Following.
The Karacatica Indicator is designed for traders looking for a comprehensive approach to trend trading by combining directional movements and Average True Range (ATR).
Key Features: ATR-Based Trend Detection: The indicator uses Average True Range (ATR) to measure market volatility and integrates with price action to capture strong trend movements.
Directional Indicators (DI's): Calculates DI's (Positive Directional Index Di+ and Negative Directional Index Di-) to compare buying and selling pressure. This allows for more accurate trend identification, highlighting when buyers or sellers dominate.
Signal Generation: Buy Signal: Generated when price action is bullish (close is above the previous period's close) and DI+ exceeds DI-, indicating that buyers are in control.
Sell Signal: Triggered when price action is bearish (close is below the previous period’s close) and DI- exceeds DI+, showing that sellers dominate the market.
Visual Signals: Green triangle (▲) indicating a buy opportunity, plotted below the bar.
Fuchsia triangle (▼) signaling a sell opportunity, plotted above the bar.
Customizable Inputs: The indicator allows users to adjust the ATR period, DI length, and ADX smoothing parameters, giving it the flexibility to suit different trading styles and timeframes.
Why should you use it?
This indicator simplifies the process of analyzing the combination market direction and trend strength. It is especially useful for traders who like strong directional movements and want clear, visually represented entry signals. The Karacatica Indicator can generate good buy or sell signals in trading and can be used on multiple assets and timeframes, making it adaptable to different market conditions.
Settings Overview: ATR Period: Sets the period for calculating ATR, used to determine market volatility.
DI Length: The length of the lookback period for DI+ and DI- calculations.
ADX Smoothing: Smooths the ADX (Average Directional Index) to reduce noise.
Feel free to experiment with this indicator, share feedback, and adapt it to your trading strategy. Good trading!