New Alerts Allow for Dynamic Messageswww.tradingview.com
Following the last example from the link above, I added a function return to plot the calculated RSI value for each ticker.
For this, I added the expression of the rsi bult-in function in the security call, to send as a return to the plot function.
Ps. I purposely inverted the crossunder/crossover calls for testing here.
Alerts

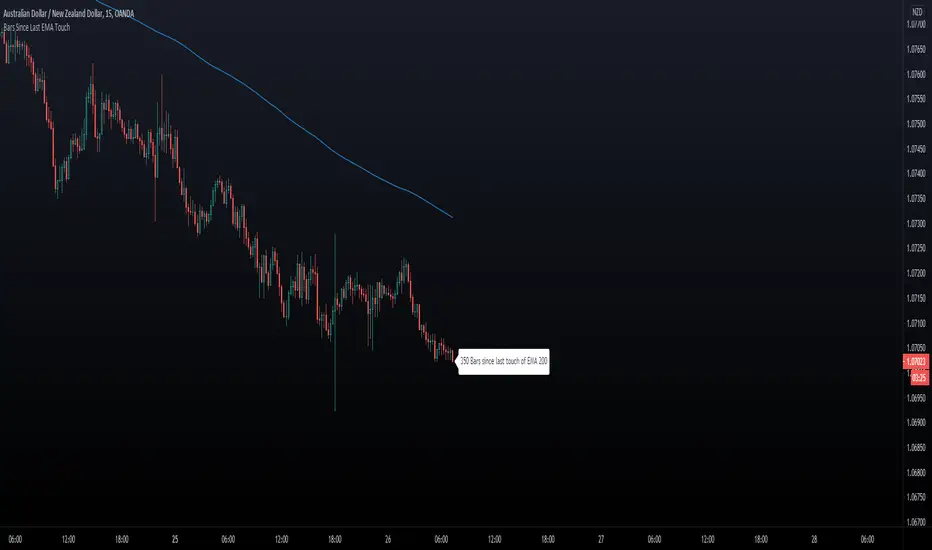
Bars Since Last EMA Touch
This indicator keeps track of how many bars since price touched any EMA last time. You can for example
set 200 EMA. Tell the script to send an alert if/when 400 bars has been reached away from the EMA 200.
- You can hide/show The EMA Line.
- You can hide/show bar Count.
- You can set X bars from EMA to get Alert.
- You can change color of The Badge and EMA line to fit your background colors.
Enjoy!
Another Indicator From The Hunter Trading Group
TradingView Alerts to MT4 MT5 - Forex, indices, commoditiesHowdy Algo-Traders! This example script has been created for educational purposes - to present how to use and automatically execute TradingView Alerts on real markets.
I'm posting this script today for a reason. TradingView has just released a new feature of the PineScript language - ALERT() function. Why is it important? It is finally possible to set alerts inside PineScript strategy-type script, without the need to convert the script into study-type. You may say triggering alerts straight from strategies was possible in PineScript before (since June 2020), but it had its limitations. Starting today you can attach alert to any custom event you might want to include in your PineScript code.
With the new feature, it is easier not only to execute strategies, but to maintain codebase - having to update 2 versions of the code with each single modification was... ahem... inconvenient. Moreover, the need to convert strategy into study also meant it was required to rip the code from all strategy...() calls, which carried a lot of useful information, like entry price, position size, and more, definitely influencing results calculated by strategy backtest. So the strategy without these features very likely produced different results than with them. While it was possible to convert these features into study with some advanced "coding gymnastics", it was also quite difficult to test whether those gymnastics didn't introduce serious, bankrupting bugs.
//////
How does this new feature work? It is really simple. On your custom events in the code like "GoLong" or "GoShort", create a string variable containing all the values you need inside your alert and this string variable will be your alert's message. Then, invoke brand new alert() function and that's it (see lines 67 onwards in the script). Set it up in CreateAlert popup and enjoy. Alerts will trigger on candle close as freq= parameter specifies. Detailed specification of the new alert() function can be found in TradingView's PineScript Reference (www.tradingview.com), but there's nothing more than message= and freq= parameters. Nothing else is needed, it is very simple. Yet powerful :)
//////
Alert syntax in this script is prepared to work with TradingConnector. Strategy here is not too complex, but also not the most basic one: it includes full exits, partial exits, stop-losses and it also utilizes dynamic variables calculated by the code (such as stop-loss price). This is only an example use case, because you could handle variety of other functionalities as well: conditional entries, pending entries, pyramiding, hedging, moving stop-loss to break-even, delivering alerts to multiple brokers and more.
//////
This script is a spin-off from my previous work, posted over a year ago here: Some comments on strategy parameters have been discussed there, but let me copy-paste most important points:
* Commission is taken into consideration.
* Slippage is intentionally left at 0. Due to shorter than 1 second delivery time of TradingConnector, slippage is practically non-existing.
* This strategy is NON-REPAINTING and uses NO TRAILING-STOP or any other feature known to be causing problems.
* The strategy was backtested on EURUSD 6h timeframe, will perform differently on other markets and timeframes.
Despite the fact this strategy seems to be still profitable, it is not guaranteed it will continue to perform well in the future. Remember the no.1 rule of backtesting - no matter how profitable and good looking a script is, it only tells about the past. There is zero guarantee the same strategy will get similar results in the future.
Full specs of TradingView alerts and how to set them up can be found here: www.tradingview.com

EMA CrossoversUseful for identifying and receiving alerts about uptrends and downtrends.
This script uses two Exponential Moving Averages (EMAs) to find price uptrends and downtrends. An Exponential Moving Average (EMA) is a type of moving average that places a greater weight and significance on the most recent data points. The script produces uptrend and downtrend signals based on crossovers and divergences between the two EMAs, the user will be able to spot a trend change (when the EMAs crossover) and to determine the strength of the current trend (when the EMAs diverge). It is also posible to get alerts for uptrends and downtrends on the web and mobile app with sound and pop-ups as well as via email. The optimal time to enter and exit the market can be concluded from this trend changes.
The user can set their own EMAs, by default they are set to 21 and 55 periods for medium and long term respectively. When the medium term EMA crosses below the long term EMA the asset is in a downtrend and the price will decline, and when the medium term EMA crosses above the long term EMA the asset is in an uptrend and price will increase.
This scripts plots the following indicators and signals on the chart to help the user to identify trends:
1.- Medium and long term EMAs as lines overlaid on the price chart.
2.- Up green triangles above bars when the price is on an uptrend and down red triangles below bars when the price is on a downtrend.
3.- Arrows with text to indicate the start of an uptrend or downtrend.
The user can enable and disable the indicators and signals as well as set colors and shapes to their liking.
This script also lets the user create alerts for uptrends and downtrends. To create a new alert using this script follow this instructions:
1.- Once you added this script to your chart, go to the alerts panel (right on web or bottom tool bar on the mobile app) and add a new alert (alarm clock icon with a plus sign).
2.- A modal window will open. On the “Condition” dropdown menu select “EMA Crossovers”.
3.- On the next dropdown menu (right below the “Condition” one) you can select from two types of alerts “Uptrend started” and “Downtrend started”.
4.- Lastly you can set all the normal alert options and create the alert.

SRSI/CCI :: ALLinPower v10.0
Everything you see in this indicator has beed designed with purpose to ease your trading with visual technical analysis of the market. It pulls data from 7 different TimeFrames and it can not be more simpler visual representation of its calculations when applied on chart.
When applied on chart, you will see two sets of WAVES. First set is made out of SRSI calculation and the second is made out of CCI calculation. Both of them follows the same rules.
Background GREEN/RED wave is made out of Multiple Timeframes and it represents a TREND. GREEN for LONG, RED for SHORT trend.
Over the background wave there is a wave made of current TimeFrame data and its main purpose is to see when the POWER of certain direction will diminish. The less time little wave stays in current trend the more likely is that it will change the trend based on lack of power the market is getting in certain direction.
HOW TO USE IT?
Rule 1.
TIMEFRAMES
Choose the best TimeFrame for the job. I use: 1min, 2min, 3min, 5min, 8min, 13min, 21min, 34min or 56min (golden ratio). You can also pick a different TF but only to up to 1h TF chart as it does not work well with TF over 1h. Smaller TF is used for SCALPING of DAY TRADING higher TF is used for SWING TRADING. You get the picture?
Rule 2
TO ENTER BUY/LONG POSITION: When big trend wave is below the middle line and coloured in RED and little wave just entered the area and exits it very soon after. Basically when RED straight line gets smaller and smaller (the POWER of SHORT diminishes) it is a sign for LONG.
TO ENTER SELL/SHORT POSITION: When big trend wave is over the middle line and coloured in GREEN and little wave just entered the area and exits it very soon after. Basically when GREEN straight line gets smaller and smaller (the POWER of LONG diminishes) it is a sign for SHORT.
To ease yourself the spotting of this instances just follow the GREEN/RED dots and use ALERTS (choose BUY POWER for LONG signals or choose SELL POWER for SHORT signals) to make yourself free from staring at a computer/mobile all the time and just wait for a signal.
Rule 3
CAUTION
Do not rush to enter a position and try to predict what indicator will do next. It does not end well.
Be aware you are not exiting a position in panic that would be too soon or even worse, you get married to bad trade and you are not exiting even though you should exit by many signals you get.
Use risk management strategy to protect your capital.
Follow the rules and make your trading easier and better.

ALERTS :: ALLinDivergence v10.0
Everything you see in this indicator has a designated purpose to ease your trading with predefined ALERTS of high quality. It pulls data from 7 different TimeFrames and it can not be more simpler visual representation of its calculations when applied on chart.
When applied on chart, it will colour your chart BARS/CANDLE to the colour PURPLE as that colour is well known colour of Relative Strength Indicator line that indicates overbought or oversold area. RSI is used as a main source of information/data for this indicator.
Second reason of colour PURPLE is that it cancels all the noise that default green/red bars have.
This indicator also has GREEN/RED colouring of BARS/CANDLES and they appear when something crucial is happening in the market. That something needs to be checked ASAP. This green/red coloured bars are just there to remind you that something can happen and it does not mean that market would actually change direction it is just a "friendly warning" you can use when creating alerts.
The best thing about this indicator is those full coloured GREEN/RED LITTLE DOTS.
They represent DIVERGENCES emerging and possible actual change of market direction. To be sure, you need to analyse your chart more in depth any way you prefer to get your needed confirmations. To do that, use your strategy that you have been using when trading up until now or even better, use indicator that I made and is called RSI :: ALLinDivergence v 10.0 -> It is a visual representation of ALERT :: ALLinDivergence v 10.0 indicator signals. Very easy to analyse in minutes.
HOW TO USE IT?
Rule 1.
TIMEFRAMES
Choose the best TimeFrame for the job. I use: 1min, 2min, 3min, 5min, 8min, 13min, 21min, 34min or 56min (golden ratio). You can also pick a different TF but only to up to 1h TF chart as it does not work well with TF over 1h. Smaller TF is used for SCALPING of DAY TRADING higher TF is used for SWING TRADING. You get the picture?
Rule 2
To ENTER A POSITION
Find the best TF that suits your needs. That depends on your trading style (day trading, scalping, swing trading, ect.). To know which TF is the best for you you also need to look for a good quality signals when looking the chart in the past (visual BACKTESTING). Signals from past should yield positive results.
When you wish to trade certain pair, find the best TF and from there you need to "Create Alert". Choose this indicator when creating alerts and from dropdown menu pick "GREEN" for Divergence BUY/LONG signals or "RED" Divergence SELL/SHORT signals. Then choose "Greater Than" and change the value to "1" (that will set off the alarm), choose how you want to be notified and then name the ALERT so you will know how it is made.
Do not forget to do your work and analyse your market situation best way you can and get needed confirmations before doing anything about it.
Rule 3
TO EXIT A POSITION
From the same TF as Divergence alerts are made from (Rule 2), you can make alerts that are just a "friendly warning" that something is happening on the market you are in an opened position. Instead of picking GREEN or RED from dropdown menu when creating alerts, you need to pick GREEN BARS or RED BARS and the rest is the same as with rule 2.
Rule 4
CONFIRMATIONS
Help yourself with any type of analysis you need to get the confirmations you need to enter or exit the position. Use the style you always have up until now. Or find a better one that is quicker and with good yield.
There is a great option that can change your way of thinking about trading and it is called RSI :: ALLinDivergence v 10.0 indicator that is used as a visual representation of ALERTS indicator. It takes literally minutes to do whole analysis - remember it uses data from 7 different TimeFrames and it is really good! Just find LowerHighs of RSI curve for SHORT or HigherLows for LONG.

Modified Smoothed Heiken AshiThis code is based on Smoothed HA candle which will work on all chart types
condition for BUY:
1. When close crosses Smoothed HA
2.Close should be in side upper band
3.BBW must be greater than the average
vice versa for sell
this code takes data from HA chart so that it can be applied on all chart type.
Bollinger band and Bollinger band width conditions added for removal of unwanted signals
Alert added so that you can apply alert and check it in real time performance
thanks to The Secret Mindset You tube channel from where I got the idea to convert this into a pine script indicator
smooth HA taken from "Smoothed Heiken Ashi Candles v1" at //@jackvmk

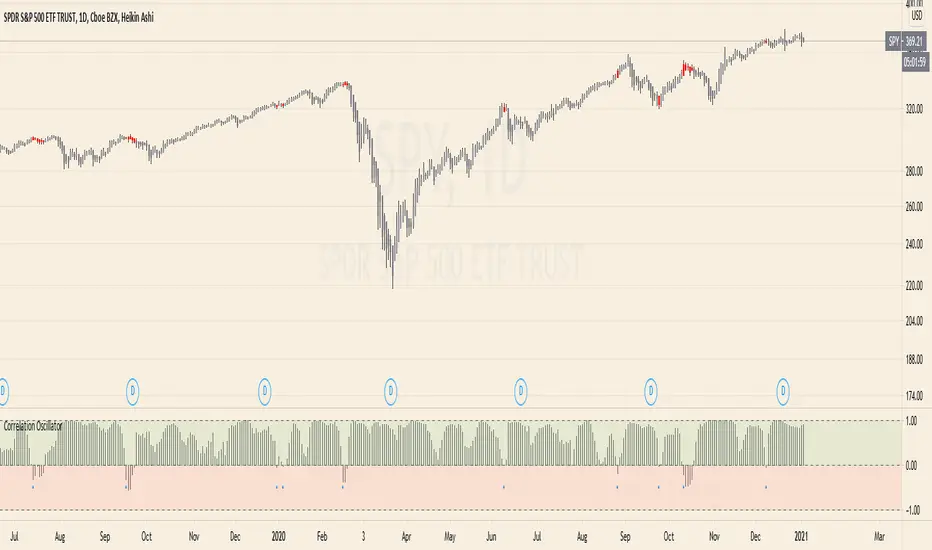
Correlation Oscillator - Anomaly AlertsThis script plots the correlation for two symbols as an oscillator:
A correlation of 1 means that both values move in the same direction together.
A correlation of -1 means that both values are perfectly negative correlated.
Parameter:
Length of the Correlation
The two symbols you want to calculate the correlation for
Barcolor: Defines whether Bar-coloring is set on.
The Number of bars lookback for anomaly: Say both are normally positively correlated it is an anomaly when the correlation turns negative and vica-versa.
Alerts: You can also set an Alert when an anomaly is detected.(blue dots on oscillator)
This has many use-cases:
For example VVIX and VIX are normally positive correlated.
When this turns negative, this can mean that we are on a turning point:
--> VVIX is rising while VIX is falling, risk of future Volatility is increasing (Top)
--> VIX is rising while VVIX is falling, risk of future Volatility is decreasing (Bottom)
Another use-case is just checking the correlation of stocks in your portfolio to diversify.
Open Close Cross Strategy R6.1 revised by yourmattieOriginal version: Open Close Cross Strategy R5 revised by JustUncle.
Change: script changed to a study script with custom alerts.
This revision is an open Public release, with just some minor changes. It is a revision of the Strategy "Open Close Cross Strategy R2" originally published by @JayRogers.
Revised by JustUncleL
Description :
Strategy based around Open-Close Moving Average Crossovers optionally from a higher time frame.
Read more about the indicator original script
Klik here
##USE AT YOUR OWN RISK##
Use this as overlayer on the original strategy to set custom alerts.
Info: with this study script no buy/sell arrows show up op the chart.
Does some know a solution for this issue:
Issue: sometimes it gives a false signal because even when you set "one per bar close" the custom set alert might come halfway the bar....and it might be a false signal when the bar is closed
Does somone know a fix for this? I tried with barstate.iscomfirmed but it didn't work for me.
Ps. I'm not a developer...just changed the scipt by watching a youtube tutorial.
MACD With Trend Filter: Visual Backtest Module TemplateSample Strategy: MACD Crossover with trend filter options
MA Filter : Price Close Above MA, Search for Buy, Price Close Below MA, Search for Sell
ADX Filter : Take trade only when ADX is above certain treshold
MACD Signal : MACD Cross above signal line while under 0 line indicate Buy Signal
MACD Cross below signal line while above 0 line indicate Sell Signal
-----------------------------
Using Alert Module:
Enable Alert --> Enable TV's alert and plot signal to chart
Alert Type --> Set to take Buy only, Sell only or Both alert
----------------------------
Using Backtest Module:
Enable Backtest --> Enable Backtest simulation
Backtest Type --> Set to take Buy only, Sell only or Both
SL Type -->
ATR : Set SL in ATR times Multiplier below/above entry price
Fixed : Set SL in fixed point below entry point (in 'Dollar'). e.g. for Stocks -> 0.5 equals to 50cent while for EURUSD currency -> 0.005 equal to 50 pips
HiLo Bar : Set SL at highest/lowest wick of previous bar plus/minus Fixed point. e.g. EURUSD HiLo=3 and Fixed Point = 0.0005, buy trade will place SL 5 Pips below lowest of previous 3 bar
SL ATR Period --> Set Lookback Period used for SL's ATR calculation
SL ATR Multi --> Set ATR Multiplier for SL
SL Fixed --> Set Fixed Level for SL (Use when SL Type is either Fixed or HiLo Bar)
SL Bar --> Set Number of previous bar to check for SL placement
TP RR Ratio --> Set TP based on RR multiplier. e.g. 2 means TP level will be twice further from entry point compared to Entry-SL distance.
Notes: The point is for preliminary testing, so it only supports 1 trade at a time and no Trailing Stop
----------------------------
Disclaimer:
This script main objective is to create my personal indicator template so that i just have to modify the indicator module for preliminary testing in future.
Testing Alert Module so i can re-use it as template in future study/indicator
Testing Visual Backtest Module so i can re-use it as template in future study/indicator
i believe using Strategy function is a better approach for this but the entry/exit level seems to be hit n miss (at least for me, still trying to figure what i did wrong)
also, i rather code the strategy in other platform where i can use the more accurate tick data if i want to validate backtest statistics.
My study scripts was built only to test/visualize an idea to see its viability and if it can be used to optimize existing strategy.
credit: ADX code are originally from "ADX and DI" by @BeikabuOyaji although i re-wrote so i can have cleaner read and use RMA instead of SMA

Trend Trader Buy/Sell SignalsTrend Trader
The code is open source, what it uses to print signals is MACD cross and ADX. Bar colors change in relation to where price is according to the 50 day MA. The MA ribbon is used for visualizing trend and using it for dynamic support/resistance. The ribbon is comprised of the 50 day and 100 day MAs.
Main reason to publish this script is because some like to jumble up scripts together slap some moving averages on it to "follow trend" and then label it an algorithm, market it and sell it to people online. No single system will work 100% of the time, do you due diligence in anything you are interested in buying. Plenty of free scripts in the TV library that can do you justice when trading.

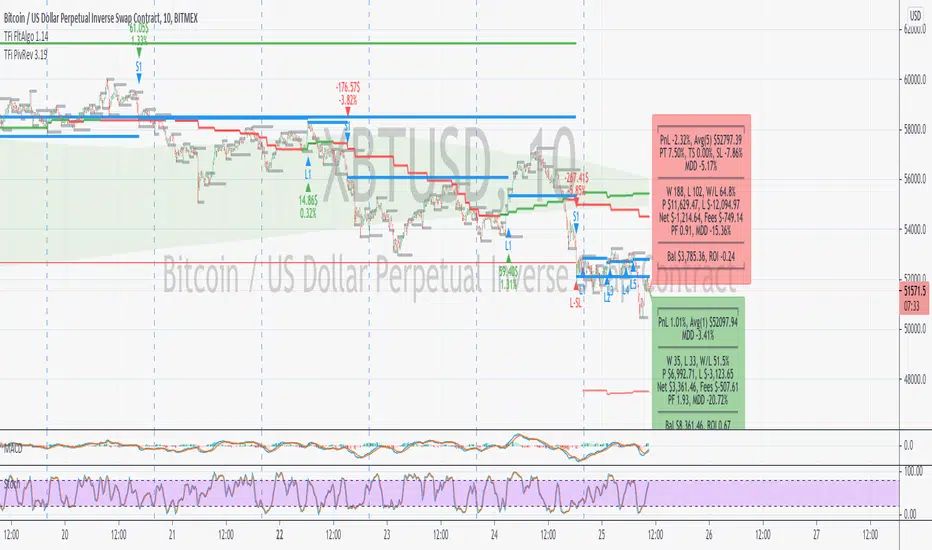
TFi Pivot Reversal V3The Pivot Reversal Study uses pivot points to create a support and resistance level; based on this levels the script creates virtual stop-market orders to catch the trend if the price is crossing the pivot lines.
A "Pyramiding" input allows to configure up to 3 entries; the script enters an additional position if the price falls by a configurable percentage amount (long), the reverse to short orders.
A configurable profit-target and stop-loss is being used to exit an open position.
An optional Moving Average filter can be used to enable only long or short positions.
The script renders a status box at the last bar, which shows the current position status and result of the built-in trading simulation results.
It shows the following statistic values:
current position PnL - also background turns green if position is in profit and red if in loss
the percentage distance to the profit-target and stop-loss level
the overall number of wins and losses and the win/loss ratio
the overall profit and loss amount (assuming a quantity of 1)
the net-profit and profit-ratio
For the correct simulation of entry/exit prices, the script contains inputs for a percentage entry and exit slippage.
The study also creates configurable alerts, which follow the exact position of the entry/exit markers. The default alert messages contain trading instruction to execute orders via Alertatron; but the message content can be replaced if configuring the alert in the Tradingview environment.
The script was mainly backtested with crypto-coins, e.g. XBTUSD at 15min timeframe. But the script also works with any other type of security and timeframe.
How to access
This strategy is a "Invite Only" script. You can can subscribe or purchase the strategy; please use the link below or send me a message via Tradingview to obtain access to the strategy and study script.
For enabling the script in your Tradingview chart window, click on "Indicators" and select "Invite-Only Scripts".
Full list of alerts
'Alertatron Exit' ... Exit all open positions.
'Alertatron Enter Long' ... Enter long position, w/o stop-loss being used.
'Alertatron Enter Short' ... Enter short position, w/o stop-loss being used.
'Alertatron Enter Long SL' ... Enter long position, w/ stop-loss being used.
'Alertatron Enter Short SL' ... Enter short position, w/ stop-loss being used.
Full list of parameters
"Pivot Left Bars" ... Number of bars on the left of the pivot point - used for pivot /peak detection.
"Pivot Right Bars" ... Number of bars on the right of the pivot point - used for pivot /peak detection.
"MA Filter Fast" ... Moving Average filter fast period.
"MA Filter Slow" ... Moving Average filter slow period.
"Profit Target Option" ... Configure the profit-target either as a fix percentage value or an ATR.
"Profit Target " ... Fix percentage profit-target.
"Profit ATR Period" ... ATR profit-target period.
"Profit ATR Factor" ... ATR profit-target factor/multiplier.
"Stop Loss Option" ... Configure the stop-loss either as a fix percentage value or disable the stop-loss completely.
"Stop Loss " ... Fix percentage stop-loss.
"Rebuy Loss " ... Percentage loss of the initial position before script enter a nw position in the same direction.
"Pyramiding" ... Maximum number of positions.
"Show MA Plots" ... Show/hide Moving average plots.
"Slippage Entry " ... Percentage slippage for entering a position.
"Slippage Exit " ... Percentage slippage for exiting a position.
"Statistic Label" ... Defines the position of the statistic label relatively to the last bar in the chart.
"Backtest Start" ... Backtest start time; area outside this timeframe will be grayed out.
"Backtest Stop" ... Backtest stop time; area outside this timeframe will be grayed out.
"Backtest Mode" ... Closes the currently opened position if chart switches to last bar; please only enable if backtesting, otherwise it leads to unwanted alerts.
EOD re-entriesThis indicator is designed to compliment another of my trading scripts which gives signals for long-term trends on the daily chart. Here, I'm using the same daily 50 and 200MAs, but projecting them on the 4 hour chart to potentially catch faster trade re-entry points.
There are built in alerts for the following:
- Long: The price closed above the daily 50 MA while the 4 hour VWAP is above the MVWAP
- Long: The price closed above the daily 200 MA while the 4 hour VWAP is above the MVWAP
- Short: The price closed below the daily 50 MA while the 4 hour VWAP is below the MVWAP
- Short: The price closed below the daily 200 MA while the 4 hour VWAP is below the MVWAP
- VWAP long re-entry (large green triangle): The price closes above the VWAP and both the 50 & 200 MAs
- VWAP short re-entry (large red triangle): The price closes below the VWAP and both the 50 & 200 MAs
- EMA long re-entry (small green triangle): 4 EMAs of your choosing are fanning out above the 50 & 200 MAs when the price is above VWAP
- EMA short re-entry (small red triangle): 4 EMAs of your choosing are fanning out below the 50 & 200 MAs when the price is below VWAP
All of the above are filtered against stochastic RSI and numerous other oscillators to reinforce the signals.
This is a private script. Please DM me for access.

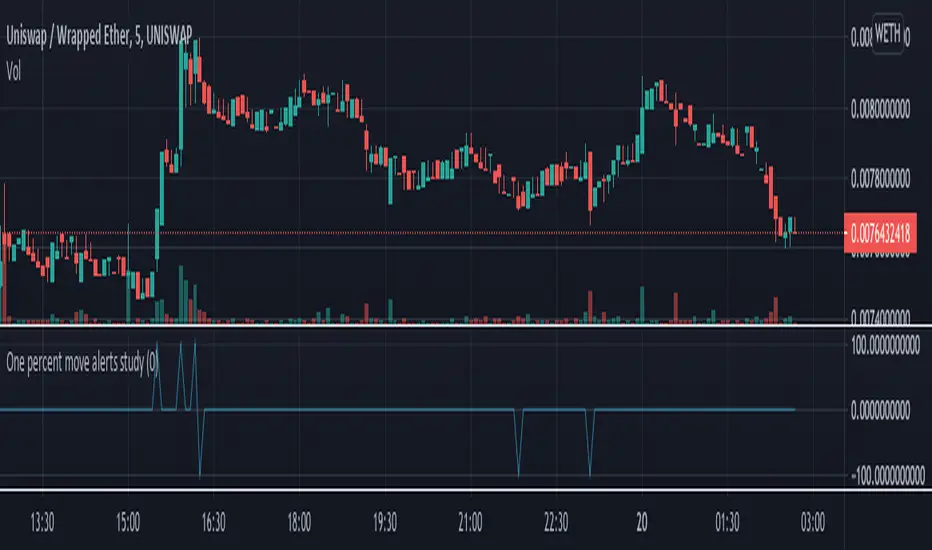
One Percent Move Study (For your Alerts)This is a simple script that can be used to alerts. The signal1 variable goes to 100 if there is a 1% up move in a tick, and goes to -100 if there is a 1% down move in a tick for an asset. This is best on a 1 minute or 5 minute chart.
This example shows this on the DeFi exchange Uniswap for the UNI/ETH pair
BTC & ETH Alert SystemWith Tradingview's free plan, only one alert is allowed. The purpose of this indicator is to allow for two alerts--one for BTC and one for ETH.
How to use the alert system:
1. Set the desired value for BTC and ETH that you want to be alerted for
2. Set an alert on the indicator by clicking the three ellipses and then "Add Alert"
3. Set the alert to go off if the value of the indicator is greater than 0.
The example is of BTC using an alert of $10,000 and an alert of ETH at $2,000 (untriggered)
The script can be easily modified to be used for different assets

EOD TraderMy EOD (End of Day) system for trading on the daily timeframe with minimum stress. Just pair the built-in alerts with the bot of your choice and then let the indicator do the rest. It'll determine the current trend, filter out as much noise as possible and then take you from long to short.
There are options to toggle the following:
Auto fibonacci levels with alerts for the look-back period of your choosing
Auto support and resistance with alerts
Alerts for the price closing above/below the 50MA
A coloured background to show the trend direction (green = up, red = down)
The fib and support levels can be handy when trying to determine when best to take profit or even exit the trade entirely.
Important: I personally use Heikin Ashi candles with this script to further filter entries. An option is available within the script settings to toggle this on/off should you wish to do the same.
This is a premium script. Please DM me for access.

RSI, STOCHASTIC, KELTNER AND EMA CROSSES COMBINEDI have combined RSI and Stochastic but also added an keltner channel and then also two EMA's.
How the indicator works is the background turns green when the rsi and stochastic are below 20 and the keltner channel is below X and also your fast ema is below your slow ema and then vice versa for sell signals.
Feel free to leave a comment on what you think and what could be improved on it because i know their is some fine tuning to do and some improvement that can be made and I'm sure i'll be updating this myself.
All the variables are interchangable and the indicator has alert functionality.
[NLX-L3] Alerts- Introduction: Alert Module -
This alert module is part of my powerful and flexible modular trading framework.
It can be used with any indicator that has a signal plot output (1 = long / -1 = short)
This trading framework is the result of many years experience building indicators and trading strategies.
I couldn’t find a trading framework in Pine Script that would suit my needs and so I started to design my own from scratch. I’m trading with this framework myself so I’ve made sure that it’s flexible and absolutely reliable in a live-trading environment.
- Architecture -
What makes this framework so flexible is the modular architecture, different layers that all serve a very specific purpose.
You will notice that the module names include either L1 - L2 - L3:
- Layer 1 (L1) is the base layer and the foundation. L1 indicators are used to determine the trend, volume profile and filter noise. You would use L1 to see if it’s a good time to trade, what is the direction - or if it's better to trade at all in unfavourable conditions
- Layer 2 (L2) receives the result of L1 and if the market conditions are good the L2 indicator looks for an optimal entry point to go long or short. It is possible to combine several L2 indicators and trigger a long/short signal only if all L2 indicators agree.
- Layer 3 (L3) receives the final signal from L2 and it’s where we can now backtest the result of our trading strategy and trigger trade alerts with help of the alert module.
- Features -
External Input Source (any indicator with signal plot can be used)
Safe Entries Option: Enter a trade only if the position is profitable ad the momentum allows
Pyramid Entries
Partial Take-Profit: %-Step Interval and Quantity per Step
Stop Methods: Trailing Stop, TP/SL with ATR Option, several type of stop bands...
Profit/Loss Label with Fee, Slippage and Leverage Calculation
- Additional Modules -
L3 - Backtest Module
L2 - Noise Filter
L2 - QQE++
L1 - Trend Index
Trend Matrix (Coming soon)
Dynamic Range Breakout (Coming soon)
Breakouts & Pullbacks
- Request Access -
Contact me - see my signature below

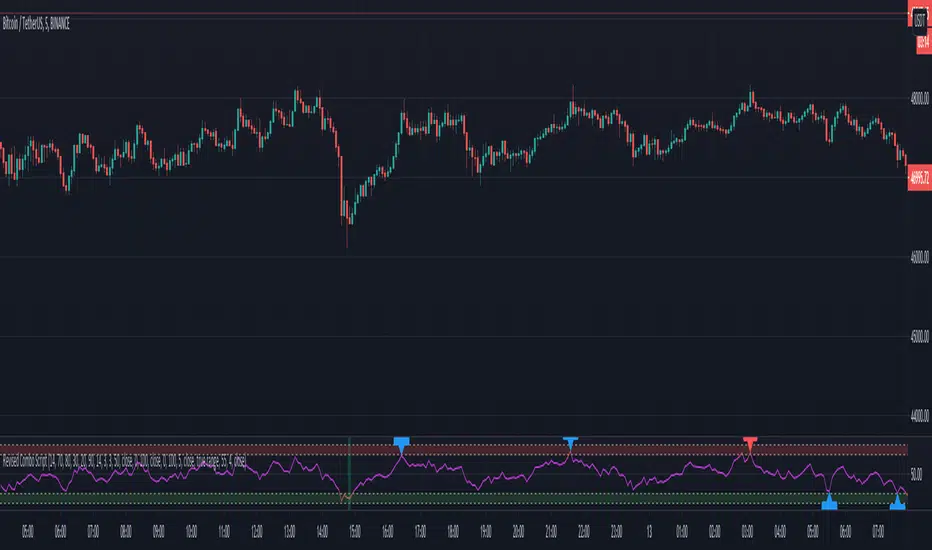
The MATRIX: Ultimate Crypto Position Strategy (Alert Version)Welcome back everyone,
It's been a while since our last post. In recent months we have worked on all kinds of projects, but more on that later. In the meantime, we also received a lot of positive feedback about our original 'The MATRIX: Ultimate Crypto Position Strategy' script.
One of the many requests was whether we could release an alert version.
However, since Pinescript does not provide the alert functionality in a strategy type script, it had to be converted to a study type script. Besides that, we have also added a stop-loss functionality. This release has the same internal algorithm as the original 'The MATRIX: Ultimate Crypto Position Strategy' script. But instead of showing back test results, this script provides the functionality to add alerts that can notify the user via email / pop-up / sms / app once a signal is given! You must manually add these alerts via TradingView. If you need help setting up these alerts, feel free to ask in the comment box or send us a dm.
***The script is invite-only, message us to get script access***
-------------------------------------------------------------------------------------------------
The MATRIX: Ultimate Crypto Position Strategy should be used as follows:
• The trading strategy was designed and optimized for trading cryptocurrencies only ; furthermore it works best on established high market cap cryptocurrencies that have a clear trend such as:
BTCUSD
ETHUSD
LTCUSD
XRMUSD
EOSUSD
ADAUSD
DASHUSD
ETCUSD
• The trading strategy is based on swing/position methodology. The script must therefore be used on daily timeframe candles only (1D).
• Use USD trading pairs only (e.g. use ETHUSD instead of the ETHBTC) since the individual trend is captured more effectively and therefore gives better results.
-------------------------------------------------------------------------------------------------
The MATRIX:Ultimate Crypto Position Strategy is based on the following indicators:
• Ichimoku Cloud ; acts as the leading indicator.
• Volume ; without strong volume , a market move is not valid.
• MACD and Vortex ; both being used as confirmation indicators.
• Choppiness index ; avoids trading in choppy markets.
• Bullish/ Bearish Regular Divergences in combination with RSI to spot tops and bottoms.
• Simple and Exponential Moving Averages ; prêvents trading against the trend.
The trading strategy is easy to use, trend based and without repainting, meaning once a signal has been made it is permanent and that no future data is used in the decision making. It detects the trend and filters out market noise based on more than 10 technical indicators. ONLY when all indicators align with each other the algorithm prints a BUY or SELL signal. The trading strategy provides high probability trading signals and minimizes risk! This script aims to capture the profit from longer term trending moves and by doing so filters out non-substantial trends and avoids the associated risks with these trades.
-------------------------------------------------------------------------------------------------
The MATRIX: Ultimate Crypto Position Strategy has the following features:
• ALERTS can be enabled which can notify the user through email/popup/app once a signal is given.
• Automatically generated Buy / Sell alerts in the form of a label.
• NO Repaint once candle is closed.
• SAFEGUARD ; custom built-in security prevẹnts trading when the price is out of equilibrium.
• Customizable Display for the Ichimoku cloud indicator display.
-------------------------------------------------------------------------------------------------
Reminder: Use this trading strategy at your own risk and trade responsibly. We are not responsible for any financial loss using this strategy.
***The script is invite-only, message us to get script access***

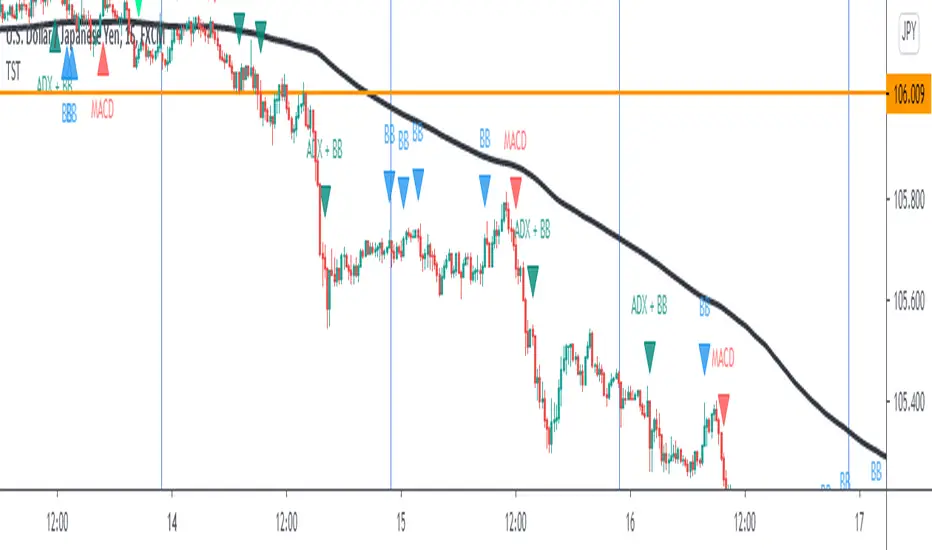
TST Signals & AlertsThis is an unofficial script for strategies tested on Trading Strategy Testing Youtube channel. Over time, most successful strategies will be added with an option to set strategy-specific alerts . TST Signals & Alerts will draw signals on the chart when the entry conditions are met. You can also opt for displaying indicators .
My script is meant for beginners but can be used by veterans too. Just pick one or two strategies, you don't want to flood your chart with conflicting signals. You may want to support your trades with a proper analysis. Is the market trending? Is there a fundament around the corner?
If a new signal occurs when there is still an open position, you are not supposed to take another.
The current version includes MACD and ADX + BB and BB strategies.
MACD strategy:
►Buy, when MACD crosses below the signal line when it is negative. The price must also be above 200 EMA.
►Sell, when MACD crosses above the signal line when it is positive. The price must also be below 200 EMA.
►This strategy was tested on 15-minute charts of EURUSD with reward-to-risk ratio 1,5 and win rate of 61% over 100 trades.
►►►MACD has to be added to your chart separately because it needs a new window. Ticking display indicators will not add MACD to your chart.
►►►MACD was also tested by a different channel I made a script for. You can view the results and the script here:
ADX + BB strategy:
►Buy, when the price is above 200 EMA and ADX becomes higher than 25.
►Sell, when the price is below 200 EMA and ADX becomes higher than 25.
►Stop-loss is either 200 EMA or Bollinger Bands level. Check the channel for more information.
►This strategy was tested on 5-minute charts of EURUSD, USDJPY, AUDUSD with reward-to-risk ratio 1,2 and win rate of 56% over 100 trades in total.
BB strategy:
►Buy, when the price is above 200 EMA and candle's low is below the lower Bollinger Band.
►Sell, when the price is below 200 EMA and candle's high is above the upper Bollinger Band.
►This strategy was tested on 15-minute charts of EURUSD with reward-to-risk ratio 1,5 and win rate of 52% over 100 trades in total.
►►►Due to the relatively low win rate of this strategy, you need to filter out potentially harmful signals with a proper analysis.
Bear in mind that backtesting performance doesn't guarantee future profitability. • Most systematic strategies are not suitable for each timeframe - if you use the different timeframe than the one it was tested on, the result can differ significantly. • You should perform your own backtest to base your trades on more data & to establish confidence in the selected strategy. • This script is not a replacement for proper analysis.
New strategies will be added when I have time. If I see multiple people asking for the same feature, I might agree to release it with a new version. I am not going to add input options in this script, it could come as a separate script though. I am in no way affiliated with the Youtube channel, so if you find the script helpful, shot me a message or send me some TradingView coins >)
If you encounter any bug, you can report it in a message or in comments. Support it with screenshot and relevant information such as a time when it occurred and what options were on etc.
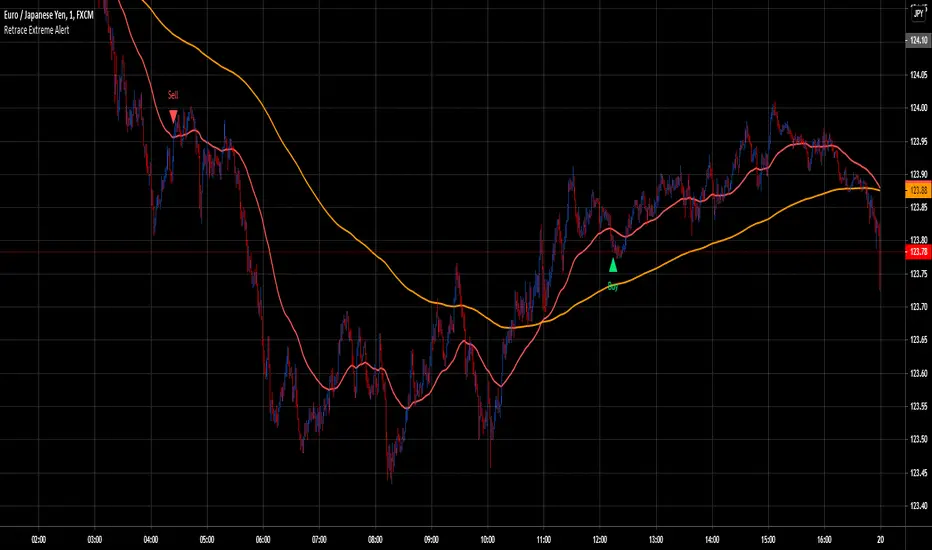
Retrace Extreme AlertThis indicator will alert you after 3 conditions are met. First an EMA cross, second price crosses back into the EMA and third RSI above or below a certain value. Upon these 3 conditions being met you will receive an alert.
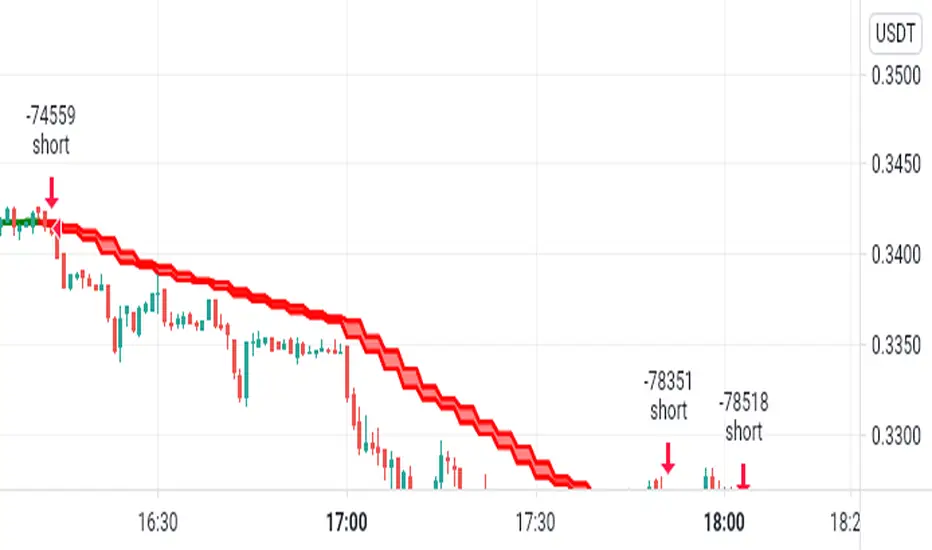
PWTPROv5 TrendIndicator with LONG/SHORT BTC ETH alerts
This PWTPRO indicator is based on VWAP , MACD and EMAs
Best fits for BTC /USDT and ETH/USDT trading for 1H timeframe for positional trading (3-5 trades per week)
15min TF is good for intraday scalping. 4H is good for longterm. Fits for any coin, forex, metals, oil and bonds.
There are 4 types of entries, 1,3 and 4 are on by default. It's more accurate. Rest you can test.
Warning. Not yet works with huge trend continuation. Use it manually with you own risk management, don't forget stop-losses.
Show take profits and stop-loss (It's off by defaults)
You can now add 3 take-profit and 1 stop-loss labels on chart in %
Use 0 values to remove any of them from the charts.
New option: Show entering position price as label
Minor visual improvements with price labels (y position is now correctly above/below bars)
+added new option to round prices for integer values (i.e. 9251 for btc instead of 9251.35) off by defaults and now fits for altcoins and any asses that has price below 1 (usd, btc etc)
This is invite only script. PM me if you want to test it.

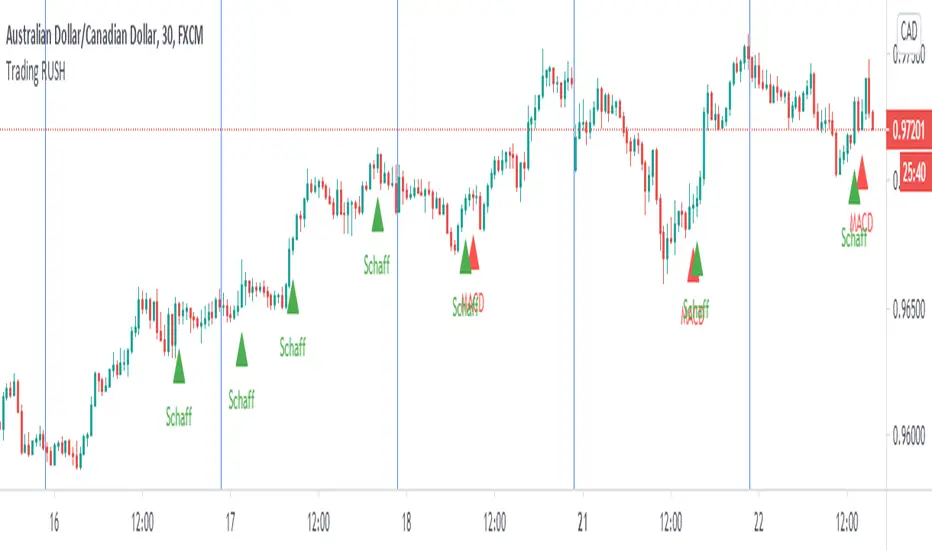
Trading Rush Signals & AlertsThis is an unofficial script for strategies tested on TRADING RUSH Youtube channel. Over time, most successful strategies will be added with an option to set strategy-specific alerts . Trading Rush Signals & Alerts will draw signals on the chart when the entry conditions are met. You can also opt for displaying indicators .
My script is meant for beginners but can be used by veterans too. Just pick only one or two strategies, you don't want to flood your chart with conflicting signals. You may want to support your trades with a proper analysis. If a new signal occurs when there is still an open position, you are not supposed to take another.
The current version includes MACD and Donchian Channels.
MACD strategy:
►Buy, when MACD crosses below the signal line when it is negative. The price must also be above 200 EMA.
►Sell, when MACD crosses above the signal line when it is positive. The price must also be below 200 EMA.
►This strategy was tested on 30-minute charts of EURUSD and EURJPY with reward-to-risk ratio 1,5 and win rate of 62% over 100 trades .
►►►MACD has to be added to your chart separately because it needs a new window. Indicators displaying will not add this indicator to the chart.
Donchian Channels strategy:
►Buy, when the price breaches Donchian to the upside after making a new low. The price must also be above 200 EMA.
►Sell, when the price breaches Donchian to the downside after making a new high. The price must also be below 200 EMA.
►Stop-loss is Donchian bottom for long and Donchian top for shorts. Check the channel for more information.
►This strategy was tested on 30-minute charts of EURUSD with reward-to-risk ratio 1,5 and win rate of 58% over 100 trades .
►►►I programmed alerts for Donchians to come ahead of an actual breach. If you often leave the screen when trading, this will help you. The necessary downside for that is the alerts might come when the signal doesn't trigger in the end. You will see a mark on the chart if the conditions are truly met.
Bear in mind that backtesting performance doesn't guarantee future profitability. • Most systematic strategies are not suitable for any timeframe. • You should perform your own backtest to base your trades on more data & to establish confidence in the selected strategy.
New strategies will be added when I have time. If I see multiple people asking for the same new feature, I might agree to release it with a new version. I am not going to add input options in this script, it could come as a separate script though. I am in no way affiliated with the Youtubechannel , so if you find the script helpful, shot me a message or send me some TradingView coins >)
If you encounter any bug, you can report it in a message or in comments. Support it with screenshot and relevant information such as a time when it occurred and what options were on etc.