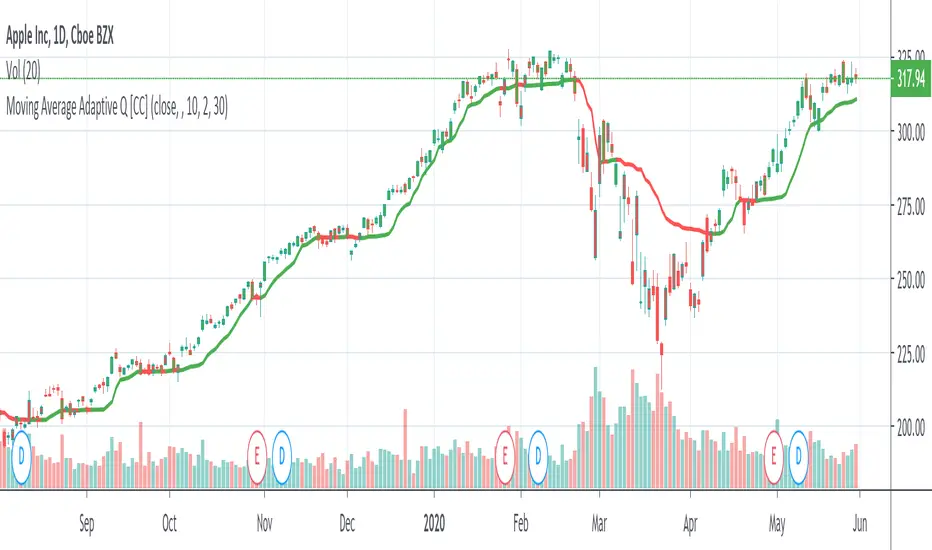
Moving Average Adaptive QThe Moving Average Adaptive Q (MAAQ) was authored by Perry Kaufman in the Stocks and Commodities Magazine 06/1995
This is similar to his Kaufman Adaptive Moving Average with a few changes. This is a pretty close moving average which I like quite a bit. Try it and let me know what you think.
Send me a message and let me know what other indicators you would like to see!
Adaptive
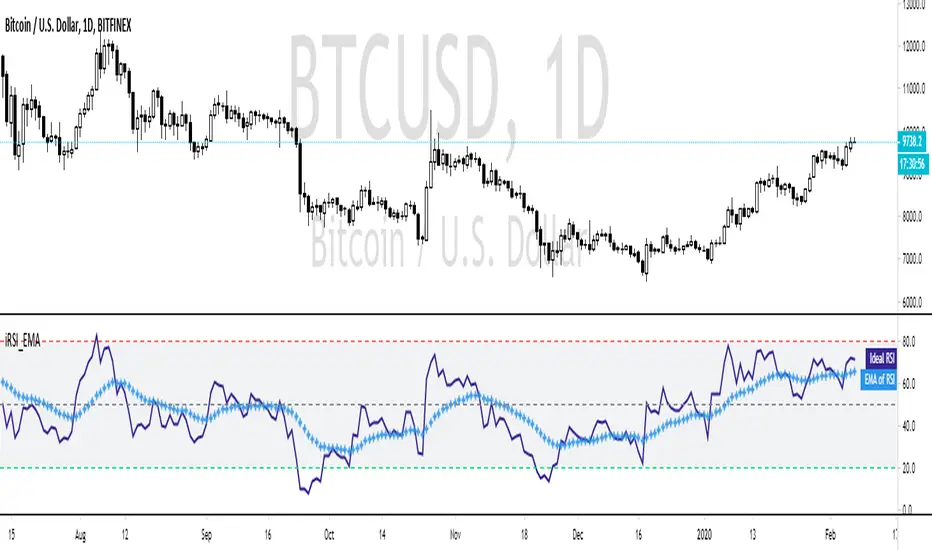
Ehler's Ideal RSI with EMAThis is a modification of the 'Ehlers Ideal RSI' script to include an EMA of the RSI, which acts as a follower!
The idea was a user suggestion and if you would like your suggestion made into an indicator, check the FAQ!
If you've never encountered the iRSI before, then you're in for a treat. This RSI will calculate the best period to use by itself.
The theory behind this math is called "Instantaneous Frequency Measurement" and is a big component of making terrible indicators (see RSI, Stoch, ADX) into usable ones!
No longer will you have to swap between different periods for different Stocks, Pairs, or Cryptos.
Compare it to the normal RSI and you'll see the underlying calculation is the same, but the period changes automatically.
The EMA provides an earlier indicator of breakouts.
You don't need to wait for this RSI to become "overbought" or "oversold" by crossing the typical 80/20 levels.
Simply observing when the RSI crosses the EMA line can act as confirmation for your other indicators much faster than typical momentum-based indicators.
FAQ
Why is your script Protected?
Users like to take my open-source code and charge to use it without my permission.
How do I use this to trade?
Add it to your chart and see what stacks up with your current setup. I trade Forex, so what looks bad on my charts might look golden on yours.
How long have you been doing this?
I've been coding for about 8 years and actively trading for 2 years. My degree is in Robotics Engineering and I became obsessed with investing at 22.
How do you trade?
Hurst + SNR + MESA MAMA + ATR + LSTM + Pure Grid. You can't completely code this setup using Pinescript, but if you learn C++ or Python you're there!
Are your returns good?
I average 0.68% every weekday or 22.65% monthly, using the method above.
Can you build my indicator or strategy?
Absolutely! If it hasn't been done before and it improves our community, then consider it done.
But can you build an indicator or strategy for me ?
Citing the house rules, I cannot solicit for any purpose. So saying "PM me" would be a grievous violation of said rules, obviously.
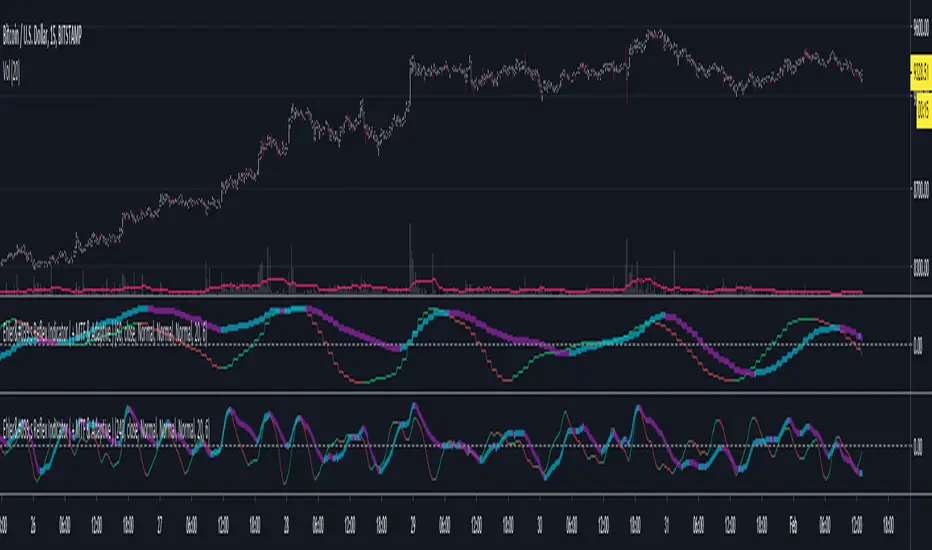
Ehler's Reflex Indicator ( + MTF & Adaptive )Implementation of Ehler's Reflex Indicator from TASC Feb 2020.
Optional MTF and fixed/adaptive length based on one of Ehler's cycle measurements.
Optional settings for his recommended 2 bar averaging, can apply the averaging to either/and source ie (close + close ) / 2, the output of the smoothing filter portion of the calculation or the final indicator output.
Green/Red : Reflex/Cycle
Aqua/Purple : Trend
Adaptive Price Zone Backtest The adaptive price zone (APZ) is a volatility-based technical indicator that helps investors
identify possible market turning points, which can be especially useful in a sideways-moving
market. It was created by technical analyst Lee Leibfarth in the article “Identify the
Turning Point: Trading With An Adaptive Price Zone,” which appeared in the September 2006 issue
of the journal Technical Analysis of Stocks and Commodities.
This indicator attempts to signal significant price movements by using a set of bands based on
short-term, double-smoothed exponential moving averages that lag only slightly behind price changes.
It can help short-term investors and day traders profit in volatile markets by signaling price
reversal points, which can indicate potentially lucrative times to buy or sell. The APZ can be
implemented as part of an automated trading system and can be applied to the charts of all tradeable assets.
WARNING:
- For purpose educate only
- This script to change bars colors.
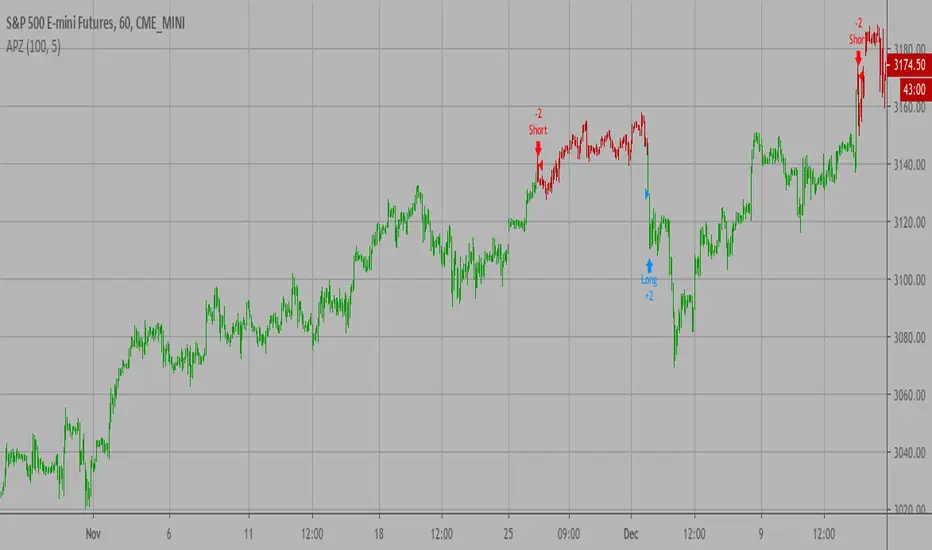
Adaptive Price Zone Strategy The adaptive price zone (APZ) is a volatility-based technical indicator that helps investors
identify possible market turning points, which can be especially useful in a sideways-moving
market. It was created by technical analyst Lee Leibfarth in the article “Identify the
Turning Point: Trading With An Adaptive Price Zone,” which appeared in the September 2006 issue
of the journal Technical Analysis of Stocks and Commodities.
This indicator attempts to signal significant price movements by using a set of bands based on
short-term, double-smoothed exponential moving averages that lag only slightly behind price changes.
It can help short-term investors and day traders profit in volatile markets by signaling price
reversal points, which can indicate potentially lucrative times to buy or sell. The APZ can be
implemented as part of an automated trading system and can be applied to the charts of all tradeable assets.
Green color is long.
Red color is short.
WARNING:
- For purpose educate only
- This script to change bars colors.

Adaptive Price Zone Indicator The adaptive price zone (APZ) is a volatility-based technical indicator that helps investors
identify possible market turning points, which can be especially useful in a sideways-moving
market. It was created by technical analyst Lee Leibfarth in the article “Identify the
Turning Point: Trading With An Adaptive Price Zone,” which appeared in the September 2006 issue
of the journal Technical Analysis of Stocks and Commodities.
This indicator attempts to signal significant price movements by using a set of bands based on
short-term, double-smoothed exponential moving averages that lag only slightly behind price changes.
It can help short-term investors and day traders profit in volatile markets by signaling price
reversal points, which can indicate potentially lucrative times to buy or sell. The APZ can be
implemented as part of an automated trading system and can be applied to the charts of all tradeable assets.

Efficient Trend Step ChannelIntroduction
The efficient trend-step indicator is a trend indicator that make use of the efficiency ratio in order to adapt to the market trend strength, this indicator originally aimed to remain static during ranging states while fitting the price only when large variations occur. The trend step indicator family unlike most moving averages has a boxy appearance and could therefore not be classified as smooth, this makes it an indicator relatively uninteresting to use as input for other non-trending indicators such as oscillators.
Today a channel indicator making use of the efficient trend-step is proposed, the indicator has an upper and a lower extremity who can be used for breakout or support and resistance methodologies, however we will see that the indicator is sometimes able to return accurate support and resistance levels.
The Indicator
The indicator has the same settings has the efficient trend step indicator, length control the period of the efficiency ratio, fast control the period of the rolling standard deviation used for trending states, slow control the period of the rolling standard deviation used for ranging states, fast should be lower than slow , if both are equal then the indicator is equal to the classical trend step indicator and length does no longer affect the indicator output. Lower values of fast/slow will make the indicator more reactive to small variations thus changing direction more often.
The color changes you can see on the indicator are changed depending on the prior direction took by the indicator output, if the indicator where higher than its precedent value, then the color will be blue until the indicator is lower than its precedent value. Those colors help you have an estimate of the current trend direction.
Channel Calculation And Role
The extremities made from the efficient trend step allow for more advanced trading rules, they can act as stop/target level and can also give a rough estimate of the current market volatility, with wider extremities indicating a more volatile market.
The extremities are made directly from the dev element used by the efficient trend-step, the upper extremity is made by summing the efficient trend step with the value of dev when the efficient trend step change, the lower extremity is made the same way but the value is subtracted instead.
Is it a weird choice ? It sure is strange to see such approach, the absolute rolling average error between the price and the efficient trend step could have been a logical measure but using dev instead is more efficient and also allow for a more adaptive approach which can benefit the support and resistance methodology, the last reason is because i didn't wanted to "denature" the trend-step signature of the indicator.
The figure above represent the measurement used for making the extremities (in green).
Since the previously described measure change only when the efficient trend step change, we can conclude that such measure is representative of a relatively large variation, since the efficient trend step aim to only change when a large variations appear.
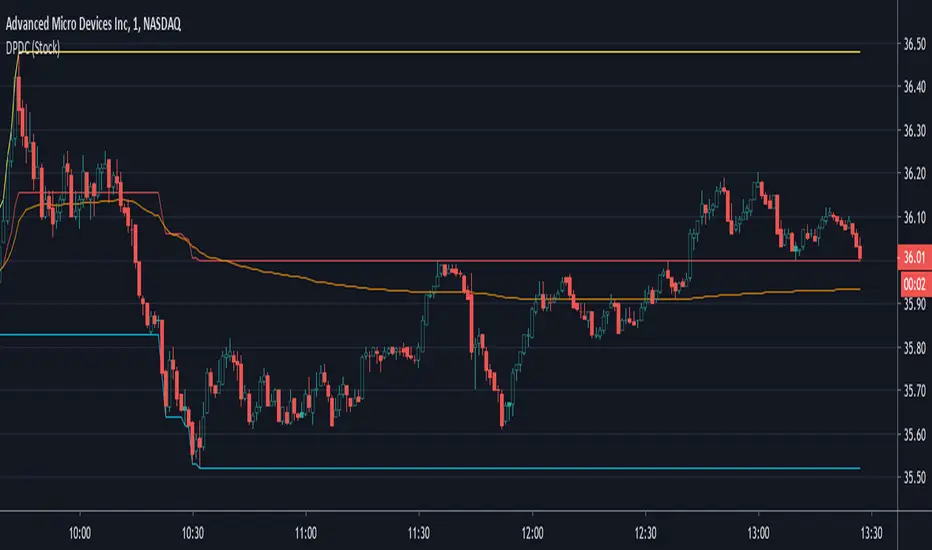
We can see that the upper extremity acted as an accurate resistance in this upper variation of AMD,
Here as well, however like other bands indicators it is safer to take into account the current trend direction, a strong uptrend will have less difficulties crossing the upper extremity, therefore it might be better to rely on the support (lower extremity) on an up-trending market (indicator in blue), and on the resistance (upper extremity) on an down-trending market (indicator in orange).
The figure above show support and resistances signals, a cross represent a false signal, while green arrows represent correct ones with their respective direction.
Conclusion
The presented indicator add more possibilities to the interpretation of the efficient trend step, the extremities can act as stop/target level, however this use has to be controlled, and the level should be in accordance to your risk/reward ratio.
Showcasing another trend-step indicator was a real pleasure. Thanks for reading :)

Minkowski Distance Factor Adaptive Period MACDHi, this script comes from the idea that Ricardo Santos' Minkovski Distance Function is transferred to the period as a factor.
Minkowski distance is used as a percentage factor with the help of Relative Strength Index function.
Minkowski Distance Function Script :
And thus an adaptive MACD was created.
This script can give much better results in more optimized larger periods.
I leave the decision to determine the periods and weights.
I used the weights of 9,12,26 and periods created with multiplied by factor.
Regards.

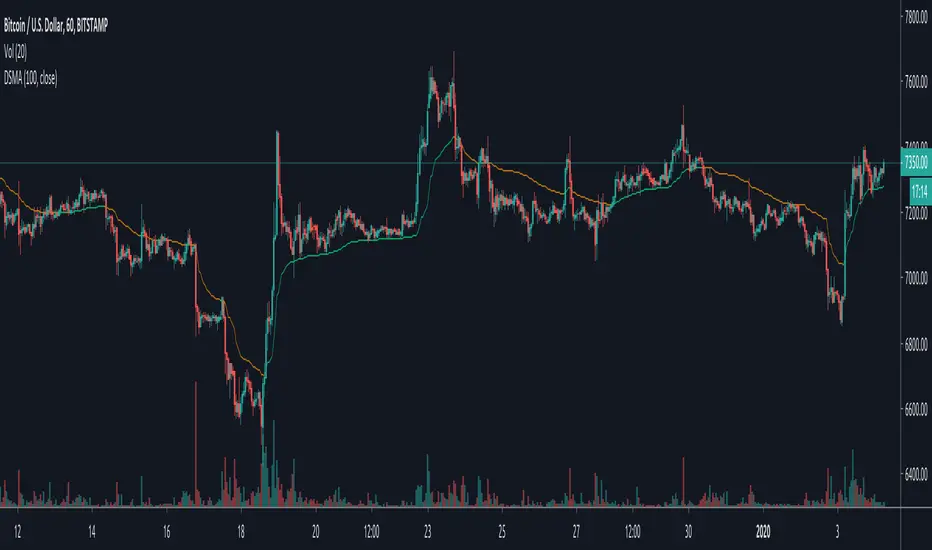
Deviation Scaled Moving Average [ChuckBanger]This is a deviation scaled moving average original designed by John Ehlers. It is a new adaptive moving average that has the ability to rapidly adapt to volatility in price movement with minimal lag. Because it is so smooth and adapts to the volatility of the market it is by far a really great tool for spotting trend changes
Bar Strength Index (BSI) by CryptorhythmsBar Strength Index (BSI) by Cryptorhythms
Intro
BSI is an totaly new and original indicator derived from Internal Bar Strength. It can be classified as similar to an RSI, but its method of calculation is very different so it sometimes gives an edge where RSI does not.
In the chart I have included RSI (red line) as a comparison for you to contrast BSI with.
Description
The formula for Internal Bar Strength is:
IBS = (close - low) / (high - low) * 100
The original IBS and thus this derivitive (BSI) are meant for higher timeframe analysis. Working best on daily, weekly or monthly charts. I take that original IBS formula and create something smoother and easier to understand - The Bar Strength Index !
Options
💠There is an option for smoothing which I recommend using.
💠Also options to make the scaling adaptive, or to leave it static.
💠A normalization option is available to create a bounded oscillator (easier for alerts/algos).
💠You can choose an MA type and length to create a signal line for it as well.
💠Lastly I also included the ability to setup overbought and oversold zones for better alert creation possibilities (crossovers / crossunders).
👍 We hope you enjoyed this indicator and find it useful! We post free crypto analysis, strategies and indicators regularly. This is our 77th script on Tradingview!

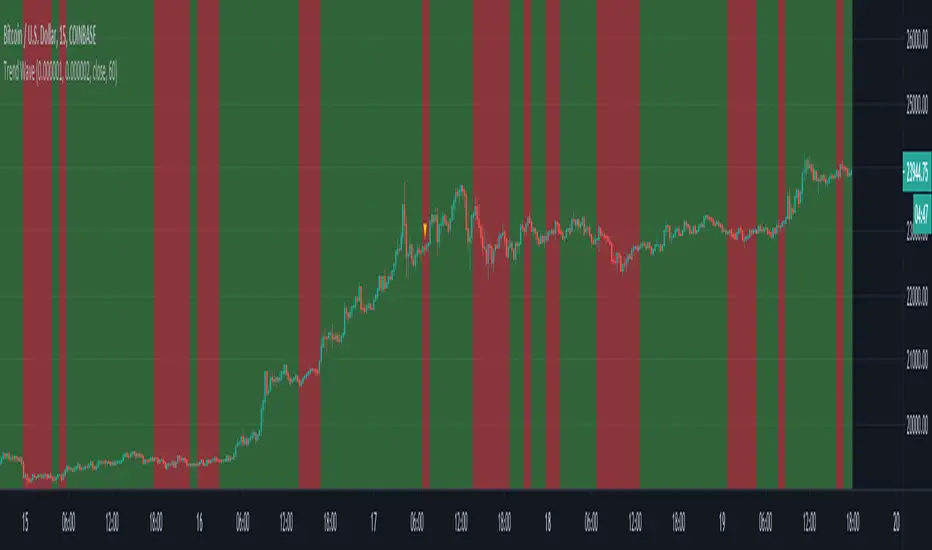
Trend WaveHello Traders!
You know, I can sill remember the first time I started tinkering with Pinescript. As I had no prior programming experience, I learned by experimenting with other open-source scripts on TradingViews Marketplace. Tearing apart and combining interesting scripts to see what the output would be. @ChrisMoody was a huge source of inspiration for learning, and I wanted to thank him, as well as @TheLark for the concept behind this script.
The Trend Wave is based on @ChrisMoody's PPO-PercentileRank-Mkt-Tops-Bottoms , which also happens to be based on @TheLark's TheLark-Laguerre-PPO/ .
Within my experimentation, I found that if I isolate the ppoT & ppoB variables and plot them calculated from extremely small decimals, you can get an extremely fast reacting, mirroring trend detector.
Within the script, you have the ability to plot the background colors based on trend to make it easier to see where crossovers occured, as well as a Mirror Input to view the mirrored version of the script.
-@DayTradingOil

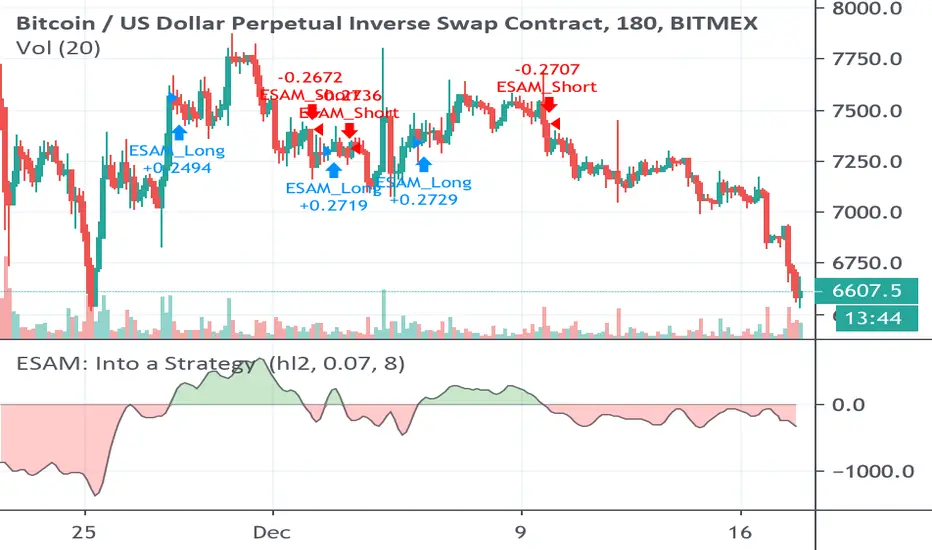
Strategy based on Ehlers Smoothed Adaptive Momentum [LazyBear]Strategy based on Ehlers Smoothed Adaptive Momentum (ESAM) indicator by LazyBear, slightly improved.
Indicator itself was developed and described by John F. Ehlers in his book "Cybernetic Analysis for Stocks and Futures" (2004, Chapter 12: Adapting to the Trend).
Backtesting: XBTUSD (Bitmex): 2h, 3h, 4h
Relativity Autonomous Distribution Blocks
The relativity method is a method of trade inspired by the Theory of Relativity of Albert Einstein , which argues that trade is a relative concept and, according to the case it advocates, creates the values to be evaluated relatively by using various engineering methods, and converts these values to factors to ensure the highest efficiency.
Many layers are common with Autonomous LSTM.
For more information about Autonomous LSTM :
But there are additional layers that are much higher than that.
These systems use COT (Commitment of Traders) data positively in trade and significantly increase the hit rate compared to conventional methods.
And in all traded instruments, it decides the degree of scoring by linking with global markets.
The more liquidity of the selected parities, the higher the success rate, the higher liquidity in the markets.
***STRUCTURE
Feature Layer 1 : Formulation : Common Layer with Autonomous LSTM
Feature Layer 2: Forecast Algorithm : Common Layer with Autonomous LSTM
Feature Layer 3 : Composite of Two Layers : Adaptive Period (Length) Algorithm : Common Layer with Autonomous LSTM
Feature Layer 4 : High - Low Selection Algorithm : Common Layer with Autonomous LSTM
Feature Layer 5 : Volume (Ticker ) - Open Interest (Global Market) Power Factor according to Global Markets and Related instrument (Ticker)
Feature Layer 6 : Quantum Equations including COT Commercial Positions (Communicate with layer 5)
Feature Layer 7 : World's Price/Earnings Ratio (This layer is automatically added to layer 6 as a factor each week.)
Feature Layer 8 : Distribution Blocks : The design of script as a histogram, with distributional buying and selling points and positive/negative zone coloring, with alerts.
Uses the relativity algorithm. This will contribute not only to leveraged transactions but also to portfolio management and will give a more realistic perspective.
Informs the trading points within the regions.
In this way, it allows for gradual buying and selling and reduces the risk to a much lower level.
These feature allows a difference perspective especially for traders who act with portfolio logic and / or add regular income.
The educational idea I shared in order to set an example for this logic:
***SETTINGS
Menu
1. * Market Type
The menu is divided into 5 different algorithms and covers all instruments around the world.
For example:
Futures : XAUUSD , GC , XAGUSD , SUGARUSD , SB1! , XAGUSD
Stocks : All Stocks and Modified Parities (Example : AAPL/EUR , XAU/XAG , AAPL , MT , BAC)
Forex Excluding USD/X : CHFUSD , EURUSD , EURJPY , AUDNZD
Forex USD/X : USDJPY , USDTRY , USDMXN
Crypto : BTCUSD , ETHUSD , ADAUSD or BTCETH , ETHBTC
2. * Barcolor
Barcolor Plotting Rules : On / off section with these rules when barcolor on :
Orange : Distributional Sell Signal ( Not Short )
Blue : Distributinaol Buy Signal
*** FEATURES
Indicator Features :
Red Background with Cross : Short Signal
Green Background with Cross : Buy Signal
Blue Histogram Color : Distributional Buy Signal
Orange Histogram Color : Distributional Sell Signal
Alerts
Long Alert
Short Alert
Distributional Buy Alert
Distributional Sell Alert
*** USAGE
Since the script uses various Commitment of Traders data, it is designed only for the weekly time frame. ( TF = 1W )
Script does not repaint 1 Week and above time frames . (Source = close )
NOTE :
The script design was inspired by one of RafaelZioni's script :
Best regards.

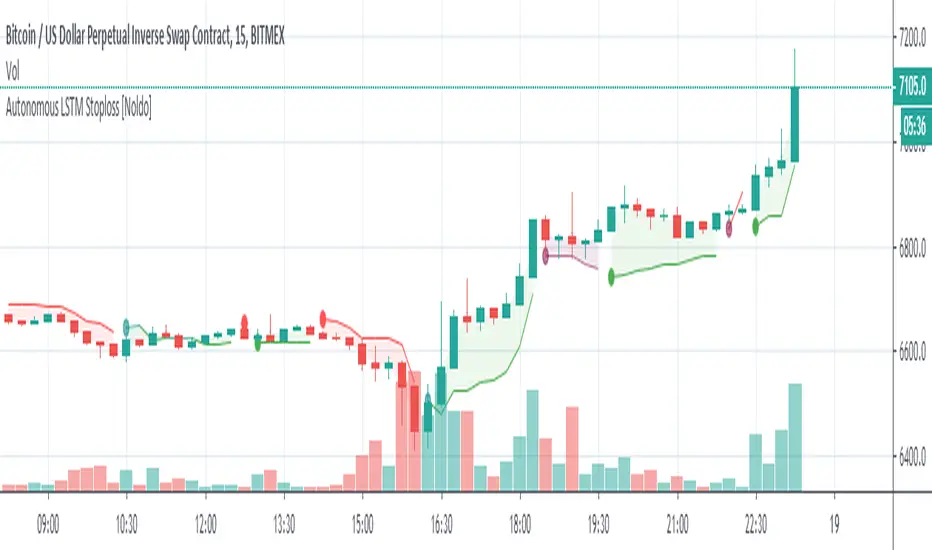
Autonomous LSTM Stop-LossStructure
Autonomous LSTM Stop-Loss is a stop-loss technique that uses the Autonomous LSTM algorithm.
For detailed info about Autonomous LSTM :
*** Features
This structure is different from standard stop-losses.
The base frame is based on "Market Adaptive Stop-Loss" script.
For detailed information about Market Adaptive Stop-Loss:
This script uses the Autonomous LSTM as cross method.
Tradeable / Non Tradeable Region Detector :
This script separates tradeable and non-tradeable regions with a coloring method.
Plotting Rules :
* Maroon : Uncorfirmed Short Positions
* Teal : Unconfirmed Long Positions
* Green : Confirmed Long Positions
* Red : Confirmed Short Positions
This script can be used in all time frames.
Does not repaint. ( Source = close )
*** Settings :
The only option here is the ATR multiplier.
The default use value of this ATR multiplier, which is of the standard of stop-loss, is 2.You can set it from the menu.
No alert is set.
Because the positive and negative regions are the same as Autonomous LSTM.
Since the traders can trade according to the support and resistance outside the definite regions, the unnecessary signal was confused and the alerts were removed.
*** Usage
The Stop-Loss indicator can slide on the chart.
So you have to make sure you put it in place.
Since this is a region scan from the OHLC levels, indicator contains small blue dots to the ohlc levels and made it serve as a guide.
However, since we cannot know the OHLC values precisely, it is best to use them as follows:
Because it is often forgotten to put it in place:
(OHLC : Average of Open, High, Low, and Closing prices for each period)
Using this script in a new pane below will radically solve slip problems.
Stop-Loss values do not slip definitely.The values are selected from the alignment.
NOTE :
Some structures (Market Adaptive Stop-Loss) and design in this script are inspired by everget's Chandelier Exit script :
Best regards.
Signal/Noise Adaptive Moving Average [Jwammo12]This is an adaptive moving average based on a signal noise ratio. It's inspiration is frm Eugene Durenard's book Professional Automated Trading Theory and Practice. Shout out to CryptoStatistical for his implemenation of Durenard's concepts that became the basis for this script.
Check out my breakout strategy based on this concept here .

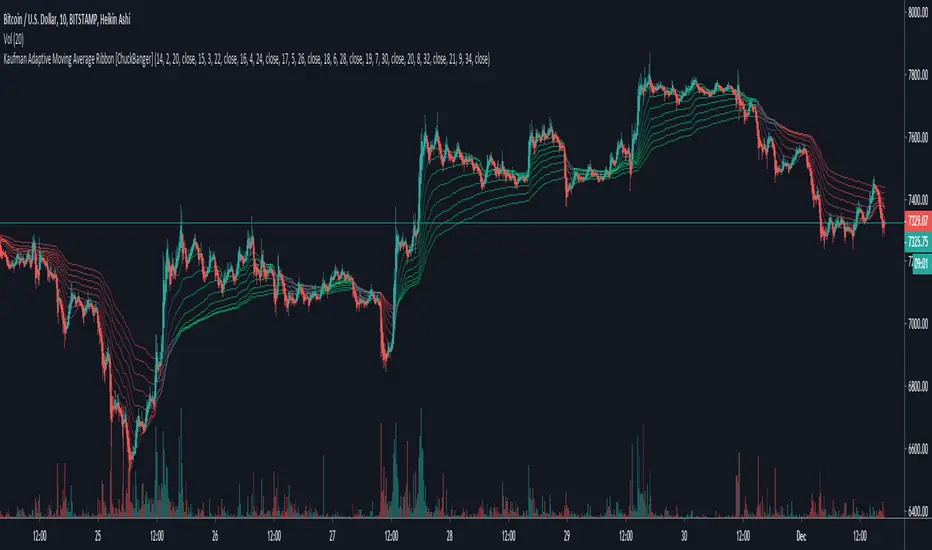
Kaufman Adaptive Moving Average Ribbon [ChuckBanger]Kaufman Adaptive Moving Average is one of the best moving averages in my opinion. So I made a ribbon script out of it. Good luck traders :)
Market Adaptive Stop-LossI realized that the zone changes in the stoploss remained slow, so I couldn't make enough use of the characteristics of technical indicators when opening positions.
This pushed me to keep stop-loss under the influence of a dependent variable.
This script helped me a lot (everget) :
I've redesigned the stop-loss to be affected by intersections.
Therefore, this script is also suitable for adaptive moving averages, fractional periods.
Script features:
1.You can select calculation methods created by using various technical analysis methods from the scripts' settings:
-Moving Average Convergence Divergence ( Macd )
-Stochastic Oscillator ( Stoch )
-Stochastic Relative Strength Index (StochRSI)
-Stochastic Money Flow Index (StochMFI ) (More info : )
-Know Sure Thing ( KST )
-OBV ( On Balance Volume )
-SMA ( Simple Moving Average )
-EMA ( Exponential Moving Average )
-FISHERTRANSFORM ( Fisher Transform )
-AWESOMEOSCILLATOR( Awesome Oscillator )
-PSAR ( Parabolic Stop and Reverse - Parabolic SAR )
-HULLMA( Hull Moving Average )
-VWMA ( Volume Weighted Moving Average )
-RMA (Moving Average using in Relative Strength Index calculations.)
-COG (Center of Gravity )
-ACC-DIST ( Accumulation / Distribution Index )
2 - The region is determined according to the above calculation methods and if it is larger or smaller than the previous stop loss level.
And if the price in the negative zone is lower than the stoploss, it is the exact signal and is shown with more highlighted colors.
And, in the positive zone, where the price is greater than the stoploss, the trade zones are certain.
Shown with more highlighted colors.
If the zones are correct but stop-loss is not suitable for opening positions:
In other words, if the stop-loss is above/under the highest-lowest levels in the positive zone or if the stop loss is located in the lower zone in the negative zone, these zones are shown to be darker and dimmed so that they do not cause false movements.
*** SUMMARY : As a result, you can use this script with support and resistances,and trend lines to get good results.
I hope it helps in your analyzes. Best regards.

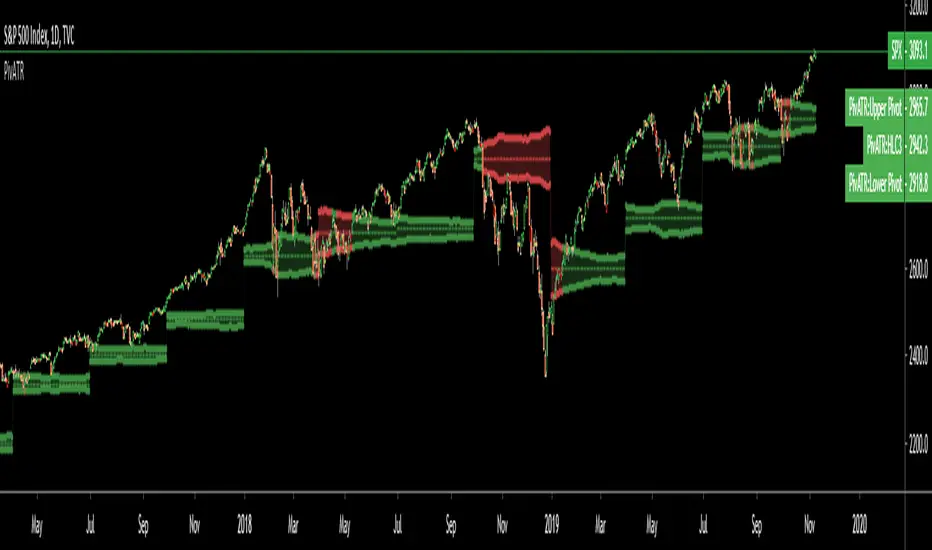
Adaptive Pivot (HLC3)SUMMARY:
Standard Pivot (HLC3) with ATR leeway added to make it adaptive to market volatility.
DESCRIPTION:
Adaptive Pivot is an indicator utilizing the simplicity of HLC3 Pivots as a turning point (and sometimes a trend indicator) while addressing it's fixed and inflexible nature.
Because the indicator is just a single line in the chart, the price may go near it but never touch it. Or it can go pass through it and never retest it again. In an attempt to lessen these from occurring, we can combine pivots with average true range (ATR). This is the specific formula I applied in this indicator:
>Upper Pivot = HLC3 + ATR
>Lower Pivot = HLC3 - ATR
This creates a kind of a range or cloud around the Pivot, making it possibly a more accurate indicator for market turning points.
ADJUSTABLE PARAMETERS:
The usual ATR parameters are included in this indicator:
>ATR_Length = input(14, title="ATR Length", minval=1)
>ATR_Smoothing = input(title="ATR Smoothing", defval="RMA", options="RMA", "SMA", "EMA", "WMA")
Added to the usual ones is this:
>ATR_Multiplier = input(1, title="ATR Multiplier", minval=0.1)
which modifies the extent of the ATR (similar to Chandelier Exit) as it is added/subtracted from the pivot values.
Pivot’s timeframe is also adjustable:
>Pivot_Timeframe = input("3M", title='Pivot Resolution')
Note: I did not lock the type to input.resolution to allow for more possible timeframes.
OTHER PARAMETERS
Indicator color will change to green when the open is above the HLC3 Pivot and change to red when the reverse is true.
🧬dRSI Signals Internal Beta Test by Cryptorthyhms🧬dRSI Signals Internal Beta Test by Cryptorthyhms
Test release, for internal testing only. Debut release soon!
Thank you all for your patience!

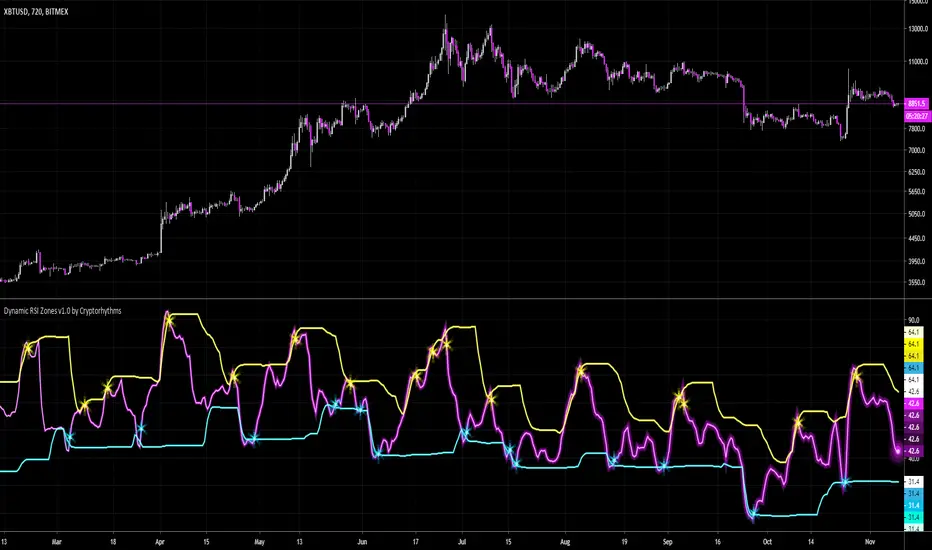
🧬Dynamic RSI Zones v1.0 by Cryptorhythms🧬Dynamic RSI Zones v1.0 by Cryptorhythms
Intro
There are a few adaptive RSI indicators already out there, and they got me thinking. They didn't really do what I desired, or do it profitably. So I had some hunches on how I could create my own and here it is!
Description
It is setup for all major timeframes, though for now its best on 30m or higher. Supported timeframes include: 1m, 3m, 5m, 15m, 30m, 1h, 2h, 4h, 12h, and daily. I am working on settings for 2 day, 3 day and weekly as well for a future update.
This way no more entering settings when changing timeframes, which can mean a lot when seconds matter.
You can however disable the automatic settings if you wish to experiment on a different timeframe or coin/market.
Instructions
Detailed instructions will follow in a separate post for brevity.
Future Updates
There will be many upcoming updates and improvements. These will include some graphical improvements, better performance on lower timeframes, additional timeframes added for XBTUSD, support for additional coins (ETH, LTC, XRP, etc are all coming).
Remember the settings are currently adapted for XBTUSD only!
👍 Enjoying this indicator or find it useful? Please give me a like and follow! I post crypto analysis, price action strategies and free indicators regularly.
💬 Questions? Comments? Want to get access to an entire suite of proven trading indicators? Come visit us on telegram and chat. We make timely posts about the market, news, and strategy everyday. Our community isn't open only to subscribers - everyone is welcome to join.
Daily Progressive Donchian ChannelsThis is the first script that I publish.
His main goal is to help identify the extreme of the day and to compare the VWAP with the average DPDC to find meaningful resistance and support.
Price-Line Channel - A Friendly Support And Resistance IndicatorIntroduction
Lines are the most widely used figures in technical analysis, this is due to the linear trends that some securities posses (daily log SP500 for example), support and resistances are also responsible for the uses of lines, basically linear support and resistances are made with the assumption that the line connecting two local maximas or minimas will help the user detect a new local maxima or minima when the price will cross the line.
Technical indicators attempting to output lines have always been a concern in technical analysis, the mostly know certainly being the linear regression, however any linear models would fit in this category. In general those indicators always reevaluate their outputs values (repainting), others non repainting indicators returning lines are sometimes to impractical to set-up. This is what has encouraged me to make a simpler indicator based on the framework used in the recursive bands indicator that i published.
The proposed indicator aim to be extremely flexible and easy to use while returning linear support and resistances, an option that allow readjustment is also introduced, thus allowing for a "smarter" indicator.
The Indicator
The indicator return two extremities, the upper one aim to detect resistance points while the lower one aim to detect support points. The length setting control the steepness of the line, with higher values of length involving a lower slope, this make the indicator less reactive and interact with the price less often.
The name "price-line" comes from the fact that the channel is dependent on its own interaction with the price, therefore a breakout methodology can also be used, where price is up-trending when crossing with the upper extremity and down trending when crossing with the lower one.
Readjusted Option
The line steepness can be readjusted based on the market volatility, it make more sense for the line to be more steep when the market is more volatile, thus making it converge faster toward the price, this of course is done at the cost of some linearity. This is achieved by checking the "readjustment" option. The effects can be shown on BTCUSD, below the indicator without the readjusted option :
when the "readjustment" option is checked we have the following results :
The volatile down movement on BTCUSd make the upper extremity converge faster toward the price, this option can be great for volatile markets.
Conclusion
The recursive bands indicator prove to be an excellent framework that allow for the creation of lots of indicators, the proposed indicator is extremely efficient and provide an easy solution for returning linear support and resistances without much drawbacks, the readjusted option allow the indicator to adapt to the market volatility at the cost of linearity.
The performance of the indicator is relative to the motion of the price, however the indicator show signs of returning accurate support and resistances points. I hope the indicator find its use in the community.
Thanks for reading !
Note
Respect the house rules, always request permission before publishing open source code. This is an original work, requesting permission is the least you can do.
