OPEN-SOURCE SCRIPT
Chart CAGR

█ OVERVIEW
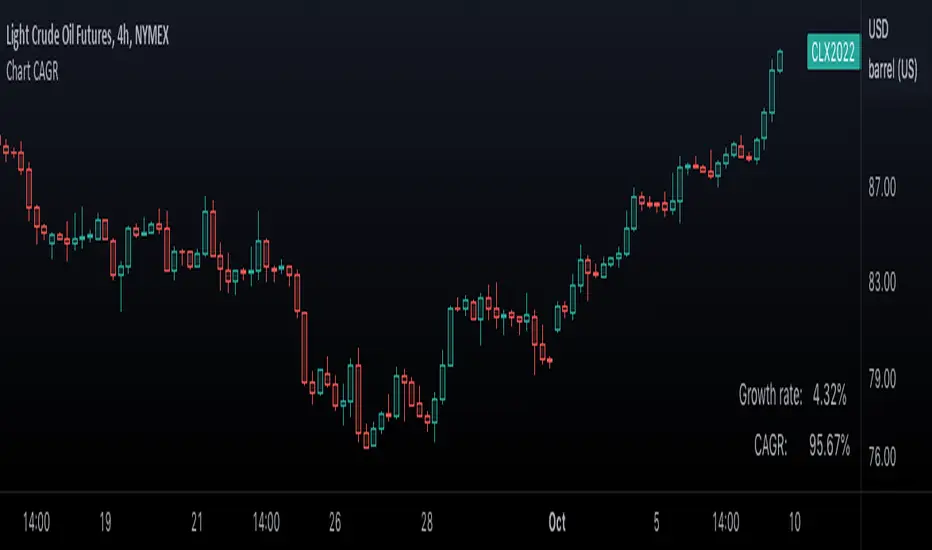
This simple script displays in the lower-right corner of the chart the Growth Rate and the Compound Annual Growth Rate (CAGR) between the open of the chart's first visible bar and the close of its last bar. As you zoom/scroll the chart, calculations will adjust to the chart's bars. You can change the location and colors of the displayed text in the script's settings.
If you need to calculate the CAGR between any two points on the chart, see our CAGR Custom Range indicator.
█ FOR Pine Script™ CODERS
Like our Chart VWAP publication, this script calculates on the range of visible bars utilizing the new Pine Script™ functions announced here and the VisibleChart library by PineCoders. It also uses the `cagr()` function from our ta library, which was recently augmented with many new functions.
Look first. Then leap.
Open-source Skript
Ganz im Sinne von TradingView hat dieser Autor sein/ihr Script als Open-Source veröffentlicht. Auf diese Weise können nun auch andere Trader das Script rezensieren und die Funktionalität überprüfen. Vielen Dank an den Autor! Sie können das Script kostenlos verwenden, aber eine Wiederveröffentlichung des Codes unterliegt unseren Hausregeln.
Share TradingView with a friend:
tradingview.com/share-your-love/
Check out all #tradingviewtips
tradingview.com/ideas/tradingviewtips/?type=education
New Tools and Features:
tradingview.com/blog/en/
tradingview.com/share-your-love/
Check out all #tradingviewtips
tradingview.com/ideas/tradingviewtips/?type=education
New Tools and Features:
tradingview.com/blog/en/
Haftungsausschluss
Die Informationen und Veröffentlichungen sind nicht als Finanz-, Anlage-, Handels- oder andere Arten von Ratschlägen oder Empfehlungen gedacht, die von TradingView bereitgestellt oder gebilligt werden, und stellen diese nicht dar. Lesen Sie mehr in den Nutzungsbedingungen.