OPEN-SOURCE SCRIPT
Mean Reversion Points [Clever Simplified]
📊 Indicator Name:
Mean Reversion Points [Clever Simplified]
🧠 Purpose
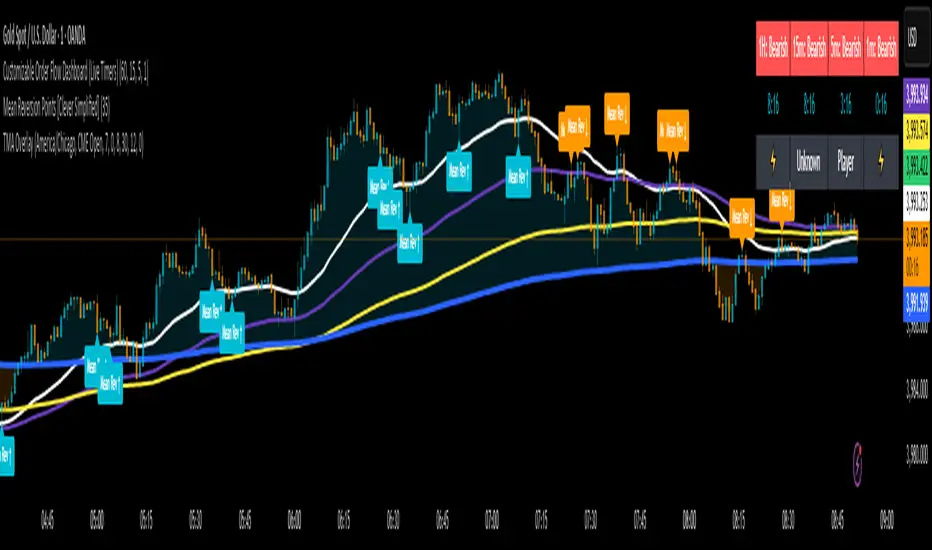
This indicator is designed to identify potential turning points in the market where the price may reverse back toward its mean (average) — a common concept in mean reversion trading strategies.
It simplifies the detection of overextended highs or lows by marking them visually on the chart, helping traders spot areas where price could correct or “revert” to a more balanced level.
⚙️ How It Works
1. Inputs
Lookback Period (len): Default 35 — defines how many previous bars are analyzed to determine highs and lows.
Show Labels / Show Markers: Toggles to display on-chart signals.
Colors:
Aqua → Mean Reversion Up (potential buy zone)
Orange → Mean Reversion Down (potential sell zone)
2. Core Calculations
The script calculates:
highest → The highest price in the last len bars.
lowest → The lowest price in the last len bars.
highest1 / lowest1 → Shorter-term highs and lows using a quarter of the main lookback (len / 4).
It then stores a “value” that updates depending on whether the price reaches a new high or low.
If the low = lowest, it records the corresponding highest level.
If the high = highest, it records the lowest level.
This dynamic relationship helps the indicator adapt as new bars form.
3. Bands for Comparison
Two “bands” are generated:
band: Long-term boundary based on full lookback period.
band1: Short-term boundary (faster and more responsive).
These act as reference zones to check when price is overstretched relative to its recent range.
4. Mean Reversion Logic
The indicator identifies potential reversal points using crossover conditions:
Mean Reversion Down (mean_rev_dn):
Triggers when the high crosses below the short-term upper band (band1), suggesting potential downward reversion (sell signal).
Mean Reversion Up (mean_rev_up):
Triggers when the low crosses above the short-term lower band (band1), suggesting potential upward reversion (buy signal).
These signals occur when price fails to maintain a breakout and is likely returning toward its mean.
5. Visual Output
If enabled:
Labels:
“Mean Rev ↓” → Placed above candles signaling a possible downward reversion.
“Mean Rev ↑” → Placed below candles signaling a possible upward reversion.
Markers:
Small colored triangles mark the same events for quick visual recognition.
💡 Practical Use
Best For: Swing traders and scalpers who trade reversals or range-bound markets.
Not Ideal For: Strong trending conditions, where price tends to move away from the mean instead of reverting.
Combination Tips: Works best when combined with:
RSI or Bollinger Bands for overbought/oversold confirmation.
Volume indicators to verify strength of reversals.
✅ Summary
Feature Description
Type Mean Reversion / Reversal Detector
Main Concept Identifies potential highs/lows where price may reverse
Signals Buy (Mean Rev ↑) and Sell (Mean Rev ↓)
Visualization Labels and triangles on chart
Customization Adjustable lookback period, markers, and colors USOIL
USOIL  DXY
DXY  BTCUSD
  XAUUSD
 EURUSD
 AUDJPY
Mean Reversion Points [Clever Simplified]
🧠 Purpose
This indicator is designed to identify potential turning points in the market where the price may reverse back toward its mean (average) — a common concept in mean reversion trading strategies.
It simplifies the detection of overextended highs or lows by marking them visually on the chart, helping traders spot areas where price could correct or “revert” to a more balanced level.
⚙️ How It Works
1. Inputs
Lookback Period (len): Default 35 — defines how many previous bars are analyzed to determine highs and lows.
Show Labels / Show Markers: Toggles to display on-chart signals.
Colors:
Aqua → Mean Reversion Up (potential buy zone)
Orange → Mean Reversion Down (potential sell zone)
2. Core Calculations
The script calculates:
highest → The highest price in the last len bars.
lowest → The lowest price in the last len bars.
highest1 / lowest1 → Shorter-term highs and lows using a quarter of the main lookback (len / 4).
It then stores a “value” that updates depending on whether the price reaches a new high or low.
If the low = lowest, it records the corresponding highest level.
If the high = highest, it records the lowest level.
This dynamic relationship helps the indicator adapt as new bars form.
3. Bands for Comparison
Two “bands” are generated:
band: Long-term boundary based on full lookback period.
band1: Short-term boundary (faster and more responsive).
These act as reference zones to check when price is overstretched relative to its recent range.
4. Mean Reversion Logic
The indicator identifies potential reversal points using crossover conditions:
Mean Reversion Down (mean_rev_dn):
Triggers when the high crosses below the short-term upper band (band1), suggesting potential downward reversion (sell signal).
Mean Reversion Up (mean_rev_up):
Triggers when the low crosses above the short-term lower band (band1), suggesting potential upward reversion (buy signal).
These signals occur when price fails to maintain a breakout and is likely returning toward its mean.
5. Visual Output
If enabled:
Labels:
“Mean Rev ↓” → Placed above candles signaling a possible downward reversion.
“Mean Rev ↑” → Placed below candles signaling a possible upward reversion.
Markers:
Small colored triangles mark the same events for quick visual recognition.
💡 Practical Use
Best For: Swing traders and scalpers who trade reversals or range-bound markets.
Not Ideal For: Strong trending conditions, where price tends to move away from the mean instead of reverting.
Combination Tips: Works best when combined with:
RSI or Bollinger Bands for overbought/oversold confirmation.
Volume indicators to verify strength of reversals.
✅ Summary
Feature Description
Type Mean Reversion / Reversal Detector
Main Concept Identifies potential highs/lows where price may reverse
Signals Buy (Mean Rev ↑) and Sell (Mean Rev ↓)
Visualization Labels and triangles on chart
Customization Adjustable lookback period, markers, and colors
Open-source Skript
Ganz im Sinne von TradingView hat dieser Autor sein/ihr Script als Open-Source veröffentlicht. Auf diese Weise können nun auch andere Trader das Script rezensieren und die Funktionalität überprüfen. Vielen Dank an den Autor! Sie können das Script kostenlos verwenden, aber eine Wiederveröffentlichung des Codes unterliegt unseren Hausregeln.
Haftungsausschluss
Die Informationen und Veröffentlichungen sind nicht als Finanz-, Anlage-, Handels- oder andere Arten von Ratschlägen oder Empfehlungen gedacht, die von TradingView bereitgestellt oder gebilligt werden, und stellen diese nicht dar. Lesen Sie mehr in den Nutzungsbedingungen.