OPEN-SOURCE SCRIPT
Aktualisiert Relative Volume Prices Index by @WilliamBelini
What is the impact for Volume to the Prices?
To respond this question, I formulate the hipótesis if a little Volume change a lot the Price, it's a reversion signal, and if a lot of Volume change a little the price, it´s because the price is established.
This is one of 3 indicators created to improve this hipótesis, named:
1. Relative Volume Prices Index by @WilliamBelini (RVPI)
2. Relative Market Status by @WilliamBelini (RMS)
3. Trade Trigger RVPI by @WilliamBelini (TTR)
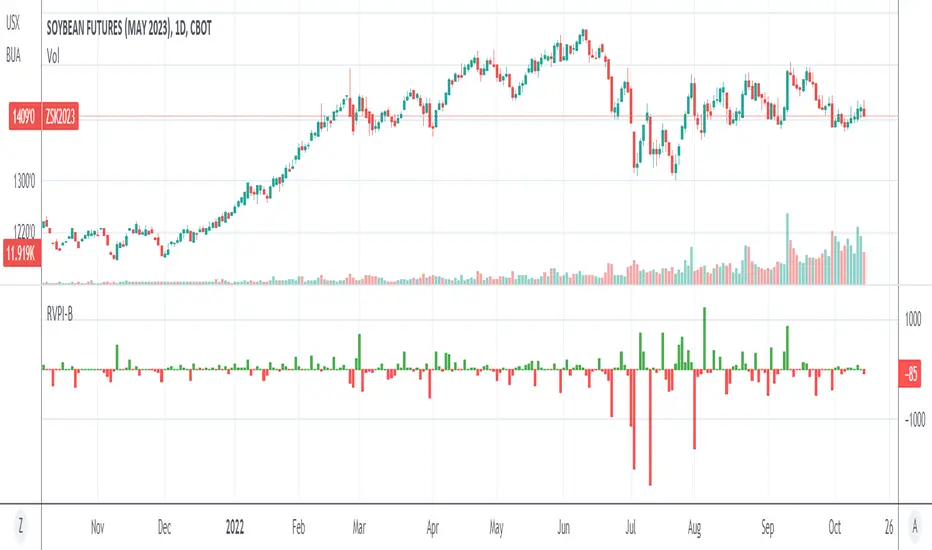
- The first show you the effect from volume to the prices, meas the sensibility of the variation;
- The second show you the feeling of the market by cicles, based at the cumulative average sensibility from the RVPI indicator;
- The third show you a trigger to trading positions, with the analysis of the historical RVPI data, based on the normal distribution of the futures price variation, by previos RVPI values and some rules created based on data behaviors identified.
To the end of this work, I can comprove the hipótesis, with simulations trading based from the TTR.
How we can´t monetize our work here, on TradingView platform, I´m disponibilize 2 of 3 indicators for you here free. If you want to have the third, discover how to contact with me (@ ;), and for me will be a pleasure to help you.
To respond this question, I formulate the hipótesis if a little Volume change a lot the Price, it's a reversion signal, and if a lot of Volume change a little the price, it´s because the price is established.
This is one of 3 indicators created to improve this hipótesis, named:
1. Relative Volume Prices Index by @WilliamBelini (RVPI)
2. Relative Market Status by @WilliamBelini (RMS)
3. Trade Trigger RVPI by @WilliamBelini (TTR)
- The first show you the effect from volume to the prices, meas the sensibility of the variation;
- The second show you the feeling of the market by cicles, based at the cumulative average sensibility from the RVPI indicator;
- The third show you a trigger to trading positions, with the analysis of the historical RVPI data, based on the normal distribution of the futures price variation, by previos RVPI values and some rules created based on data behaviors identified.
To the end of this work, I can comprove the hipótesis, with simulations trading based from the TTR.
How we can´t monetize our work here, on TradingView platform, I´m disponibilize 2 of 3 indicators for you here free. If you want to have the third, discover how to contact with me (@ ;), and for me will be a pleasure to help you.
Versionshinweise
Update the demonstration chart.Versionshinweise
Include Volume Indicator to the visualization chart.Versionshinweise
Deleted unnecessary inputs.Open-source Skript
Ganz im Sinne von TradingView hat dieser Autor sein/ihr Script als Open-Source veröffentlicht. Auf diese Weise können nun auch andere Trader das Script rezensieren und die Funktionalität überprüfen. Vielen Dank an den Autor! Sie können das Script kostenlos verwenden, aber eine Wiederveröffentlichung des Codes unterliegt unseren Hausregeln.
Haftungsausschluss
Die Informationen und Veröffentlichungen sind nicht als Finanz-, Anlage-, Handels- oder andere Arten von Ratschlägen oder Empfehlungen gedacht, die von TradingView bereitgestellt oder gebilligt werden, und stellen diese nicht dar. Lesen Sie mehr in den Nutzungsbedingungen.
Open-source Skript
Ganz im Sinne von TradingView hat dieser Autor sein/ihr Script als Open-Source veröffentlicht. Auf diese Weise können nun auch andere Trader das Script rezensieren und die Funktionalität überprüfen. Vielen Dank an den Autor! Sie können das Script kostenlos verwenden, aber eine Wiederveröffentlichung des Codes unterliegt unseren Hausregeln.
Haftungsausschluss
Die Informationen und Veröffentlichungen sind nicht als Finanz-, Anlage-, Handels- oder andere Arten von Ratschlägen oder Empfehlungen gedacht, die von TradingView bereitgestellt oder gebilligt werden, und stellen diese nicht dar. Lesen Sie mehr in den Nutzungsbedingungen.