OPEN-SOURCE SCRIPT
Forex Macro Metrics [MacroGlide]
"Forex Macro Metrics [MacroGlide]" is a powerful tool for analyzing macroeconomic metrics, designed to help traders make more informed decisions in the forex market. This indicator displays key economic indicators such as interest rates, money supply (M1 and M2), unemployment rate, and government debt for various currencies and their pairs, allowing users to assess the macroeconomic differences between the base and quote currencies.
Key Features:
• Interest Rates Display: Includes interest rates for major world currencies with the ability to show the differential between the base and quote currencies.
• Money Supply Analysis (M1 and M2): Displays the money supply for both the base and quote currencies, including differential calculations.
• Unemployment Rate: Compares the unemployment rates between currencies, showing the differences on the chart.
• Government Debt: Shows government debt levels for the base and quote currencies with differential calculations.
• Customizable Options: Enable/disable specific metrics and adjust colors for better visual clarity.
How to Use:
• Select a Currency Pair: Apply the indicator to your chart and choose the desired currency pair. The indicator will automatically load the relevant data for the base and quote currencies.
• Adjust Display Settings: Use the indicator settings to enable or disable specific metrics and their differentials.
• Analyze the Data: Compare the economic conditions of the two currencies through the charts and identify potential trading opportunities based on macroeconomic differences.
Methodology:
The indicator uses economic data available through TradingView tickers to calculate the values of the base and quote currencies. Differentials are calculated by subtracting the values of the quote currency from the base currency, allowing for a visual assessment of their differences. The displayed data includes historical changes, helping to identify trends and potential reversal points.
Originality and Usefulness:
"Forex Macro Metrics [MacroGlide]" is a unique tool that combines several key macroeconomic indicators into one comprehensive indicator. This simplifies the analysis process for traders looking to understand the fundamental differences between currencies. Using this approach provides an advantage in assessing long-term trends and potential shifts in currency pairs driven by changes in macroeconomic conditions.
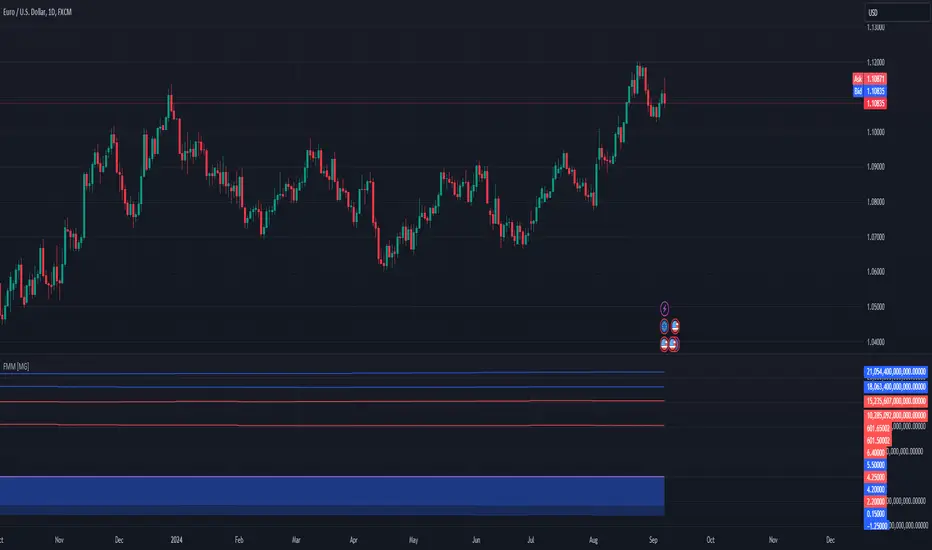
Charts:
The indicator displays data in the form of lines and areas on the chart, with interest rates shown as lines for the base and quote currencies, accompanied by an area representing the differential. For money supply (M1 and M2), lines are drawn for each currency, with areas highlighting the differences. Similarly, the unemployment rate and government debt are displayed with clear visual separation of the data and their differentials, making it easy to compare and analyze the macroeconomic conditions of the currencies involved.
Enjoy the game!
Key Features:
• Interest Rates Display: Includes interest rates for major world currencies with the ability to show the differential between the base and quote currencies.
• Money Supply Analysis (M1 and M2): Displays the money supply for both the base and quote currencies, including differential calculations.
• Unemployment Rate: Compares the unemployment rates between currencies, showing the differences on the chart.
• Government Debt: Shows government debt levels for the base and quote currencies with differential calculations.
• Customizable Options: Enable/disable specific metrics and adjust colors for better visual clarity.
How to Use:
• Select a Currency Pair: Apply the indicator to your chart and choose the desired currency pair. The indicator will automatically load the relevant data for the base and quote currencies.
• Adjust Display Settings: Use the indicator settings to enable or disable specific metrics and their differentials.
• Analyze the Data: Compare the economic conditions of the two currencies through the charts and identify potential trading opportunities based on macroeconomic differences.
Methodology:
The indicator uses economic data available through TradingView tickers to calculate the values of the base and quote currencies. Differentials are calculated by subtracting the values of the quote currency from the base currency, allowing for a visual assessment of their differences. The displayed data includes historical changes, helping to identify trends and potential reversal points.
Originality and Usefulness:
"Forex Macro Metrics [MacroGlide]" is a unique tool that combines several key macroeconomic indicators into one comprehensive indicator. This simplifies the analysis process for traders looking to understand the fundamental differences between currencies. Using this approach provides an advantage in assessing long-term trends and potential shifts in currency pairs driven by changes in macroeconomic conditions.
Charts:
The indicator displays data in the form of lines and areas on the chart, with interest rates shown as lines for the base and quote currencies, accompanied by an area representing the differential. For money supply (M1 and M2), lines are drawn for each currency, with areas highlighting the differences. Similarly, the unemployment rate and government debt are displayed with clear visual separation of the data and their differentials, making it easy to compare and analyze the macroeconomic conditions of the currencies involved.
Enjoy the game!
Open-source Skript
Ganz im Sinne von TradingView hat dieser Autor sein/ihr Script als Open-Source veröffentlicht. Auf diese Weise können nun auch andere Trader das Script rezensieren und die Funktionalität überprüfen. Vielen Dank an den Autor! Sie können das Script kostenlos verwenden, aber eine Wiederveröffentlichung des Codes unterliegt unseren Hausregeln.
Haftungsausschluss
Die Informationen und Veröffentlichungen sind nicht als Finanz-, Anlage-, Handels- oder andere Arten von Ratschlägen oder Empfehlungen gedacht, die von TradingView bereitgestellt oder gebilligt werden, und stellen diese nicht dar. Lesen Sie mehr in den Nutzungsbedingungen.