OPEN-SOURCE SCRIPT
Aktualisiert Bias Table
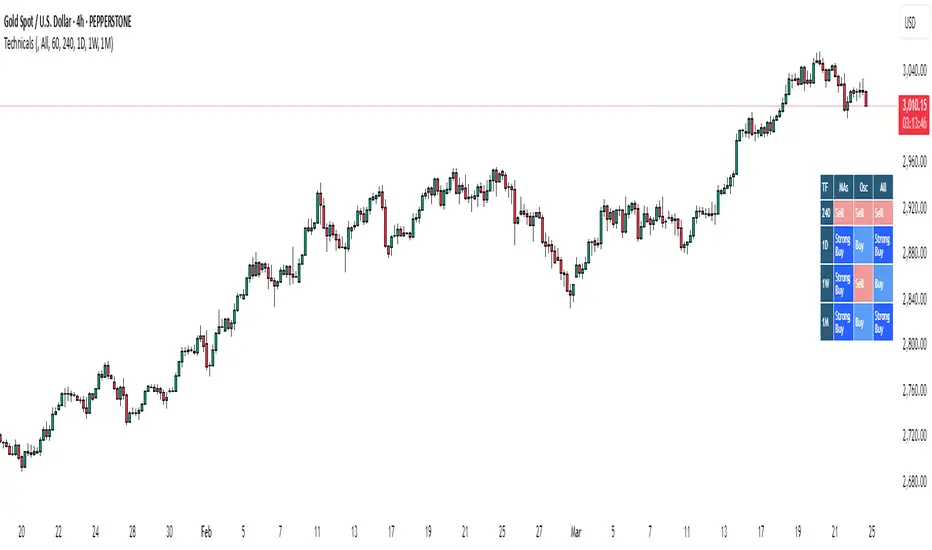
Overview
The Bias Table Indicator is a multi-timeframe analysis tool designed to provide a quick sentiment overview across multiple timeframes. It combines signals from Moving Averages (MAs) and Oscillators to determine market bias, helping traders make more informed decisions.
Key Features
✔ Multi-Timeframe Analysis (MTF) – Displays market bias across up to five timeframes.
✔ Customizable Signals – Choose whether bias is based on Moving Averages (MAs), Oscillators, or a combination of both.
✔ Visual Table Format – The indicator presents the bias as a color-coded table in the bottom-right corner of the chart for quick reference.
✔ Adjustable Colors & Display Settings – Users can customize colors for different sentiment states (Strong Buy, Buy, Neutral, Sell, Strong Sell).
How It Works
Bias Calculation: The indicator evaluates market conditions using preset values (which can be replaced with actual logic) to determine sentiment for each timeframe.
Multi-Timeframe Support: The table can display bias from hourly to monthly timeframes, giving traders a broader view of market conditions.
Customizable Signals: Users can filter the table to show bias based only on MAs, Oscillators, or a combination of both.
Interpreting the Table
📊 Timeframes: The leftmost column shows selected timeframes (e.g., 1H, 4H, 1D, 1W, 1M).
📈 Signal Columns:
MAs – Bias based on Moving Averages.
Oscillators – Bias based on momentum indicators like RSI, Stochastics, etc.
All – A combined bias based on both MAs & Oscillators.
🚦 Color-Coded Ratings:
🔵 Strong Buy – High bullish strength.
🔹 Buy – Moderate bullish sentiment.
⚪ Neutral – No clear trend.
🔸 Sell – Moderate bearish sentiment.
🔴 Strong Sell – High bearish strength.
Best Used For:
📈 Trend Confirmation: Validate signals from your primary strategy.
⏳ Multi-Timeframe Analysis: See whether short-term and long-term trends align.
⚡ Quick Sentiment Check: Get a high-level view of market conditions without analyzing multiple indicators separately.
Customization Options:
Select which timeframes to include in the table.
Choose whether to base bias on MAs, Oscillators, or both.
Adjust colors for each signal type.
Versionshinweise
OverviewThe Bias Table Indicator is a multi-timeframe analysis tool designed to provide a quick sentiment overview across multiple timeframes. It combines signals from Moving Averages (MAs) and Oscillators to determine market bias, helping traders make more informed decisions.
Key Features
✔ Multi-Timeframe Analysis (MTF) – Displays market bias across up to five timeframes.
✔ Customizable Signals – Choose whether bias is based on Moving Averages (MAs), Oscillators, or a combination of both.
✔ Visual Table Format – The indicator presents the bias as a color-coded table in the bottom-right corner of the chart for quick reference.
✔ Adjustable Colors & Display Settings – Users can customize colors for different sentiment states (Strong Buy, Buy, Neutral, Sell, Strong Sell).
How It Works
Bias Calculation: The indicator evaluates market conditions using preset values (which can be replaced with actual logic) to determine sentiment for each timeframe.
Multi-Timeframe Support: The table can display bias from hourly to monthly timeframes, giving traders a broader view of market conditions.
Customizable Signals: Users can filter the table to show bias based only on MAs, Oscillators, or a combination of both.
Interpreting the Table
📊 Timeframes: The leftmost column shows selected timeframes (e.g., 1H, 4H, 1D, 1W, 1M).
📈 Signal Columns:
MAs – Bias based on Moving Averages.
Oscillators – Bias based on momentum indicators like RSI, Stochastics, etc.
All – A combined bias based on both MAs & Oscillators.
🚦 Color-Coded Ratings:
🔵 Strong Buy – High bullish strength.
🔹 Buy – Moderate bullish sentiment.
⚪ Neutral – No clear trend.
🔸 Sell – Moderate bearish sentiment.
🔴 Strong Sell – High bearish strength.
Best Used For:
📈 Trend Confirmation: Validate signals from your primary strategy.
⏳ Multi-Timeframe Analysis: See whether short-term and long-term trends align.
⚡ Quick Sentiment Check: Get a high-level view of market conditions without analyzing multiple indicators separately.
Customization Options:
Select which timeframes to include in the table.
Choose whether to base bias on MAs, Oscillators, or both.
Adjust colors for each signal type.
Open-source Skript
Ganz im Sinne von TradingView hat dieser Autor sein/ihr Script als Open-Source veröffentlicht. Auf diese Weise können nun auch andere Trader das Script rezensieren und die Funktionalität überprüfen. Vielen Dank an den Autor! Sie können das Script kostenlos verwenden, aber eine Wiederveröffentlichung des Codes unterliegt unseren Hausregeln.
Haftungsausschluss
Die Informationen und Veröffentlichungen sind nicht als Finanz-, Anlage-, Handels- oder andere Arten von Ratschlägen oder Empfehlungen gedacht, die von TradingView bereitgestellt oder gebilligt werden, und stellen diese nicht dar. Lesen Sie mehr in den Nutzungsbedingungen.