OPEN-SOURCE SCRIPT
Trend Length
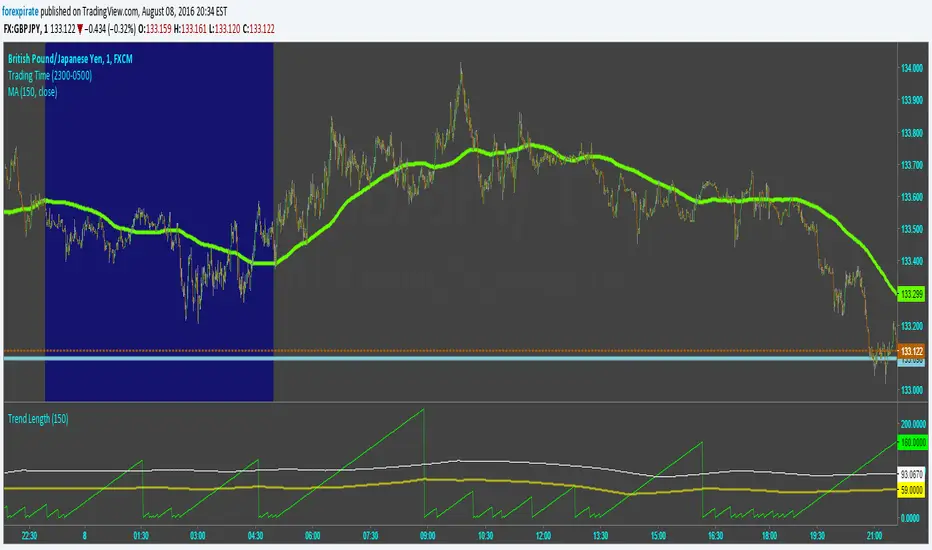
Script tries to capture the length of trends. It calculates an SMA and then determines the slope of the SMA using a simple momentum function. From there it counts bars from when the slope changed directions last. The lime green line is the count from when the slope changed. The yellow line is the average time of a trend. The white line is "trying" to capture the length of a full healthy pip running trend. Pick and SMA you like and then run through many currencies. I find that trends tend to be the same length. Not surprising as the markets are extremely correlated to each other. The trick is to find the most active pair for action. To do that look up my Pairs Range script.
Comments are welcome.
Comments are welcome.
Open-source Skript
Ganz im Sinne von TradingView hat dieser Autor sein/ihr Script als Open-Source veröffentlicht. Auf diese Weise können nun auch andere Trader das Script rezensieren und die Funktionalität überprüfen. Vielen Dank an den Autor! Sie können das Script kostenlos verwenden, aber eine Wiederveröffentlichung des Codes unterliegt unseren Hausregeln.
Haftungsausschluss
Die Informationen und Veröffentlichungen sind nicht als Finanz-, Anlage-, Handels- oder andere Arten von Ratschlägen oder Empfehlungen gedacht, die von TradingView bereitgestellt oder gebilligt werden, und stellen diese nicht dar. Lesen Sie mehr in den Nutzungsbedingungen.