OPEN-SOURCE SCRIPT
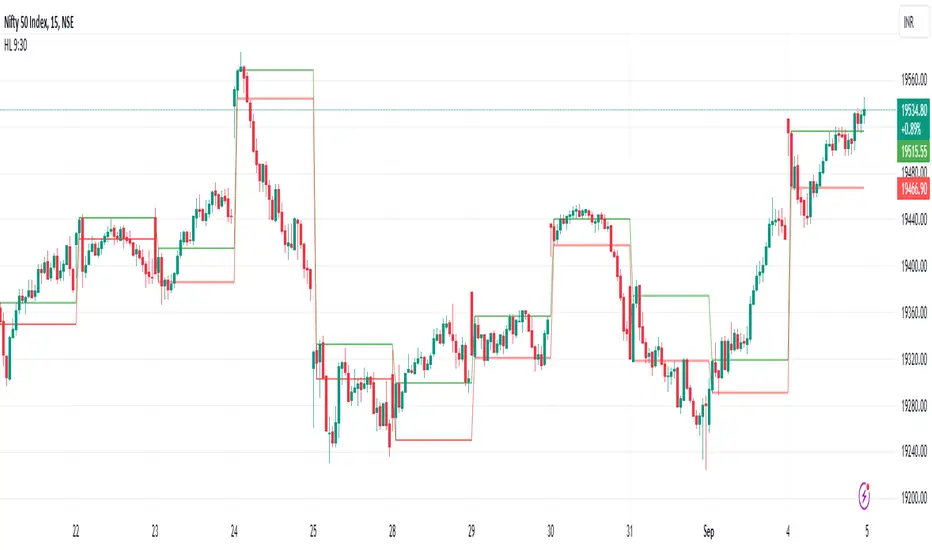
HL 930 by JP

The "High and Low of 9:30 Candle" strategy is a simple trading strategy commonly used in the stock market and other financial markets. It involves using the price range (high and low) of the first candlestick that forms at the opening of a trading session, typically at 9:30 AM, as a basis for making trading decisions. Here's a description of this strategy:
1. Timeframe: This strategy is often applied to intraday trading, where traders focus on short-term price movements within a single trading day.
2. 9:30 AM Candle: The strategy begins by observing the first candlestick that forms at 9:30 AM, which is the opening time for many stock markets, including the New York Stock Exchange (NYSE). This candle represents the price action during the first few minutes of trading.
3. High and Low: Identify the highest price (the candle's high) and the lowest price (the candle's low) during the 9:30 AM candle's time period. These price levels are critical for the strategy.
4. Trading Decisions:
Long (Buy) Signal: If the current market price breaks above the high of the 9:30 AM candle, it may trigger a bullish signal. Traders may consider entering a long (buy) position, anticipating further upward momentum.
Short (Sell) Signal: Conversely, if the market price breaks below the low of the 9:30 AM candle, it may trigger a bearish signal. Traders may consider entering a short (sell) position, anticipating further downward movement.
5. Stop-Loss and Take-Profit: To manage risk, traders often set stop-loss orders just below the low (for long positions) or just above the high (for short positions) of the 9:30 AM candle. They may also establish take-profit levels based on their risk-reward preferences.
6. Time Frame: This strategy is typically used for short-term trading and may be effective in capturing quick price movements that often occur at the market open. Traders often close their positions before the end of the trading day.
7. Caution: While the "High and Low of 9:30 Candle" strategy can be straightforward, it should not be used in isolation. Traders should consider other technical and fundamental factors, such as volume, market sentiment, news events, and overall market trends, when making trading decisions.
Remember that trading strategies always carry risks, and it's essential to have a well-thought-out risk management plan in place. Additionally, backtesting and practice are crucial before implementing any trading strategy in a live market to evaluate its historical performance and suitability for your trading style.
Open-source Skript
Ganz im Sinne von TradingView hat dieser Autor sein/ihr Script als Open-Source veröffentlicht. Auf diese Weise können nun auch andere Trader das Script rezensieren und die Funktionalität überprüfen. Vielen Dank an den Autor! Sie können das Script kostenlos verwenden, aber eine Wiederveröffentlichung des Codes unterliegt unseren Hausregeln.
Haftungsausschluss
Die Informationen und Veröffentlichungen sind nicht als Finanz-, Anlage-, Handels- oder andere Arten von Ratschlägen oder Empfehlungen gedacht, die von TradingView bereitgestellt oder gebilligt werden, und stellen diese nicht dar. Lesen Sie mehr in den Nutzungsbedingungen.