OPEN-SOURCE SCRIPT
Aktualisiert XBT Contango Calculator v1.1

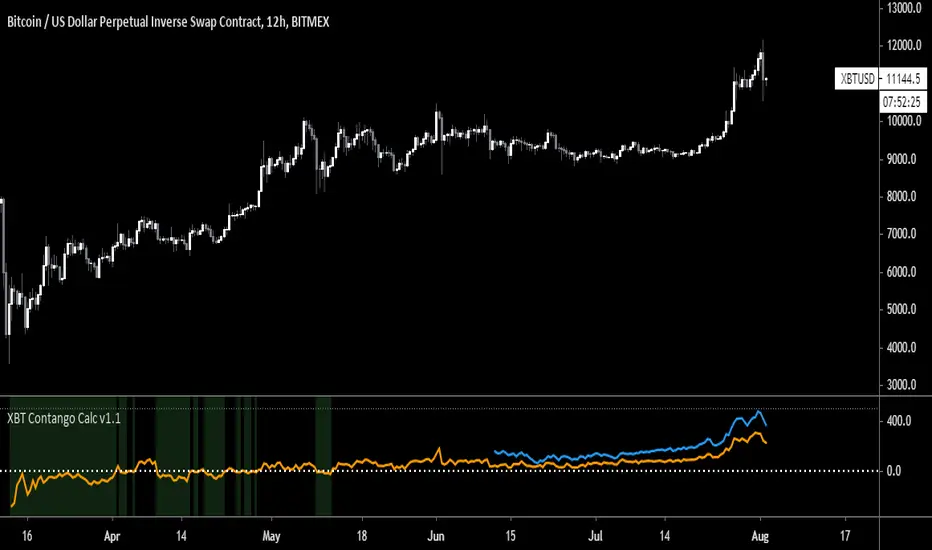
This indicator measures value of basis (or spread) of current Futures contracts compared to spot. The default settings are specifically for Bitmex XBTU19 and XBTZ19 futures contracts. These will need to be updated after expiration. Also, it seems that Tradingview does not keep charts of expired contracts. If anyone knows how to import data from previous expired contracts, please let me know. This historical data could be valuable for evaluating previous XBT futures curves.
Also, VERY important to understand is this indicator only works with Spot Bitcoin charts (XBTUSD, BTCUSD, etc). If you add this to any other asset chart, it would not be useful (unless you changed settings to evaluate a different Futures product).
Contango and Backwardation are important fundamental indicators to keep track of while trading Futures markets. For a better explanation, Ugly Old Goat had done several medium articles on this. Please check out link below for his latest article on the subject...
https://uglyoldgoat.com/blog/the-contango-is-a-blessing-for-miners-and-a-curse-for-speculators
Notes on chart above should explain most of what you need to know on to use this indicator. The zero line is the spot price on the chart, so a positive value means Futures are trading at a premium (or in Contango). You can set a value of extreme Contango which will give an alert as red background (default setting is +$500). Green background will appear when Futures are trading at a discount to spot (Backwardation).
Hope some people get some use out of this. This is my first attempt at coding anything, so any feedback would be greatly appreciated!
BTC Donations: 3CypEdvBcvVHbqzHUt1FDiUG53U7pYWviV
Versionshinweise
Updated Futures contract due to XBTU19 expired. Current Futures areXBTZ19 - Blue
XBTH20 - Orange
Versionshinweise
Try posting update again with correct chart (ignore previous chart). One thing I have noticed is that since the indicator calculates Contango/Backwardation based on price close, the historical data will not show contango/backwardation high/low extremes Also, will not show backwardation at all, if that time frame did not close in backwardation. For instance, backwardation happens so fast you may need to a lower timeframe, for example 1 hour chart above shows XBTZ19 went into backwardation on July 16, 2019 and September 24, 2019.
This indicator will calculate in real time, but does not accurately show how high/low it got historically. I am working to hopefully fix this in version 2.0 which i have been working on. New version will show high and low for each candle. For instance, it will show on September 24th daily high for XBTZ19 contango was +272 and daily low was -172 backwardation. A 444 point swing in one day! However, it may take me a while to finalize version 2 so don't hold your breath.
Versionshinweise
Updated for June futures XBTM20Versionshinweise
Minor edit to make sure it complies with the "House Rules." Indicator functionality wont changeVersionshinweise
Update to add XBTU20 - September FuturesVersionshinweise
Updated to add December futures XBTZ20Converted to version 4 pine script
Open-source Skript
Ganz im Sinne von TradingView hat dieser Autor sein/ihr Script als Open-Source veröffentlicht. Auf diese Weise können nun auch andere Trader das Script rezensieren und die Funktionalität überprüfen. Vielen Dank an den Autor! Sie können das Script kostenlos verwenden, aber eine Wiederveröffentlichung des Codes unterliegt unseren Hausregeln.
Feel free to reach out to me @SchamBTC on Twitter or Telegram.
If you like my work you can show your support buy sending a donation to the following BTC address: 3CypEdvBcvVHbqzHUt1FDiUG53U7pYWviV
If you like my work you can show your support buy sending a donation to the following BTC address: 3CypEdvBcvVHbqzHUt1FDiUG53U7pYWviV
Haftungsausschluss
Die Informationen und Veröffentlichungen sind nicht als Finanz-, Anlage-, Handels- oder andere Arten von Ratschlägen oder Empfehlungen gedacht, die von TradingView bereitgestellt oder gebilligt werden, und stellen diese nicht dar. Lesen Sie mehr in den Nutzungsbedingungen.