OPEN-SOURCE SCRIPT
Spider Lines For Bitcoin (Daily And Weekly)
I haven't seen any indicator do this, so I decided to publish this to form automatic Spider Charts without actually going through the effort of drawing them!
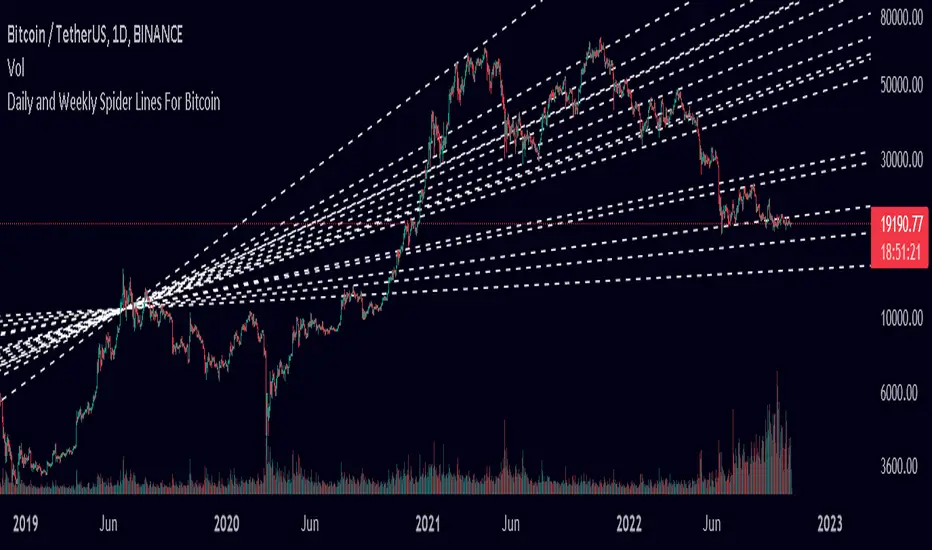
This script charts dotted lines (spider lines) all over, depicting support and resistance levels.
It works by connecting some candles from the 2018 bear market to the candle from 1st July 2019, followed by extending the lines to the right, making support and resistance levels for the future. The script works only for the daily and weekly charts for Bitcoin.
The levels are accurate to a good extent.
If the lines don't load, zoom out until the 2018 bear market top and it should load then.
Have fun with this indicator!
Open-source Skript
Ganz im Sinne von TradingView hat dieser Autor sein/ihr Script als Open-Source veröffentlicht. Auf diese Weise können nun auch andere Trader das Script rezensieren und die Funktionalität überprüfen. Vielen Dank an den Autor! Sie können das Script kostenlos verwenden, aber eine Wiederveröffentlichung des Codes unterliegt unseren Hausregeln.
Haftungsausschluss
Die Informationen und Veröffentlichungen sind nicht als Finanz-, Anlage-, Handels- oder andere Arten von Ratschlägen oder Empfehlungen gedacht, die von TradingView bereitgestellt oder gebilligt werden, und stellen diese nicht dar. Lesen Sie mehr in den Nutzungsbedingungen.