OPEN-SOURCE SCRIPT
Aktualisiert Greer Value Yields Line

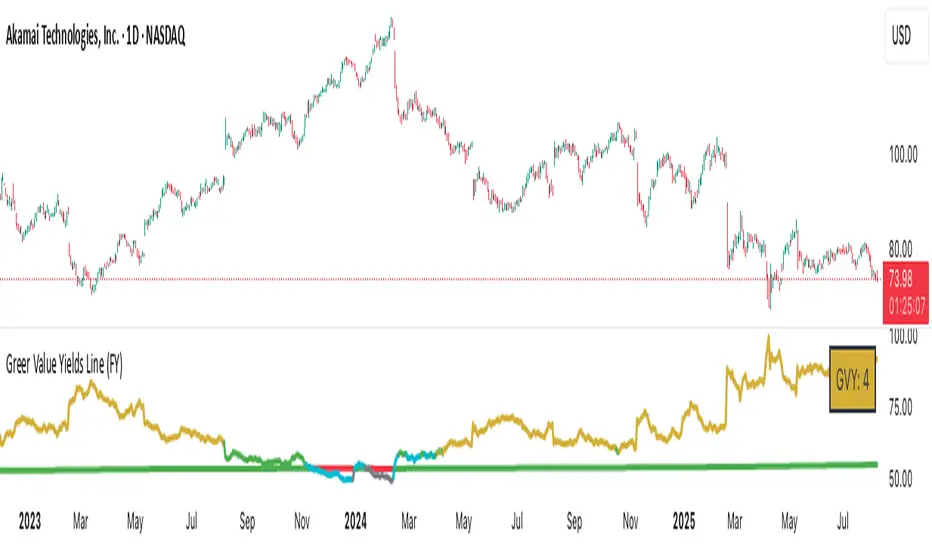
📈 Greer Value Yields Line – Valuation Signal Without the Clutter
Part of the Greer Financial Toolkit, this streamlined indicator tracks four valuation-based yield metrics and presents them clearly via the Data Window, GVY Score badge, and an optional Yield Table:
Earnings Yield (EPS ÷ Price)
FCF Yield (Free Cash Flow ÷ Price)
Revenue Yield (Revenue per Share ÷ Price)
Book Value Yield (Book Value per Share ÷ Price)
✅ Each yield is compared against its historical average
✅ A point is scored for each metric above average (0–4 total)
✅ Color-coded GVY Score badge highlights valuation strength
✅ Yield trend-lines Totals (TVAVG & TVPCT) help assess direction
✅ Clean layout: no chart clutter – just actionable insights
🧮 GVY Score Color Coding (0–4):
⬜ 0 = None (White)
⬜ 1 = Weak (Gray)
🟦 2 = Neutral (Aqua)
🟩 3 = Strong (Green)
🟨 4 = Gold Exceptional (All metrics above average)
Total Value Average Line Color Coding:
🟥 Red – Average trending down
🟩 Green – Average trending up
Ideal for long-term investors focused on fundamental valuation, not short-term noise.
Enable the table and badge for a compact yield dashboard — or keep it minimal with just the Data Window and trend-lines.
Versionshinweise
Adjusted Gold hue to a richer, more authentic tone—reduced the overly yellow tint that could be misread as a caution signal.Versionshinweise
*Fixed the Chart.Adjusted Gold hue to a richer, more authentic tone—reduced the overly yellow tint that could be misread as a caution signal.
Added the ability to toggle between Fiscal Year (FY) and Fiscal Quarter (FQ) views—now you can analyze quarterly data as well as annual metrics for greater flexibility.
Open-source Skript
Ganz im Sinne von TradingView hat dieser Autor sein/ihr Script als Open-Source veröffentlicht. Auf diese Weise können nun auch andere Trader das Script rezensieren und die Funktionalität überprüfen. Vielen Dank an den Autor! Sie können das Script kostenlos verwenden, aber eine Wiederveröffentlichung des Codes unterliegt unseren Hausregeln.
Haftungsausschluss
Die Informationen und Veröffentlichungen sind nicht als Finanz-, Anlage-, Handels- oder andere Arten von Ratschlägen oder Empfehlungen gedacht, die von TradingView bereitgestellt oder gebilligt werden, und stellen diese nicht dar. Lesen Sie mehr in den Nutzungsbedingungen.