OPEN-SOURCE SCRIPT
Aktualisiert IPDA Ranges – Pro
### IPDA Ranges – Pro
**Overview**
The **IPDA Ranges – Pro** indicator brings the core concepts of the Interbank Price Delivery Algorithm (IPDA) from ICT (Inner Circle Trader) mentorship to life on TradingView. Inspired by ICT's foundational video on [The IPDA Model](youtube.com/watch?v=043OW8trIJE), this tool visualizes multi-period price ranges (20, 40, or 60 days) to decode institutional order flow, identify discount/premium zones, and highlight algorithmic price delivery points.
IPDA, as explained by ICT, is the "source code" behind market structure—grading ranges into quadrants to reveal high-probability support/resistance, fair value gaps, and liquidity draws. By anchoring on daily highs/lows, it filters noise, anticipates retracements, and aligns price action with time-based delivery (e.g., during key sessions like 10 AM–2 PM ET). This indicator automates the process, making it easier to spot "permissible" moves without manual charting.
**Key Features**
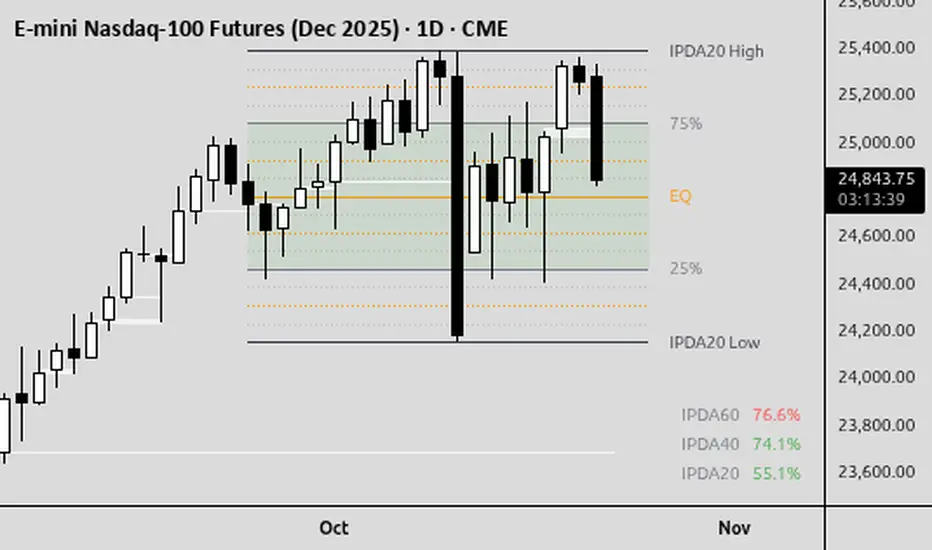
- **Dynamic Ranges**: Plots customizable IPDA periods (IPDA20, IPDA40, IPDA60) based on daily highest highs and lowest lows. Equilibrium (50% midpoint) acts as the core reference for mean reversion.
- **Quadrant Breakdown**: Divides each range into 25% steps—lower quadrant (deep discount), 25%/75% lines (consequent encroachment edges), and upper quadrant (premium). Optional subquadrants (12.5% steps) for finer granularity.
- **Visual Modes**:
- **Boxes**: Shade discount (below equilibrium) and premium (above) areas for intuitive zoning.
- **Lines**: Clean horizontal lines for highs, lows, equilibrium, and quadrants—ideal for lower timeframes.
- **Mid-Zone Highlight**: Optional shading of the 25%–75% "fair value" zone (customizable color/opacity) to flag balanced delivery areas where bodies often respect levels.
- **Info Table**: Choose from:
- **Table A**: Labels current price location as "Discount" or "Premium" per range (green for mid-zone).
- **Table B**: Shows distance from equilibrium in % (e.g., "52.3%") for precise positioning.
- **Customization**:
- Toggle labels (high/low, quadrants, prices), line styles (solid/dotted/dashed), extensions, and table position.
- Colors for discount/premium, equilibrium, and zones.
- Alerts for mid-zone entry/exit to catch order flow shifts.
- **Performance**: Runs efficiently on any timeframe/symbol, pulling daily data via `request.security` for accuracy.
**How It Works**
1. **Range Calculation**: For each selected period (e.g., IPDA20), it fetches the highest high and lowest low over the past N daily bars. Equilibrium = (High + Low) / 2.
2. **Zoning**:
- **Discount**: Below equilibrium (institutional buying opportunity).
- **Premium**: Above equilibrium (potential selling pressure).
- **Quadrants**: 25% (q1) and 75% (q3) lines mark edges of the "mid-zone," where price often consolidates or traps retail before directional runs.
3. **Plotting**: On the last bar, draws boxes/lines from the range start to current bar. Labels show levels (e.g., "IPDA20 High @ 1.2345").
4. **Usage Example**: On EURUSD daily, enable IPDA20. If price pierces a premium wick's low into the lower quadrant during a bullish shift (per ICT), expect a run to liquidity—use the table's % reading to gauge strength (e.g., <25% = deep discount buy). Transpose to 5-min for entries aligning with FVGs or order blocks.
**Trading Tips**
- **Higher Timeframe Bias**: Use on daily/4H for structure; drop to 1H/15M for entries. Focus on bodies (not wicks) respecting quadrants—wicks signal traps.
- **ICT Alignment**: Pair with PD Arrays (premium/discount wicks) or Market Maker models. In trends, extend to IPDA40/60; ignore extremes unless full reversals occur.
- **Risk Management**: Target liquidity pools at equal highs/lows. Avoid overleveraging—IPDA shines in 7–10 AM ET for optimal delivery. Backtest random 20-day periods to validate.
- **Best For**: Forex, indices (e.g., NAS100), commodities (e.g., Gold). Test on demo first.
Special Thanks to toodegrees for sharing the original base script.
More features to be added.
**Disclaimer**
This indicator is for educational purposes only and does not constitute financial advice. Past performance isn't indicative of future results. Trading involves substantial risk—use at your own discretion. Hypothetical results may not reflect real-market factors like slippage or liquidity. Always consult a licensed advisor.
**Author**: © MadMonkTrading (Mozilla Public License 2.0)
**Version**: Pine Script v5 | Questions? Drop a comment below!
Versionshinweise
### IPDA Ranges – Pro**Overview**
The **IPDA Ranges – Pro** indicator brings the core concepts of the Interbank Price Delivery Algorithm (IPDA) from ICT (Inner Circle Trader) mentorship to life on TradingView. Inspired by ICT's foundational video on [The IPDA Model](youtube.com/watch?v=043OW8trIJE), this tool visualizes multi-period price ranges (20, 40, or 60 days) to decode institutional order flow, identify discount/premium zones, and highlight algorithmic price delivery points.
IPDA, as explained by ICT, is the "source code" behind market structure—grading ranges into quadrants to reveal high-probability support/resistance, fair value gaps, and liquidity draws. By anchoring on daily highs/lows, it filters noise, anticipates retracements, and aligns price action with time-based delivery (e.g., during key sessions like 10 AM–2 PM ET). This indicator automates the process, making it easier to spot "permissible" moves without manual charting.
**Key Features**
- **Dynamic Ranges**: Plots customizable IPDA periods (IPDA20, IPDA40, IPDA60) based on daily highest highs and lowest lows. Equilibrium (50% midpoint) acts as the core reference for mean reversion.
- **Quadrant Breakdown**: Divides each range into 25% steps—lower quadrant (deep discount), 25%/75% lines (consequent encroachment edges), and upper quadrant (premium). Optional subquadrants (12.5% steps) for finer granularity.
- **Visual Modes**:
- **Boxes**: Shade discount (below equilibrium) and premium (above) areas for intuitive zoning.
- **Lines**: Clean horizontal lines for highs, lows, equilibrium, and quadrants—ideal for lower timeframes.
- **Mid-Zone Highlight**: Optional shading of the 25%–75% "fair value" zone (customizable color/opacity) to flag balanced delivery areas where bodies often respect levels.
- **Info Table**: Choose from:
- **Table A**: Labels current price location as "Discount" or "Premium" per range (green for mid-zone).
- **Table B**: Shows distance from equilibrium in % (e.g., "52.3%") for precise positioning.
- **Customization**:
- Toggle labels (high/low, quadrants, prices), line styles (solid/dotted/dashed), extensions, and table position.
- Colors for discount/premium, equilibrium, and zones.
- Alerts for mid-zone entry/exit to catch order flow shifts.
- **Performance**: Runs efficiently on any timeframe/symbol, pulling daily data via `request.security` for accuracy.
**How It Works**
1. **Range Calculation**: For each selected period (e.g., IPDA20), it fetches the highest high and lowest low over the past N daily bars. Equilibrium = (High + Low) / 2.
2. **Zoning**:
- **Discount**: Below equilibrium (institutional buying opportunity).
- **Premium**: Above equilibrium (potential selling pressure).
- **Quadrants**: 25% (q1) and 75% (q3) lines mark edges of the "mid-zone," where price often consolidates or traps retail before directional runs.
3. **Plotting**: On the last bar, draws boxes/lines from the range start to current bar. Labels show levels (e.g., "IPDA20 High @ 1.2345").
4. **Usage Example**: On EURUSD daily, enable IPDA20. If price pierces a premium wick's low into the lower quadrant during a bullish shift (per ICT), expect a run to liquidity—use the table's % reading to gauge strength (e.g., <25% = deep discount buy). Transpose to 5-min for entries aligning with FVGs or order blocks.
**Trading Tips**
- **Higher Timeframe Bias**: Use on daily/4H for structure; drop to 1H/15M for entries. Focus on bodies (not wicks) respecting quadrants—wicks signal traps.
- **ICT Alignment**: Pair with PD Arrays (premium/discount wicks) or Market Maker models. In trends, extend to IPDA40/60; ignore extremes unless full reversals occur.
- **Risk Management**: Target liquidity pools at equal highs/lows. Avoid overleveraging—IPDA shines in 7–10 AM ET for optimal delivery. Backtest random 20-day periods to validate.
- **Best For**: Forex, indices (e.g., NAS100), commodities (e.g., Gold). Test on demo first.
Special Thanks to toodegrees for sharing the original base script.
More features to be added.
**Disclaimer**
This indicator is for educational purposes only and does not constitute financial advice. Past performance isn't indicative of future results. Trading involves substantial risk—use at your own discretion. Hypothetical results may not reflect real-market factors like slippage or liquidity. Always consult a licensed advisor.
**Author**: © MadMonkTrading (Mozilla Public License 2.0)
**Version**: Pine Script v5 | Questions? Drop a comment below!
--------------
UPDATE
10/22/2025
*fixed bug
*updated sub-quadrants
*added option to toggle on/off sub-quadrant labels
*added right side buffer
Versionshinweise
### IPDA Ranges – Pro**Overview**
The **IPDA Ranges – Pro** indicator brings the core concepts of the Interbank Price Delivery Algorithm (IPDA) from ICT (Inner Circle Trader) mentorship to life on TradingView. Inspired by ICT's foundational video on [The IPDA Model](youtube.com/watch?v=043OW8trIJE), this tool visualizes multi-period price ranges (20, 40, or 60 days) to decode institutional order flow, identify discount/premium zones, and highlight algorithmic price delivery points.
IPDA, as explained by ICT, is the "source code" behind market structure—grading ranges into quadrants to reveal high-probability support/resistance, fair value gaps, and liquidity draws. By anchoring on daily highs/lows, it filters noise, anticipates retracements, and aligns price action with time-based delivery (e.g., during key sessions like 10 AM–2 PM ET). This indicator automates the process, making it easier to spot "permissible" moves without manual charting.
**Key Features**
- **Dynamic Ranges**: Plots customizable IPDA periods (IPDA20, IPDA40, IPDA60) based on daily highest highs and lowest lows. Equilibrium (50% midpoint) acts as the core reference for mean reversion.
- **Quadrant Breakdown**: Divides each range into 25% steps—lower quadrant (deep discount), 25%/75% lines (consequent encroachment edges), and upper quadrant (premium). Optional subquadrants (12.5% steps) for finer granularity.
- **Visual Modes**:
- **Boxes**: Shade discount (below equilibrium) and premium (above) areas for intuitive zoning.
- **Lines**: Clean horizontal lines for highs, lows, equilibrium, and quadrants—ideal for lower timeframes.
- **Mid-Zone Highlight**: Optional shading of the 25%–75% "fair value" zone (customizable color/opacity) to flag balanced delivery areas where bodies often respect levels.
- **Info Table**: Choose from:
- **Table A**: Labels current price location as "Discount" or "Premium" per range (green for mid-zone).
- **Table B**: Shows distance from equilibrium in % (e.g., "52.3%") for precise positioning.
- **Customization**:
- Toggle labels (high/low, quadrants, prices), line styles (solid/dotted/dashed), extensions, and table position.
- Colors for discount/premium, equilibrium, and zones.
- Alerts for mid-zone entry/exit to catch order flow shifts.
- **Performance**: Runs efficiently on any timeframe/symbol, pulling daily data via `request.security` for accuracy.
**How It Works**
1. **Range Calculation**: For each selected period (e.g., IPDA20), it fetches the highest high and lowest low over the past N daily bars. Equilibrium = (High + Low) / 2.
2. **Zoning**:
- **Discount**: Below equilibrium (institutional buying opportunity).
- **Premium**: Above equilibrium (potential selling pressure).
- **Quadrants**: 25% (q1) and 75% (q3) lines mark edges of the "mid-zone," where price often consolidates or traps retail before directional runs.
3. **Plotting**: On the last bar, draws boxes/lines from the range start to current bar. Labels show levels (e.g., "IPDA20 High @ 1.2345").
4. **Usage Example**: On EURUSD daily, enable IPDA20. If price pierces a premium wick's low into the lower quadrant during a bullish shift (per ICT), expect a run to liquidity—use the table's % reading to gauge strength (e.g., <25% = deep discount buy). Transpose to 5-min for entries aligning with FVGs or order blocks.
**Trading Tips**
- **Higher Timeframe Bias**: Use on daily/4H for structure; drop to 1H/15M for entries. Focus on bodies (not wicks) respecting quadrants—wicks signal traps.
- **ICT Alignment**: Pair with PD Arrays (premium/discount wicks) or Market Maker models. In trends, extend to IPDA40/60; ignore extremes unless full reversals occur.
- **Risk Management**: Target liquidity pools at equal highs/lows. Avoid overleveraging—IPDA shines in 7–10 AM ET for optimal delivery. Backtest random 20-day periods to validate.
- **Best For**: Forex, indices (e.g., NAS100), commodities (e.g., Gold). Test on demo first.
Special Thanks to toodegrees for sharing the original base script.
More features to be added.
**Disclaimer**
This indicator is for educational purposes only and does not constitute financial advice. Past performance isn't indicative of future results. Trading involves substantial risk—use at your own discretion. Hypothetical results may not reflect real-market factors like slippage or liquidity. Always consult a licensed advisor.
**Author**: © MadMonkTrading (Mozilla Public License 2.0)
**Version**: Pine Script v5 | Questions? Drop a comment below!
**Version**: Pine Script v5 | Questions? Drop a comment below!
Open-source Skript
Ganz im Sinne von TradingView hat dieser Autor sein/ihr Script als Open-Source veröffentlicht. Auf diese Weise können nun auch andere Trader das Script rezensieren und die Funktionalität überprüfen. Vielen Dank an den Autor! Sie können das Script kostenlos verwenden, aber eine Wiederveröffentlichung des Codes unterliegt unseren Hausregeln.
Haftungsausschluss
Die Informationen und Veröffentlichungen sind nicht als Finanz-, Anlage-, Handels- oder andere Arten von Ratschlägen oder Empfehlungen gedacht, die von TradingView bereitgestellt oder gebilligt werden, und stellen diese nicht dar. Lesen Sie mehr in den Nutzungsbedingungen.