OPEN-SOURCE SCRIPT
Earnings Date Highlighter - from0_to_1
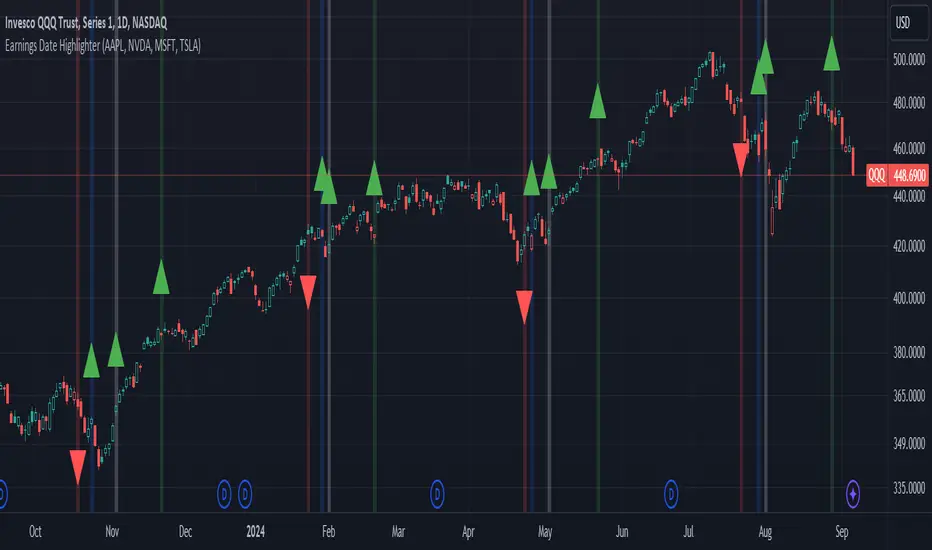
This indicator, called "Earnings Date Highlighter," is designed to visualize earnings data for up to four different stocks on a single chart. It's particularly useful for traders or investors who want to track earnings events for multiple companies simultaneously, such as the top holdings of an ETF.
Key features:
1. Tracks earnings data (estimates and actuals) for four user-defined symbols.
2. Plots earnings data points with customizable colors for each symbol.
3. Highlights earnings dates with background colors.
4. Displays green up arrows for earnings beats and red down arrows for earnings misses.
Why someone would use it:
1. To monitor earnings events for multiple stocks in a single view.
2. To quickly identify potential market-moving events for key components of an ETF or portfolio.
3. To spot patterns in earnings performance across different companies or sectors.
4. To help with timing trades or adjusting positions around earnings announcements.
This tool can be particularly valuable for investors focused on ETFs, as it allows them to visualize earnings dates and performance for the ETF's major holdings all in one place, potentially providing insights into how the ETF might behave around these key events.
Author:
tradingview.com/u/from0_to_1/
Open-source Skript
Ganz im Sinne von TradingView hat dieser Autor sein/ihr Script als Open-Source veröffentlicht. Auf diese Weise können nun auch andere Trader das Script rezensieren und die Funktionalität überprüfen. Vielen Dank an den Autor! Sie können das Script kostenlos verwenden, aber eine Wiederveröffentlichung des Codes unterliegt unseren Hausregeln.
Disclaimer: Not a personal finance professional or financial advisor. Any and all publications are opinion and not investment advice.
Haftungsausschluss
Die Informationen und Veröffentlichungen sind nicht als Finanz-, Anlage-, Handels- oder andere Arten von Ratschlägen oder Empfehlungen gedacht, die von TradingView bereitgestellt oder gebilligt werden, und stellen diese nicht dar. Lesen Sie mehr in den Nutzungsbedingungen.