OPEN-SOURCE SCRIPT
Rainbow MA- AYNET
Description
What it Does:
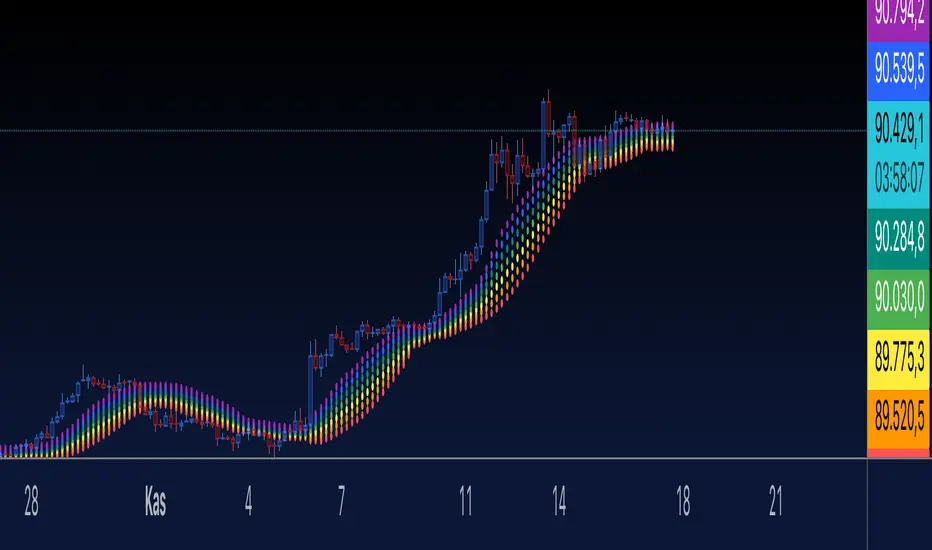
The Rainbow Indicator visualizes price action with a colorful "rainbow-like" effect.
It uses a moving average (SMA) and dynamically creates bands around it using standard deviation.
Features:
Seven bands are plotted, each corresponding to a different rainbow color (red to purple).
Each band is calculated using the moving average (ta.sma) and a smoothing multiplier (smooth) to control their spread.
User Inputs:
length: The length of the moving average (default: 14).
smooth: Controls the spacing between the bands (default: 0.5).
radius: Adjusts the size of the circular points (default: 3).
How it Works:
The bands are plotted above and below the moving average.
The offset for each band is calculated using standard deviation and a user-defined smoothing multiplier.
Plotting:
Each rainbow band is plotted individually using plot() with circular points (plot.style_circles).
Customization
You can modify the color palette, adjust the smoothing multiplier, or change the moving average length to suit your needs.
The number of bands can also be increased or decreased by adding/removing colors from the colors array and updating the loop.
If you have further questions or want to extend the indicator, let me know! 😊
What it Does:
The Rainbow Indicator visualizes price action with a colorful "rainbow-like" effect.
It uses a moving average (SMA) and dynamically creates bands around it using standard deviation.
Features:
Seven bands are plotted, each corresponding to a different rainbow color (red to purple).
Each band is calculated using the moving average (ta.sma) and a smoothing multiplier (smooth) to control their spread.
User Inputs:
length: The length of the moving average (default: 14).
smooth: Controls the spacing between the bands (default: 0.5).
radius: Adjusts the size of the circular points (default: 3).
How it Works:
The bands are plotted above and below the moving average.
The offset for each band is calculated using standard deviation and a user-defined smoothing multiplier.
Plotting:
Each rainbow band is plotted individually using plot() with circular points (plot.style_circles).
Customization
You can modify the color palette, adjust the smoothing multiplier, or change the moving average length to suit your needs.
The number of bands can also be increased or decreased by adding/removing colors from the colors array and updating the loop.
If you have further questions or want to extend the indicator, let me know! 😊
Open-source Skript
Ganz im Sinne von TradingView hat dieser Autor sein/ihr Script als Open-Source veröffentlicht. Auf diese Weise können nun auch andere Trader das Script rezensieren und die Funktionalität überprüfen. Vielen Dank an den Autor! Sie können das Script kostenlos verwenden, aber eine Wiederveröffentlichung des Codes unterliegt unseren Hausregeln.
Haftungsausschluss
Die Informationen und Veröffentlichungen sind nicht als Finanz-, Anlage-, Handels- oder andere Arten von Ratschlägen oder Empfehlungen gedacht, die von TradingView bereitgestellt oder gebilligt werden, und stellen diese nicht dar. Lesen Sie mehr in den Nutzungsbedingungen.