OPEN-SOURCE SCRIPT
💸 Monetary Momentum Oscillator (MMO)
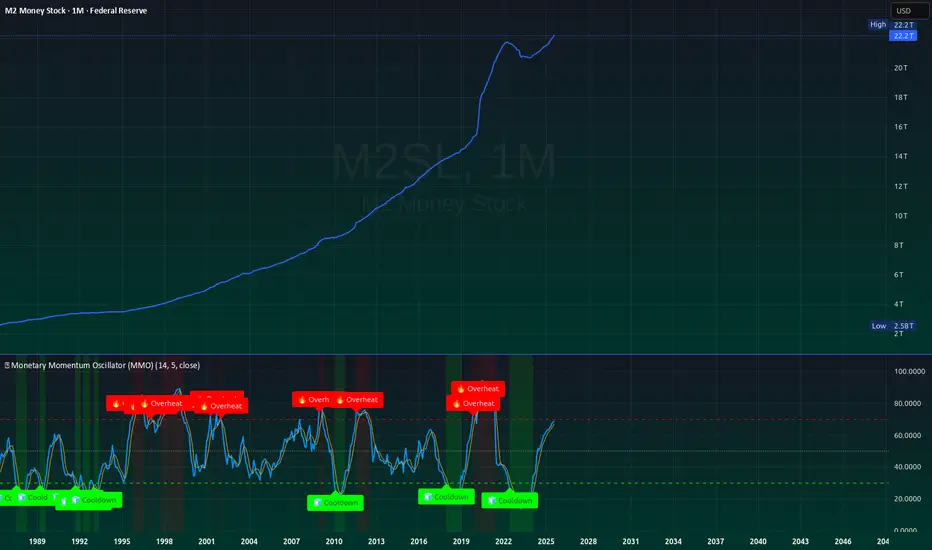
Monetary Momentum Oscillator (MMO)
The Monetary Momentum Oscillator (MMO) measures the rate of change in the money supply (like M2, Fed Balance Sheet, or similar macro series) and applies a momentum-based RSI calculation to visualize liquidity acceleration and deceleration.
💡 Purpose:
MMO is designed for macro-level analysis — it identifies when monetary expansion is overheating (potential inflation or risk-on conditions) and when contraction is cooling off (liquidity tightening or deflationary stress).
📊 How It Works:
Calculates the percentage change of the selected data source over a chosen lookback period.
Applies an RSI transformation to visualize momentum extremes.
Overlays signal smoothing and highlights overheat/cooldown zones.
🔍 Interpretation:
Above 70 → Liquidity acceleration / overheating (potential inflationary impulse).
Below 30 → Liquidity deceleration / contraction (risk-off, tightening).
Crossovers → Momentum shifts that often precede macro trend reversals in risk assets.
⚙️ Best Used On:
Macroeconomic series such as M2SL, M2V, WALCL, or custom liquidity indexes.
Long-term charts (weekly or monthly) for detecting major monetary regime transitions.
🧩 Core Idea:
Liquidity is the real market engine — this oscillator quantifies its pulse.
Open-source Skript
Ganz im Sinne von TradingView hat dieser Autor sein/ihr Script als Open-Source veröffentlicht. Auf diese Weise können nun auch andere Trader das Script rezensieren und die Funktionalität überprüfen. Vielen Dank an den Autor! Sie können das Script kostenlos verwenden, aber eine Wiederveröffentlichung des Codes unterliegt unseren Hausregeln.
Haftungsausschluss
Die Informationen und Veröffentlichungen sind nicht als Finanz-, Anlage-, Handels- oder andere Arten von Ratschlägen oder Empfehlungen gedacht, die von TradingView bereitgestellt oder gebilligt werden, und stellen diese nicht dar. Lesen Sie mehr in den Nutzungsbedingungen.