OPEN-SOURCE SCRIPT
COT-Index-NocTrading

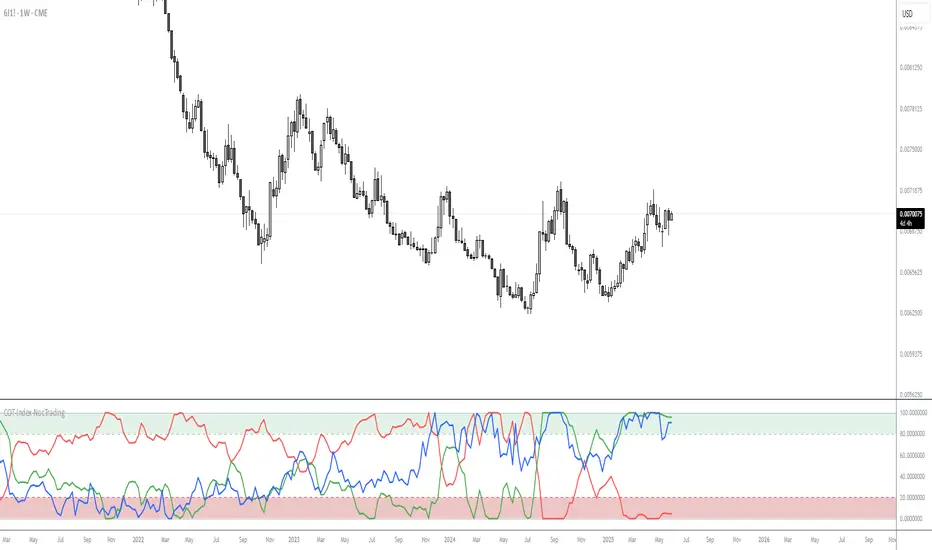
COT Index Indicator
The COT Index Indicator is a powerful tool designed to visualize the Commitment of Traders (COT) data and offer insights into market sentiment. The COT Index is a measurement of the relative positioning of commercial traders versus non-commercial and retail traders in the futures market. It is widely used to identify potential market reversals by observing the extremes in trader positioning.
Customizable Timeframe: The indicator allows you to choose a custom time interval (in months) to visualize the COT data, making it flexible to fit different trading styles and strategies.
How to Use:
Visualize Market Sentiment: A COT Index near extremes (close to 0 or 100) can indicate potential turning points in the market, as it reflects extreme positioning of different market participant groups.
Adjust the Time Interval: The ability to adjust the time interval (in months) gives traders the flexibility to analyze the market over different periods, which can be useful in detecting longer-term trends or short-term shifts in sentiment.
Combine with Other Indicators: To enhance your analysis, combine the COT Index with your technical analysis.
This tool can serve as an invaluable addition to your trading strategy, providing a deeper understanding of the market dynamics and the positioning of major market participants.
Open-source Skript
Ganz im Sinne von TradingView hat dieser Autor sein/ihr Script als Open-Source veröffentlicht. Auf diese Weise können nun auch andere Trader das Script rezensieren und die Funktionalität überprüfen. Vielen Dank an den Autor! Sie können das Script kostenlos verwenden, aber eine Wiederveröffentlichung des Codes unterliegt unseren Hausregeln.
Haftungsausschluss
Die Informationen und Veröffentlichungen sind nicht als Finanz-, Anlage-, Handels- oder andere Arten von Ratschlägen oder Empfehlungen gedacht, die von TradingView bereitgestellt oder gebilligt werden, und stellen diese nicht dar. Lesen Sie mehr in den Nutzungsbedingungen.