OPEN-SOURCE SCRIPT
Custom SMA Plot
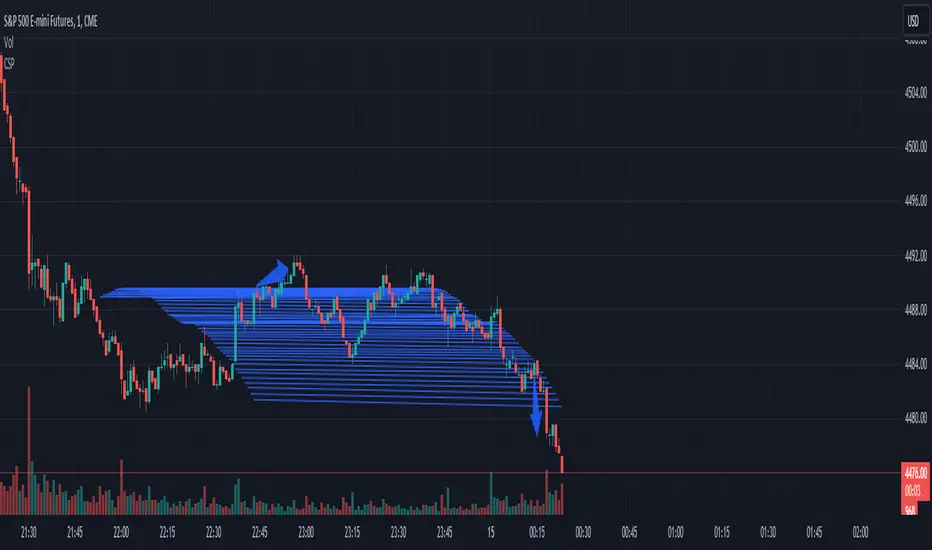
It creates a custom indicator named "Custom SMA Plot (CSP)" that overlays on a price chart. The indicator fetches the closing prices and calculates a 14-period simple moving average (SMA) of these prices. This SMA is then visually represented as a blue line, which starts from the SMA value of the bar 100 candles ago and extends to the current bar's SMA value. The line has a thickness of 1 unit.
When price breaks over wave go long.
When price breaks below wave go short.
When price breaks over wave go long.
When price breaks below wave go short.
Open-source Skript
Ganz im Sinne von TradingView hat dieser Autor sein/ihr Script als Open-Source veröffentlicht. Auf diese Weise können nun auch andere Trader das Script rezensieren und die Funktionalität überprüfen. Vielen Dank an den Autor! Sie können das Script kostenlos verwenden, aber eine Wiederveröffentlichung des Codes unterliegt unseren Hausregeln.
Haftungsausschluss
Die Informationen und Veröffentlichungen sind nicht als Finanz-, Anlage-, Handels- oder andere Arten von Ratschlägen oder Empfehlungen gedacht, die von TradingView bereitgestellt oder gebilligt werden, und stellen diese nicht dar. Lesen Sie mehr in den Nutzungsbedingungen.