OPEN-SOURCE SCRIPT
Aktualisiert Seasonality Table - Tabular Form
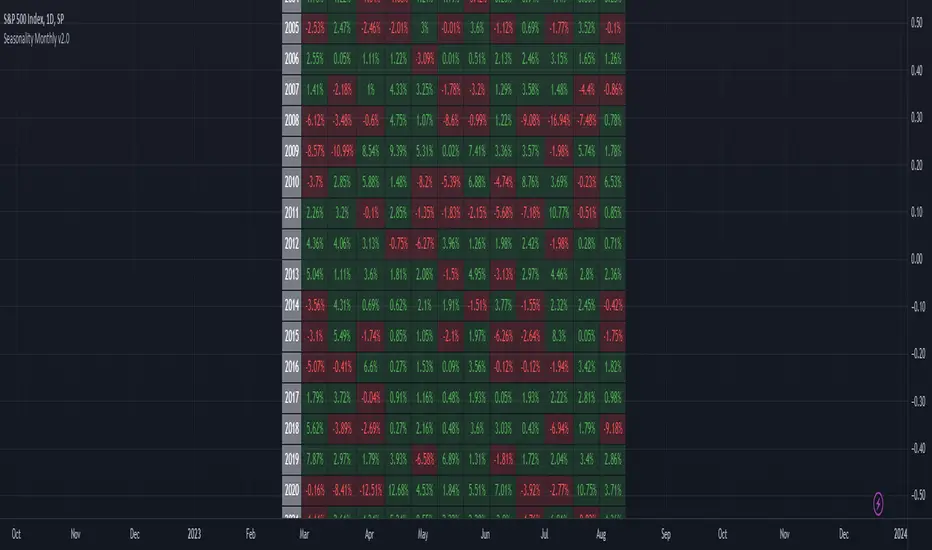
This indicator displays the seasonality data for any instrument (index/stock/futures/currency) in a tabular data.
User can change the start of the year for analysis from the inputs.
Year is represented in rows and Month is represented in cols.
This indicator uses Monthly Data feed to calculate the % change
Summary data for the month is displayed as the last row
User can change the start of the year for analysis from the inputs.
Year is represented in rows and Month is represented in cols.
This indicator uses Monthly Data feed to calculate the % change
Summary data for the month is displayed as the last row
Versionshinweise
Updated chartVersionshinweise
Switched to Daily feed from Monthly as Monthly feed is not reliable for US futures dataVersionshinweise
Added versioningVersionshinweise
- Added a new row at the bottom to show positive / total count
Versionshinweise
Fixed US Futures Sunday Open issueVersionshinweise
Switched calculation to Monthly close levels instead of accumulating % Daily Gains.Open-source Skript
Ganz im Sinne von TradingView hat dieser Autor sein/ihr Script als Open-Source veröffentlicht. Auf diese Weise können nun auch andere Trader das Script rezensieren und die Funktionalität überprüfen. Vielen Dank an den Autor! Sie können das Script kostenlos verwenden, aber eine Wiederveröffentlichung des Codes unterliegt unseren Hausregeln.
Haftungsausschluss
Die Informationen und Veröffentlichungen sind nicht als Finanz-, Anlage-, Handels- oder andere Arten von Ratschlägen oder Empfehlungen gedacht, die von TradingView bereitgestellt oder gebilligt werden, und stellen diese nicht dar. Lesen Sie mehr in den Nutzungsbedingungen.
Open-source Skript
Ganz im Sinne von TradingView hat dieser Autor sein/ihr Script als Open-Source veröffentlicht. Auf diese Weise können nun auch andere Trader das Script rezensieren und die Funktionalität überprüfen. Vielen Dank an den Autor! Sie können das Script kostenlos verwenden, aber eine Wiederveröffentlichung des Codes unterliegt unseren Hausregeln.
Haftungsausschluss
Die Informationen und Veröffentlichungen sind nicht als Finanz-, Anlage-, Handels- oder andere Arten von Ratschlägen oder Empfehlungen gedacht, die von TradingView bereitgestellt oder gebilligt werden, und stellen diese nicht dar. Lesen Sie mehr in den Nutzungsbedingungen.