OPEN-SOURCE SCRIPT
Aktualisiert Recession Indicator (Unemployment Rate)
Unemployment rate
percentage of unemployed individuals in an economy among individuals currently in the labour force. It is calcuated as Unemployed IndividualsTotal Labour Force × 100 where unemployed individuals are those who are currently not working but are actively seeking work.
The unemployment rate is one of the primary economic indicators used to measure the health of an economy. It tends to fluctuate with the business cycle, increasing during recessions and decreasing during expansions. It is among the indicators most commonly watched by policy makers, investors, and the general public.
Policy makers and central banks consider how much the unemployment rate has increased during a particular recession to gauge the recession’s impact on the economy and to decide how to tailor fiscal and monetary policies to mitigate its adverse effects. In addition, central banks carefully try to predict the future trend of the unemployment rate to devise long-term strategies to lower it.
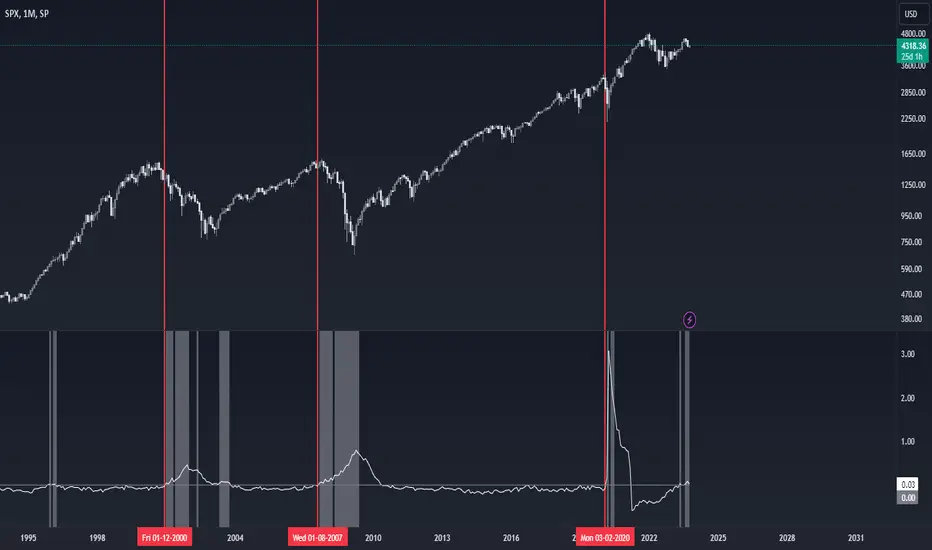
This indicator is a representation of yearly rate of change of Unemployment rate. Historically (not always) when ROC(Yearly) of Unemployment rate crossover zero line was a signal of recession or economic contraction.
percentage of unemployed individuals in an economy among individuals currently in the labour force. It is calcuated as Unemployed IndividualsTotal Labour Force × 100 where unemployed individuals are those who are currently not working but are actively seeking work.
The unemployment rate is one of the primary economic indicators used to measure the health of an economy. It tends to fluctuate with the business cycle, increasing during recessions and decreasing during expansions. It is among the indicators most commonly watched by policy makers, investors, and the general public.
Policy makers and central banks consider how much the unemployment rate has increased during a particular recession to gauge the recession’s impact on the economy and to decide how to tailor fiscal and monetary policies to mitigate its adverse effects. In addition, central banks carefully try to predict the future trend of the unemployment rate to devise long-term strategies to lower it.
This indicator is a representation of yearly rate of change of Unemployment rate. Historically (not always) when ROC(Yearly) of Unemployment rate crossover zero line was a signal of recession or economic contraction.
Versionshinweise
Added commentsOpen-source Skript
Ganz im Sinne von TradingView hat dieser Autor sein/ihr Script als Open-Source veröffentlicht. Auf diese Weise können nun auch andere Trader das Script rezensieren und die Funktionalität überprüfen. Vielen Dank an den Autor! Sie können das Script kostenlos verwenden, aber eine Wiederveröffentlichung des Codes unterliegt unseren Hausregeln.
Haftungsausschluss
Die Informationen und Veröffentlichungen sind nicht als Finanz-, Anlage-, Handels- oder andere Arten von Ratschlägen oder Empfehlungen gedacht, die von TradingView bereitgestellt oder gebilligt werden, und stellen diese nicht dar. Lesen Sie mehr in den Nutzungsbedingungen.
Open-source Skript
Ganz im Sinne von TradingView hat dieser Autor sein/ihr Script als Open-Source veröffentlicht. Auf diese Weise können nun auch andere Trader das Script rezensieren und die Funktionalität überprüfen. Vielen Dank an den Autor! Sie können das Script kostenlos verwenden, aber eine Wiederveröffentlichung des Codes unterliegt unseren Hausregeln.
Haftungsausschluss
Die Informationen und Veröffentlichungen sind nicht als Finanz-, Anlage-, Handels- oder andere Arten von Ratschlägen oder Empfehlungen gedacht, die von TradingView bereitgestellt oder gebilligt werden, und stellen diese nicht dar. Lesen Sie mehr in den Nutzungsbedingungen.