OPEN-SOURCE SCRIPT
Aktualisiert Buyer/Seller Dominance ©TMW

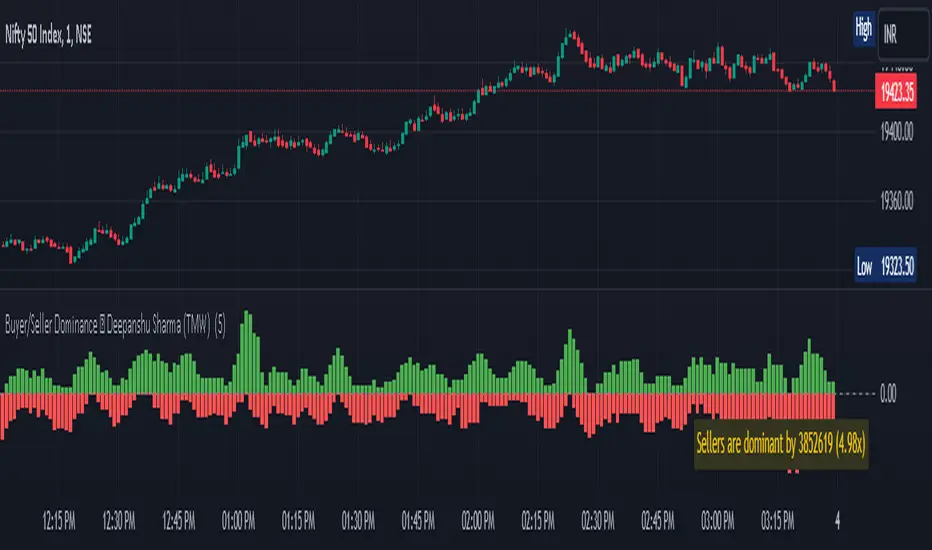
The "Buyer/Seller Dominance" indicator script, developed by Deepanshu Sharma under The Market Wisdom (TMW), is a powerful analytical tool designed for use on the TradingView platform. This script is released under the Mozilla Public License 2.0, and it offers traders and investors an innovative perspective on market dynamics by assessing the relative strength of buyers and sellers within a given time frame.
Key Features:
1. Dominance Calculation: The indicator calculates the dominance of buyers and sellers over a specified number of candles. Users can define the number of candles (`n`) to consider in the dominance calculation.
2. Visual Representation: The script provides a visual representation of buyer and seller dominance using colored columns on the price chart. Green columns represent buyer dominance, while red columns represent seller dominance.
3. Balance Line: The indicator includes a dashed horizontal line at the zero level, representing a balance point between buyer and seller dominance. When the green and red columns cross this line, it signifies shifts in market sentiment.
How it Works:
The script divides the historical price data into segments of specified candle count (`n`) and assesses each segment's dominance. It calculates the volume associated with both green (bullish) and red (bearish) candles within each segment.
If a candle's closing price is higher than its opening price, it is considered a green candle. Similarly, if the closing price is lower than the opening price, the candle is classified as red. The volume of each respective type of candle is then accumulated for each segment.
The script plots the cumulative green candle volume as the "Buyer Dominance" column and the cumulative red candle volume as the "Seller Dominance" column. This visual representation helps traders gauge the ebb and flow of buyer and seller strength in the market.
Disclaimer:
The indicator is provided for informational purposes only and should not be considered as financial advice. It's important to conduct thorough research and analysis before making any trading decisions. The creator, Deepanshu Sharma, and "The Market Wisdom" team are not responsible for any trading losses incurred based on the usage of this indicator.
Remember that trading involves risks, and historical performance may not necessarily predict future results. Always consider multiple indicators, market trends, and risk management strategies when making trading decisions.
Versionshinweise
This updated version of the Buyer/Seller Dominance script displays a disclaimer indicating whether buyers or sellers are dominant in the market. The script calculates the dominance by comparing the total volume of green and red candles over a user-defined number of candles. The calculated dominance is displayed as a disclaimer in a table in the bottom right corner of the chart. This provides traders with an additional visual cue to help them make informed trading decisions.Versionshinweise
In this version of the script, the disclaimer section reveals whether buyers or sellers hold more power in trading. It calculates the gap between green (buyers) and red (sellers) candle volumes. If green is larger, it indicates "Buyers dominate by a certain amount (ratio)." If red is larger, it states "Sellers dominate by a certain amount (ratio)." Equal volumes mean "Buyers and sellers are balanced."Versionshinweise
Adjusted disclaimer sizeVersionshinweise
For backtesting, key data is displayed in the status line, offering a quick overview of a strategy's historical performance.Versionshinweise
The size of the disclaimer has been shortenedVersionshinweise
The disclaimer is now positioned in the center at the bottom.Open-source Skript
Ganz im Sinne von TradingView hat dieser Autor sein/ihr Script als Open-Source veröffentlicht. Auf diese Weise können nun auch andere Trader das Script rezensieren und die Funktionalität überprüfen. Vielen Dank an den Autor! Sie können das Script kostenlos verwenden, aber eine Wiederveröffentlichung des Codes unterliegt unseren Hausregeln.
Haftungsausschluss
Die Informationen und Veröffentlichungen sind nicht als Finanz-, Anlage-, Handels- oder andere Arten von Ratschlägen oder Empfehlungen gedacht, die von TradingView bereitgestellt oder gebilligt werden, und stellen diese nicht dar. Lesen Sie mehr in den Nutzungsbedingungen.
Open-source Skript
Ganz im Sinne von TradingView hat dieser Autor sein/ihr Script als Open-Source veröffentlicht. Auf diese Weise können nun auch andere Trader das Script rezensieren und die Funktionalität überprüfen. Vielen Dank an den Autor! Sie können das Script kostenlos verwenden, aber eine Wiederveröffentlichung des Codes unterliegt unseren Hausregeln.
Haftungsausschluss
Die Informationen und Veröffentlichungen sind nicht als Finanz-, Anlage-, Handels- oder andere Arten von Ratschlägen oder Empfehlungen gedacht, die von TradingView bereitgestellt oder gebilligt werden, und stellen diese nicht dar. Lesen Sie mehr in den Nutzungsbedingungen.