OPEN-SOURCE SCRIPT
DCI
### 📌 **DCI – Direction Correlation Index**
#### 🔹 **What It Is**
The **Direction Correlation Index (DCI)** is a tool for measuring how closely a group of up to 10 symbols move together in both *trend correlation* and *short-term direction*. It helps identify whether a group of assets is acting in unison or moving independently.
---
#### ⚙️ **How It Works**
DCI outputs three key metrics:
1. **Average Correlation**
* Measures the average of all pairwise correlations between the selected symbols.
* Prices are first standardized using a z-score (based on simple moving average and standard deviation over a user-defined lookback period).
* Correlation is calculated using Pearson’s method for all 45 symbol pairs.
* Result ranges from:
* `+1.00` = strong positive correlation
* `0.00` = no correlation
* `-1.00` = strong inverse correlation
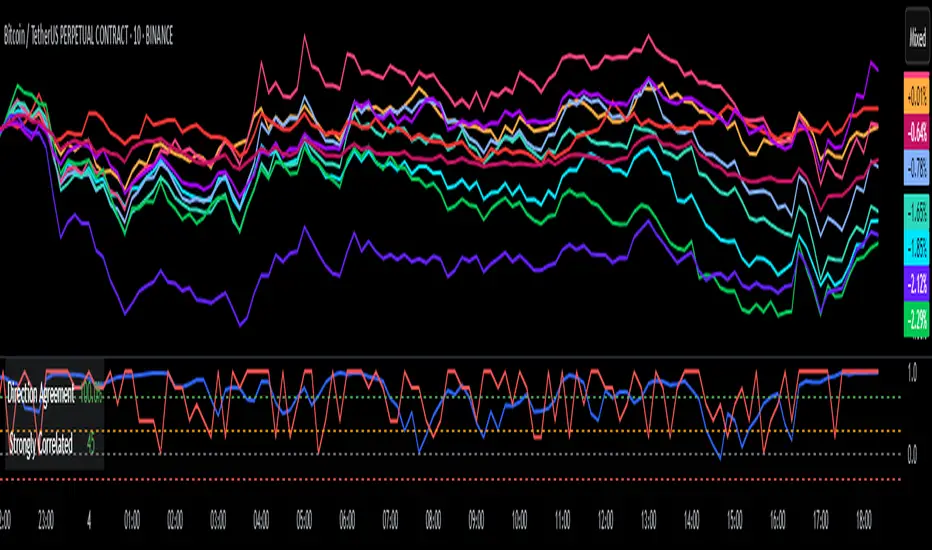
2. **Direction Agreement %**
* Checks whether each symbol is moving up or down compared to its previous bar.
* Calculates the percentage of symbols moving in the same direction.
* For example: if 7 of 10 symbols are moving up and 3 are moving down, the direction agreement is 70%.
3. **Strong Correlation Count**
* Counts how many of the 45 symbol pairs have an absolute correlation above `0.7`.
* Helps highlight how many pairs are currently highly correlated.
---
#### 📈 **How to Use It**
1. **Select Symbols**
* In the **Settings**, you can input up to 10 custom symbols. These can be stocks, indices, forex pairs, crypto, or any tradable asset.
2. **Adjust the Lookback Period**
* Defines how many bars back are used to calculate z-scores and correlations.
* Default is `12`. Use shorter periods for faster response; longer periods for smoother, slower data.
3. **Interpret the Table (Plotted on Chart)**
* **Avg Corr**: Tells you how much the group is co-moving. High correlation often reflects unified market behavior.
* **Dir Agr %**: Shows directional sync. High values mean most instruments are trending the same way in the current bar.
* **> 0.7**: The number of pairs currently strongly correlated (|corr| > 0.7).
---
#### 🧠 **Practical Usage Tips**
* Use DCI to monitor **sector alignment**, **portfolio behavior**, or **market group momentum**.
* Confirm trend strength by checking if high correlation aligns with a strong direction agreement.
* Low correlation + mixed direction can signal **choppy or indecisive markets**.
* High correlation + strong direction = **trend confirmation** across your selected instruments.
- Made with DeepSeek
#### 🔹 **What It Is**
The **Direction Correlation Index (DCI)** is a tool for measuring how closely a group of up to 10 symbols move together in both *trend correlation* and *short-term direction*. It helps identify whether a group of assets is acting in unison or moving independently.
---
#### ⚙️ **How It Works**
DCI outputs three key metrics:
1. **Average Correlation**
* Measures the average of all pairwise correlations between the selected symbols.
* Prices are first standardized using a z-score (based on simple moving average and standard deviation over a user-defined lookback period).
* Correlation is calculated using Pearson’s method for all 45 symbol pairs.
* Result ranges from:
* `+1.00` = strong positive correlation
* `0.00` = no correlation
* `-1.00` = strong inverse correlation
2. **Direction Agreement %**
* Checks whether each symbol is moving up or down compared to its previous bar.
* Calculates the percentage of symbols moving in the same direction.
* For example: if 7 of 10 symbols are moving up and 3 are moving down, the direction agreement is 70%.
3. **Strong Correlation Count**
* Counts how many of the 45 symbol pairs have an absolute correlation above `0.7`.
* Helps highlight how many pairs are currently highly correlated.
---
#### 📈 **How to Use It**
1. **Select Symbols**
* In the **Settings**, you can input up to 10 custom symbols. These can be stocks, indices, forex pairs, crypto, or any tradable asset.
2. **Adjust the Lookback Period**
* Defines how many bars back are used to calculate z-scores and correlations.
* Default is `12`. Use shorter periods for faster response; longer periods for smoother, slower data.
3. **Interpret the Table (Plotted on Chart)**
* **Avg Corr**: Tells you how much the group is co-moving. High correlation often reflects unified market behavior.
* **Dir Agr %**: Shows directional sync. High values mean most instruments are trending the same way in the current bar.
* **> 0.7**: The number of pairs currently strongly correlated (|corr| > 0.7).
---
#### 🧠 **Practical Usage Tips**
* Use DCI to monitor **sector alignment**, **portfolio behavior**, or **market group momentum**.
* Confirm trend strength by checking if high correlation aligns with a strong direction agreement.
* Low correlation + mixed direction can signal **choppy or indecisive markets**.
* High correlation + strong direction = **trend confirmation** across your selected instruments.
- Made with DeepSeek
Open-source Skript
Ganz im Sinne von TradingView hat dieser Autor sein/ihr Script als Open-Source veröffentlicht. Auf diese Weise können nun auch andere Trader das Script rezensieren und die Funktionalität überprüfen. Vielen Dank an den Autor! Sie können das Script kostenlos verwenden, aber eine Wiederveröffentlichung des Codes unterliegt unseren Hausregeln.
Haftungsausschluss
Die Informationen und Veröffentlichungen sind nicht als Finanz-, Anlage-, Handels- oder andere Arten von Ratschlägen oder Empfehlungen gedacht, die von TradingView bereitgestellt oder gebilligt werden, und stellen diese nicht dar. Lesen Sie mehr in den Nutzungsbedingungen.