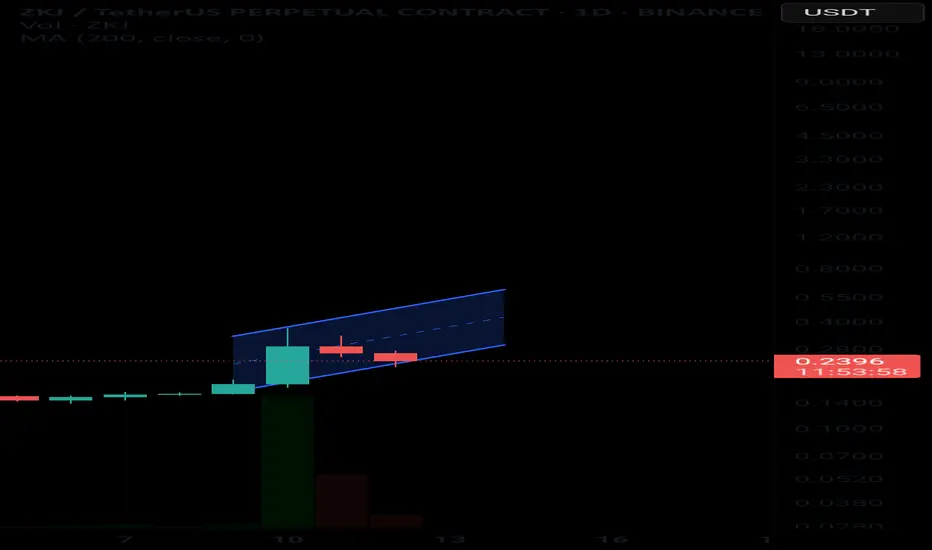
The ZKJUSDT chart on TradingView shows a clear bullish channel formation with the key support level at 0.23 USDT acting as the pivot. The price must consistently stay above this level to maintain the bullish trend, which aligns with the double bottom breakout confirmed earlier. Currently trading around 0.31 USDT, ZKJ has shown strong momentum with a recent high near 0.36 USDT, reflecting significant buying strength even in a volatile low-cap environment. Volume remains elevated, supporting the continuation of upward price action toward resistance targets near 0.36 and potentially 0.50 USDT if the bullish channel holds. A breakdown below 0.23 would signal risk of trend reversal or deeper correction. Overall, as long as price sustains above 0.23 USDT, ZKJ is positioned for further gains with strong technical support and upside potential in the near to mid term. Traders should monitor volume and retests of support for confirmation
Haftungsausschluss
Die Informationen und Veröffentlichungen sind nicht als Finanz-, Anlage-, Handels- oder andere Arten von Ratschlägen oder Empfehlungen gedacht, die von TradingView bereitgestellt oder gebilligt werden, und stellen diese nicht dar. Lesen Sie mehr in den Nutzungsbedingungen.
Haftungsausschluss
Die Informationen und Veröffentlichungen sind nicht als Finanz-, Anlage-, Handels- oder andere Arten von Ratschlägen oder Empfehlungen gedacht, die von TradingView bereitgestellt oder gebilligt werden, und stellen diese nicht dar. Lesen Sie mehr in den Nutzungsbedingungen.