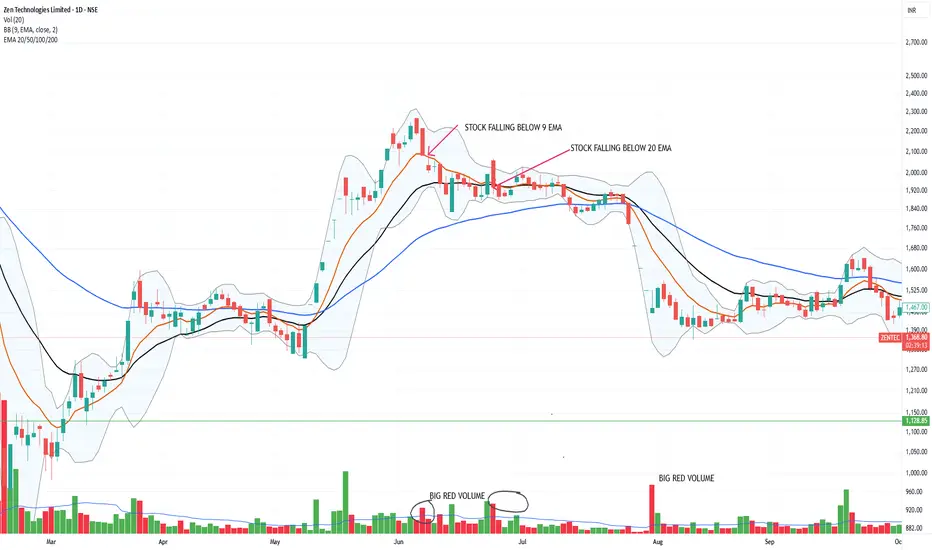
Exit strategy is just as important as entry strategy.
We can use a daily close under the EMA's to sell our position.
We can trim 25% of our position in a stock when its price close under the 9 EMA.
We can avoid fake breakdown by closely monitoring the Volume.
Either a big Red Volume Candle (Increased Selling Interest) is an indication of upcoming fall in the Price movement.
We can trim 25% of our position in a stock when its price close under the 21 EMA.
Again have a close observation on the Volume candle to confirm the weakness.
Sell full position when the price of the stock fall below 50 EMA.
Note: The above chart is for educational purpose only.
Haftungsausschluss
Die Informationen und Veröffentlichungen sind nicht als Finanz-, Anlage-, Handels- oder andere Arten von Ratschlägen oder Empfehlungen gedacht, die von TradingView bereitgestellt oder gebilligt werden, und stellen diese nicht dar. Lesen Sie mehr in den Nutzungsbedingungen.
Haftungsausschluss
Die Informationen und Veröffentlichungen sind nicht als Finanz-, Anlage-, Handels- oder andere Arten von Ratschlägen oder Empfehlungen gedacht, die von TradingView bereitgestellt oder gebilligt werden, und stellen diese nicht dar. Lesen Sie mehr in den Nutzungsbedingungen.