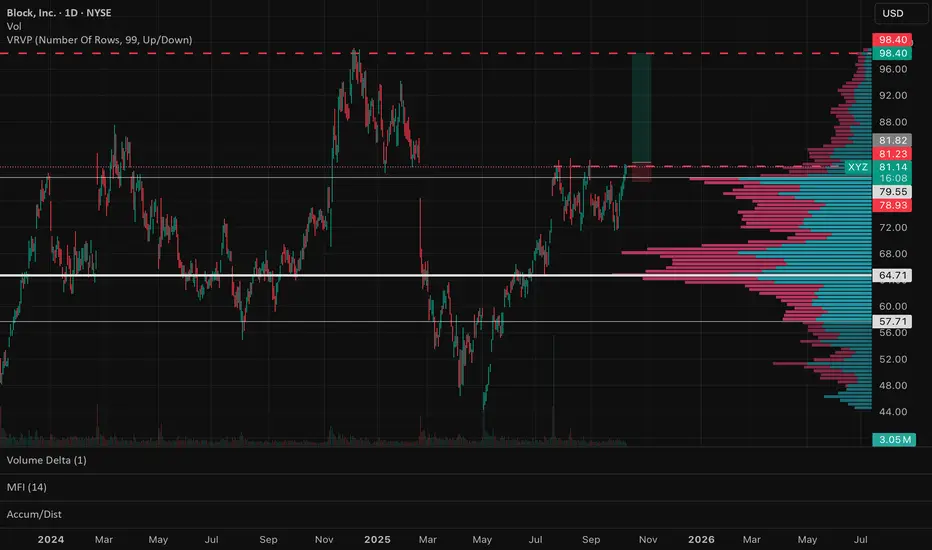
Following a significant downtrend, the stock  XYZ has been consolidating since May 2022, trading within a range of $45–$50 and $90.
Within this broad consolidation, the price has repeatedly reacted to the $81–$82 level. Recently, after a sharp rally from $45, the stock is now consolidating right below this levela, forming a bullish flag pattern.
A breakout to the upside could propel the price toward the $98–$99 level, as suggested by the volume profile. With a dynamic breakout and a tight stop-loss set around $78, the risk-reward ratio could exceed 5:1.
Haftungsausschluss
Die Informationen und Veröffentlichungen sind nicht als Finanz-, Anlage-, Handels- oder andere Arten von Ratschlägen oder Empfehlungen gedacht, die von TradingView bereitgestellt oder gebilligt werden, und stellen diese nicht dar. Lesen Sie mehr in den Nutzungsbedingungen.
Haftungsausschluss
Die Informationen und Veröffentlichungen sind nicht als Finanz-, Anlage-, Handels- oder andere Arten von Ratschlägen oder Empfehlungen gedacht, die von TradingView bereitgestellt oder gebilligt werden, und stellen diese nicht dar. Lesen Sie mehr in den Nutzungsbedingungen.