Gold has been trading within a range for eight trading days. On the daily chart, the 10-day and 7-day moving averages are flat, and the RSI indicator is adjusting towards the midline. On the 4-hour and 1-hour charts, the Bollinger Bands are narrowing, with the price hovering around the middle band. Currently, the short-term moving averages are turning downwards, and the MACD indicator is showing a death cross signal, but it's getting closer to the zero line, so a continuation of the sideways movement cannot be ruled out.
The large-scale daily range is locked at 4050-3900. Without breaking out of this range, a clear trend is unlikely. My current view is that a break above 4050 is insufficient for a bullish outlook, while a break below 3900 would indicate a significant decline. Both bulls and bears lack sustained momentum. We have consistently emphasized that gold is currently in a consolidation phase. Don't assume a major bullish surge or trend reversal just because there's a rebound. It's still in a sideways consolidation phase, and the overall center of gravity is still shifting downwards! The trading strategy is to buy low and sell high!
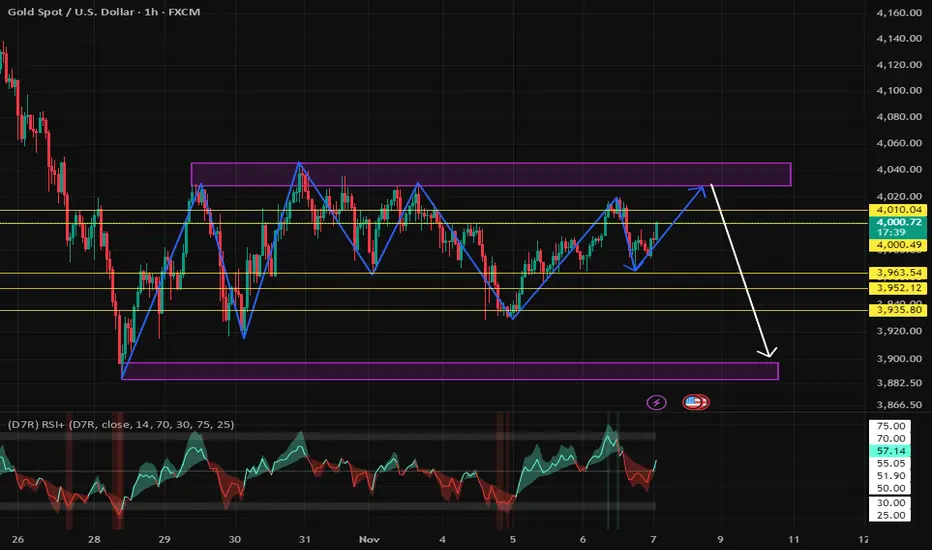
Key Levels:
First Support: 3963, Second Support: 3952, Third Support: 3936
First Resistance: 4000, Second Resistance: 4010, Third Resistance: 4028
Gold Trading Strategy:
Buy: 3960-3965, SL: 3950, TP: 3980-3990;
Sell: 4035-4040, SL: 4050, TP: 4020-4010;
More Analysis →
The large-scale daily range is locked at 4050-3900. Without breaking out of this range, a clear trend is unlikely. My current view is that a break above 4050 is insufficient for a bullish outlook, while a break below 3900 would indicate a significant decline. Both bulls and bears lack sustained momentum. We have consistently emphasized that gold is currently in a consolidation phase. Don't assume a major bullish surge or trend reversal just because there's a rebound. It's still in a sideways consolidation phase, and the overall center of gravity is still shifting downwards! The trading strategy is to buy low and sell high!
Key Levels:
First Support: 3963, Second Support: 3952, Third Support: 3936
First Resistance: 4000, Second Resistance: 4010, Third Resistance: 4028
Gold Trading Strategy:
Buy: 3960-3965, SL: 3950, TP: 3980-3990;
Sell: 4035-4040, SL: 4050, TP: 4020-4010;
More Analysis →
More free daily updates of signals and analysis
✅Gold Trading Knowledge Camp
💥Welcome to my Telegram channel: t.me/JungoldAnalyst
✅Gold Trading Knowledge Camp
💥Welcome to my Telegram channel: t.me/JungoldAnalyst
Haftungsausschluss
Die Informationen und Veröffentlichungen sind nicht als Finanz-, Anlage-, Handels- oder andere Arten von Ratschlägen oder Empfehlungen gedacht, die von TradingView bereitgestellt oder gebilligt werden, und stellen diese nicht dar. Lesen Sie mehr in den Nutzungsbedingungen.