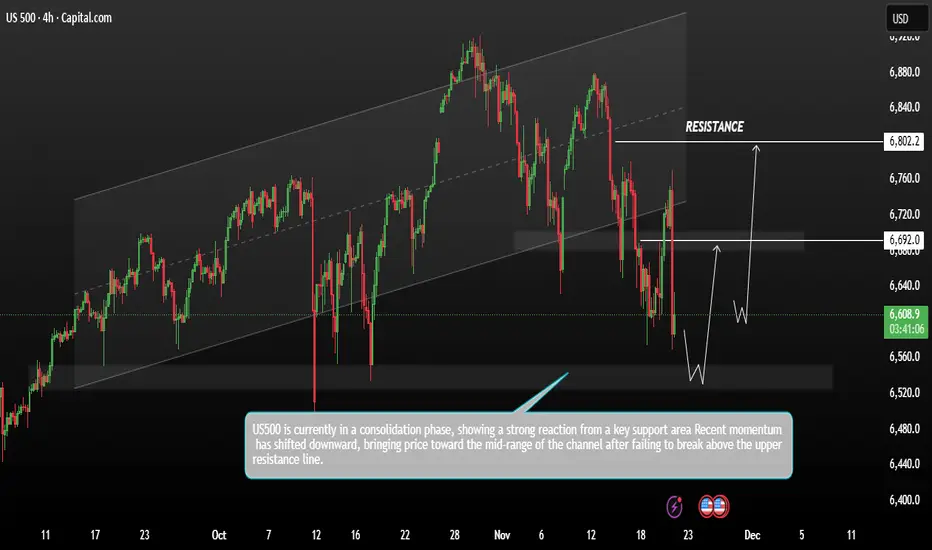
US500 price action moving within a broad ascending channel, with multiple touches on both the upper and lower trend boundaries. Recent momentum has shifted downward, bringing price toward the mid-range of the channel after failing to break above the upper resistance line.
A key support zone sits around 6,550–6,500, highlighted by a shaded region where previous buyers stepped in. The projection on the chart suggests a potential dip into this support area, forming a reversal pattern before pushing higher.
If a bullish rebound occurs from this support, the next critical level is the mid-range supply zone around 6,690 / 6,720. A successful breakout above this zone could open the path toward the major resistance area near 6,802, which is clearly marked as the upper target.
You may find more details in the chart.
Trade wisely best of luck buddies,
Ps; Support with like and comments for better analysis Thanks for Supporting.
Trade ist aktiv
Join My telegram Channel
t.me/AnalysisGold2
Free Forex Signals
t.me/Jamessignals11
t.me/AnalysisGold2
Free Forex Signals
t.me/Jamessignals11
Verbundene Veröffentlichungen
Haftungsausschluss
Die Informationen und Veröffentlichungen sind nicht als Finanz-, Anlage-, Handels- oder andere Arten von Ratschlägen oder Empfehlungen gedacht, die von TradingView bereitgestellt oder gebilligt werden, und stellen diese nicht dar. Lesen Sie mehr in den Nutzungsbedingungen.