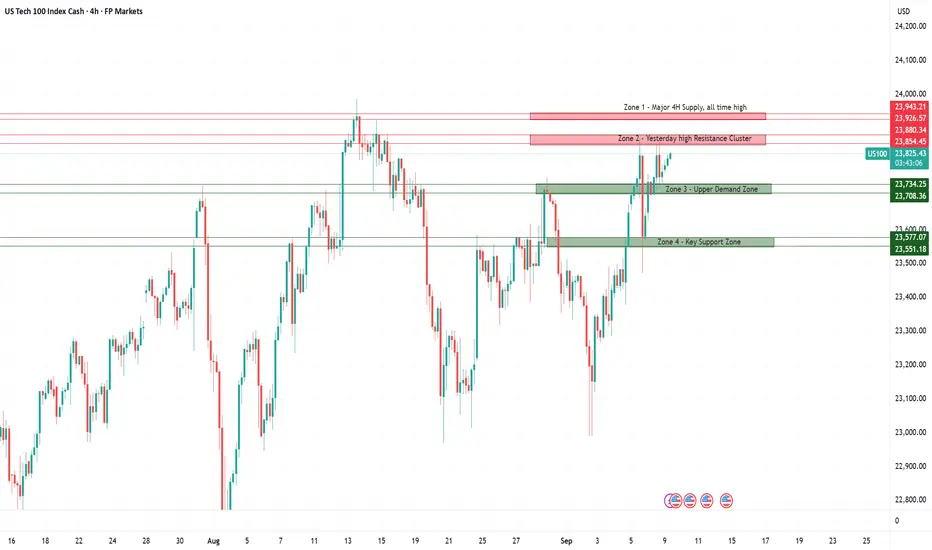
Key Zones Today
Supply Zones (Red)
Zone 1: 23,926 – 23,943
This is the upper resistance zone, located just below all time high. Sellers are likely positioned here, making it a strong area for potential rejection. A confirmed breakout and retest, however, would indicate buyer strength and could open the path toward new all-time highs.
Zone 2: 23,854 – 23,880
A key intraday supply area with multiple prior rejections. Often acts as a liquidity pool, where failed breakouts can trigger sharp downside moves. A clean break and hold above would flip this zone into short-term support for continuation longs.
Demand Zones (Green)
Zone 3: 23,708 – 23,734
Formed around the recent breakout structure, this zone is expected to attract buyers on pullbacks. A sharp bounce here would confirm demand strength, while a decisive break below flips the area into resistance and could trigger continuation shorts.
Zone 4: 23,551 – 23,577
A deeper support level, aligned with prior consolidation and buyer absorption. Strong bounce potential on first retest, but repeated tests weaken the level. A breakdown here would shift momentum clearly in favor of sellers and open space for a larger downside move.
Nas100 - Cautiously Bullish, Waiting on Momentum
Sentiment in the US100 is cautiously positive but fragile. Large-cap tech continues to support the index, and hopes of imminent Fed rate cuts provide additional tailwinds. Still, the index remains below its all-time high, and uncertainty around economic data and geopolitics keeps investors from going all-in.
In short: there is momentum and optimism, but it rests on a fragile foundation where a single weak data point could quickly shift sentiment.
Haftungsausschluss
Die Informationen und Veröffentlichungen sind nicht als Finanz-, Anlage-, Handels- oder andere Arten von Ratschlägen oder Empfehlungen gedacht, die von TradingView bereitgestellt oder gebilligt werden, und stellen diese nicht dar. Lesen Sie mehr in den Nutzungsbedingungen.
Haftungsausschluss
Die Informationen und Veröffentlichungen sind nicht als Finanz-, Anlage-, Handels- oder andere Arten von Ratschlägen oder Empfehlungen gedacht, die von TradingView bereitgestellt oder gebilligt werden, und stellen diese nicht dar. Lesen Sie mehr in den Nutzungsbedingungen.
