Technical Analysis (1H Chart)
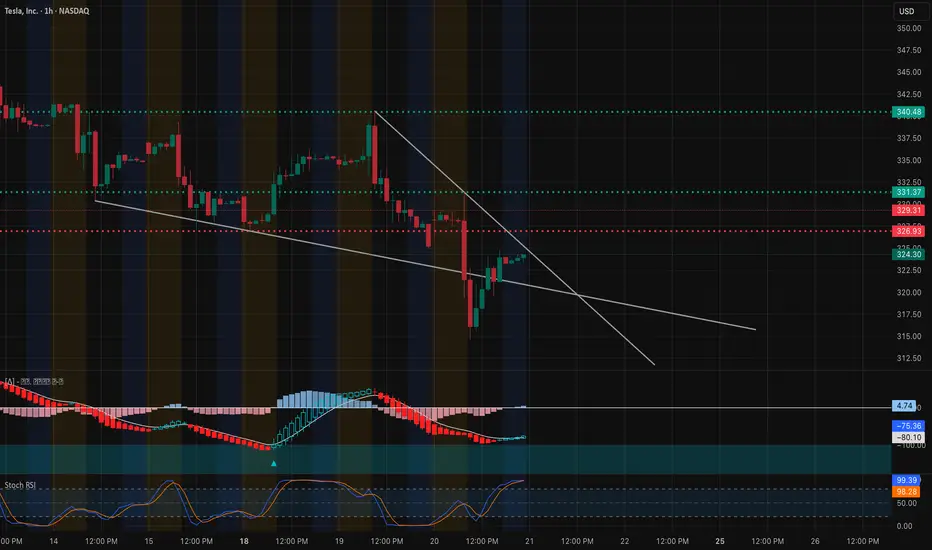
TSLA is currently trading near $324–325, bouncing after a sharp drop from the $340+ region.
* Trendline & Structure: Price is still under a descending trendline, which acts as immediate resistance. To shift bullish, TSLA must reclaim $331–332 (prior support turned resistance).
* Support Zone: Buyers stepped in around $317–320, which is now the short-term demand zone. Losing this could open downside into $312–315.
* Resistance Levels: First key resistance: $331–332, followed by $340–344 if momentum extends.
* Indicators:
* MACD: Bearish but showing signs of flattening out, suggesting momentum slowdown.
* Stoch RSI: Deeply oversold earlier, now pushing higher → potential for short-term bounce.
Scenarios:
* Bullish: If TSLA breaks above $331–332, momentum could push toward $340–344.
* Bearish: Rejection under $331 likely leads to retests of $320–317, with risk extending to $312–315.
Options Sentiment / GEX (1H)

From the GEX chart:
* Call Walls / Resistance:
* 340–345: Heavy call resistance zone (64%+ concentration) → strong cap unless major momentum shift.
* 348–350: Extreme resistance (GEX9 level).
* Put Walls / Support:
* 325: Highest negative NET GEX (dealer hedging zone), acting as strong support magnet.
* 320 / 317.5: Stacked put walls, critical defense area.
* 315: 2nd major put wall — losing this level could accelerate downside.
GEX Bias:
* Market makers pinned TSLA between 325 support and 340 resistance.
* Upside capped unless 332 is broken; downside risk grows sharply if 317 fails.
Trade Thoughts & Suggestions
* Bullish Setup: Calls only make sense above 332 (target 340–344).
* Bearish Setup: Favor puts if price rejects under 331 or breaks below 320 (target 317, then 315).
* Neutral chop likely if TSLA stalls between 325–331.
Disclaimer: This analysis is for educational purposes only and not financial advice. Trade at your own risk.
TSLA is currently trading near $324–325, bouncing after a sharp drop from the $340+ region.
* Trendline & Structure: Price is still under a descending trendline, which acts as immediate resistance. To shift bullish, TSLA must reclaim $331–332 (prior support turned resistance).
* Support Zone: Buyers stepped in around $317–320, which is now the short-term demand zone. Losing this could open downside into $312–315.
* Resistance Levels: First key resistance: $331–332, followed by $340–344 if momentum extends.
* Indicators:
* MACD: Bearish but showing signs of flattening out, suggesting momentum slowdown.
* Stoch RSI: Deeply oversold earlier, now pushing higher → potential for short-term bounce.
Scenarios:
* Bullish: If TSLA breaks above $331–332, momentum could push toward $340–344.
* Bearish: Rejection under $331 likely leads to retests of $320–317, with risk extending to $312–315.
Options Sentiment / GEX (1H)
From the GEX chart:
* Call Walls / Resistance:
* 340–345: Heavy call resistance zone (64%+ concentration) → strong cap unless major momentum shift.
* 348–350: Extreme resistance (GEX9 level).
* Put Walls / Support:
* 325: Highest negative NET GEX (dealer hedging zone), acting as strong support magnet.
* 320 / 317.5: Stacked put walls, critical defense area.
* 315: 2nd major put wall — losing this level could accelerate downside.
GEX Bias:
* Market makers pinned TSLA between 325 support and 340 resistance.
* Upside capped unless 332 is broken; downside risk grows sharply if 317 fails.
Trade Thoughts & Suggestions
* Bullish Setup: Calls only make sense above 332 (target 340–344).
* Bearish Setup: Favor puts if price rejects under 331 or breaks below 320 (target 317, then 315).
* Neutral chop likely if TSLA stalls between 325–331.
Disclaimer: This analysis is for educational purposes only and not financial advice. Trade at your own risk.
Haftungsausschluss
Die Informationen und Veröffentlichungen sind nicht als Finanz-, Anlage-, Handels- oder andere Arten von Ratschlägen oder Empfehlungen gedacht, die von TradingView bereitgestellt oder gebilligt werden, und stellen diese nicht dar. Lesen Sie mehr in den Nutzungsbedingungen.
Haftungsausschluss
Die Informationen und Veröffentlichungen sind nicht als Finanz-, Anlage-, Handels- oder andere Arten von Ratschlägen oder Empfehlungen gedacht, die von TradingView bereitgestellt oder gebilligt werden, und stellen diese nicht dar. Lesen Sie mehr in den Nutzungsbedingungen.